Open Journal of Civil Engineering, 2013, 3, 8-12
http://dx.doi.org/10.4236/ojce.2013.33B002 Published Online September 2013 (http://www.scirp.org/journal/ojce)
Copyright © 2013 SciRes. OJCE
Intrinsic Compression Behavior of Remolded and
Reconstitu ted Cla ys-Reappraisal
Jie Yin, Yonghong Miao
Department of Civil Engineering, Faculty of Civil Engineering and Mechanics, Jiangsu University, Zhenjiang, China
Email: yinjie@ujs.edu.cn
Received June 2013
ABSTRACT
Evaluating the impacts of soil structure on mechanical behavior for natural sedimentary clays is an important issue in
geotechnical engineering. Burland introduced void index for normalizing the compression curves of various remolded
and reconstituted clays to obtain the intrinsic compression line, which provides a reference framework to assess the
in-situ compression behavior. However, it does not quantitatively account for the effects of initial water content on
compressive behavior of remolded and reconstituted clays and the initial water contents of clays are not always limited
to 1.0 - 1.5 times the liquid limits defined by Burland. A modification bas ed on collected tests data was presented on the
expressions of
*
100
e
and
*
c
C
defined by Burland. Extensive oedometer test data were also collected on various re-
molded and reconstituted soils with distinct liquid limits and initial water contents to verify the validity of modified
expressions. A normalized compression line deduced by intrinsic compression line is proposed in the e-log p plot,
which can be used to evaluate the effects of soil structure quantitatively on the intact compressive behavior for natural
sedimentary clays.
Keywords: Initial Water Content; Compression Behavior; Remolded and Reconstituted Clays; Oedometer Test
1. Introduction
When encountered in situ, most natural sedimentary
clays show some form of structure ”. It has been well
accepted that the structure is formed during their deposi-
tional and the post depositional processes, where com-
plicated impacts such as mechanical, chemical and bio-
logical factors are brought into action [1]. The general
term “soil structure” is to mean the arrangement and
bonding of the soil constituents, and for simplicity it
contains all features of a soil that are different from those
of the corresponding reconstituted soil [2-4]. Various
experimental data suggests that the mechanical behavior
in situ state influenced by the soil struc ture is totally dif -
ferent from the remolded and reconstituted state [3]. How
to quantitatively assess the effects of soil structure on
mechanical behavior of natural sedimentary clays is an
important issue in geotechnical engineering [3]. For
solving this problem, the mechanical behavior of the re-
molded and reconstituted clays can be used to establish a
reference framework [3-5]. The most famous normalized
oedometer compression line is the intrinsic compression
line (ICL), which provides an available reference frame
to assess the in-situ compression behavior proposed. He
introduced void index for normalizing the compression
curves of various remolded and reconstituted clays hav-
ing an initial water content being 1.0 - 1.5 times the liq-
uid limit (preferably 1.25 times). However, it does not
quantitatively account for the effects of initial water con -
tent although he presented the existing tests data which
showed reconstituted clays at higher water contents had
higher values of the void ratio at applied stress less than
100 kPa. It is well known that natural water contents of
natural sedimentary soils vary in a wide spectrum of
times liquid limits [5], which are not always limited to
1.0 - 1.5 times the liquid limits.
Based on the existing tests data, th e intrinsic compres-
sion behavior of remolded and reconstituted clays was
briefly investigated and a modification was presented on
the expressions of *
100
e and
*
c
C
defined by Burland for
considering both the effects of liquid limit and initial
water content. A normalized compressive line is deduced
by intrinsic compression line to quantitatively evaluate
the effects of soil structure on the intact compressive
behavior for natural sedimentary clays.
2. Compression Curves of Remolded and
Reconstituted Soft Clays
42 different remolded and reconstituted soft clay samples
obtained from three different places in China were col-
lected for oedometer tests. Basic physical indices are
J. YIN, Y. H. MIAO
Copyright © 2013 SciRes. OJCE
9
shown in Table 1.
It should be noted that some of the soft clay samples in
Label 1 were reconstituted by adjusting its initial water
content (reconstituted clays), the others were just only
remolded (remolded clays). The initial water contents of
the 42 samples range from 0.7 to 2.0 times the liquid
limit. The ratio of initial water content w0 over liquid
limit LL is defined as initial normalized water index
0
*
w
[6], which can be expressed as follow
LLww /
0
*
0
=
(1)
The typical compressive curves are shown in Figure
1(a), Figure 1(b) and Figure 1(c) for the 42 remolded
and reconstituted clays respectively [7]. The legend in
each figure represented the initial water contents with the
values of
0
*
w
being 0.71 - 1.98, 0.68 - 1.99, 0.70 - 1.99
of each soil corresponding to Table 1. It can be seen that
all the compression curves are similar in shape being
slightly concave upwards when the consolidation pres-
sure is larger than some value respectively, as described
by Burland [3]. Comparing through the three figures,
when the soft clays with about the same initial norma-
lized water index
0
*
w
, at any given value of the consoli-
dation pressure, the larger the liquid limit, the higher the
void ratio is. When concerning any of Figure 1, at any
given value of the consolidation pressure, the larger the
initial water content, the higher the void ratio and higher
compressibility is. However, it is different from that of
Burland. It can be concluded that the compressive beha-
vior of remolded or reconstituted clays is influenced by
both the liquid limit and initial water content.
3. Intrinsic Compression Behavior
Burland stated that the properties of remolded or recons-
tituted clays are termed ‘intrinsic’ properties since they
are inherent to the soil and independent of the natural
state [3]. He presented a useful normalizing index called
void index Iv for normalizing the compressive behavior
of various remolded and reconstituted clays. The void
index is defined as following expression
∗∗
=
=
c
vC
ee
ee
ee
I100
1000100
100
(2)
The quantities *
100
e and
*
1000
e
are the void ratios cor-
responding to the app lied stress
'
v
σ
= 100k Pa and 1000
kPa of the reconstituted clay at an initial water content w0
of 1.0 - 1.5 times the liquid limit, respectively.
c
C
is
the intrinsic compression index which equals to
*
100
e
minus
*
1000
e
.
Then a reasonably unique compression line termed in-
trinsic compression line (ICL) is obtained, expressed as
follow
Iv = 2.45 - 1.285x + 0.015x3 (3)
where
'
log
v
x
σ
=
in kPa.
When the oedometer tests are not conducted on the
remolded and reconstituted soils, the values of
*
100
e
and
*
1000
e
can be approximately calculated by the following
equatio ns (Burla nd 1990).
Table 1. Basic physical indices of remolded and reconstituted soft clays.
Soil sample number Sampling site Gs w0 (%) LL (%) PL (%)
0
*
w
1 - 14 Huaian city 2.65 64.4 - 179.7 90.6 38 0.71 - 1.98
15 - 28 Lianyungang city 2.71 50.3 - 146.3 73.6 33 0.68 - 1.99
29 - 42 Fuzhou city 2.67 42.6 - 121.5 61.1 30 0.70 - 1.99
Consolidation stress (kPa)
Void ratio
64.4% 71.6%
82.5% 90.9%
100.8% 110.9%
118.6% 126.1%
136.9% 143.3%
153.3% 162.5%
173.9% 179.7%
0
1
2
3
4
0.11101001000 10000
Consolidation pressre (kPa)
Void ratio
50.3% 58.5%
68.3% 78.0%
84.8% 91.5%
96.0% 104.3%
114.0% 118.5%
126.8% 135.0%
141.8% 146.3%
0
0.5
1
1.5
2
2.5
3
3.5
0.1110100 1000
Consolidation pressure (kPa)
Void ratio
42.6% 48.3%
57.1% 61.7%
65.8% 72.3%
80.2% 86.9%
91.1% 99.1%
106.3% 110.2%
115.5% 121.5%
(a) (b) (c)
Figure 1. Typical e-logp compression curves of remolded and reconstituted soft clays (a) Lianyungang city clay, (b) Huaian
city clay (c), Fouzhou city clay.
J. YIN, Y. H. MIAO
Copyright © 2013 SciRes. OJCE
10
32
100
016.0089.0679.0109.0
LLL
eeee +−+=
(4)
04.0256.0 −=
Lc
eC
(5)
where eL represents the void ratio at liquid limit.
Burland has pointed out that the above empirical equa-
tions should only be used for values of eL within the
range 0.6 to 4.5 (i.e. wL = 25 to 160%).
According to the test data in Figure 1, the compres-
sion behavior of remolded and reconstituted clays is ob-
viously influenced by both the liquid limit and initial
water content. However, the empirical equation (4) and
(5) only consider the effec t of liquid limit, for eL = Gs*LL
when soil is saturated. That is to say, a modification
should be given on Equation (4) and (5) for considering
the effect of initial water content.
For simplicity, a liner multiple regression based on
tests data in this study is adopted by corresponding com-
puter software. Considering the value of
*
100
e
or
c
C
is increased with the LL from Burland and initial
water content or initial normalized water index
0
*
w
.
Based on the 42 tests data, the best fitted quantitative
equations are given as follows:
084.039.013.1 0100 −+=
LL wwwe
(6)
461.025.091.0
0
−+=
LLc
wwwC
(7)
Figure 2 shows the comparison between the measured
values of *
100
e and
c
C
from Figure 1 and the calcu-
lated values by Equation (6) and (7). It can be seen that
they are quite consistent, indicating that Equation (6) and
(7) can be used for well predicting the values of
*
100
e
and
c
C
.
For further verifying the validity of Equation (6) and
(7), several researchers who published oedometer test
data of some remolded or reconstituted clays were col-
lected as shown in Table 2.
The comparison results are shown in Figure 3. It is
0
0.5
1
1.5
2
0 0.5 1 1.5 2
Measured values of e
*100
Calculated values of e
*100
0
0.5
1
1.5
2
0 0.5 1 1.5 2
Measured values of C
*c
Calculated values of C
*c
(a) (b)
Figure 2. Comparison of the *
e
100
and
*
c
C
between calculated and measured values (a) for *
e
100
, (b) for
*
c
C
Table 2. Existing data of remolded or reconstituted soils.
Clays Sample GS LL (%) PL (%) w*0 Reference
Argile Plastique 1 2.58 128.0 31.0 1.00 [3]
London Clay 1 2.71 67.5 26.5 1.00 [3]
Wiener Tegel 1 2.76 46.2 22.0 1.00 [3]
Magnus Clay 1 2.73 35.0 17.2 1.00 [3]
Residual clay 1 2.74 58.0 27.0 1.00 [3]
Red soil 1 2.67 45.3 22.0 1.00 [6]
Black cotton clay 1 2.73 97.3 32.0 1.00 [6]
Red soil 1 2.65 50.0 27.0 1.00 [8]
Brown soil 1 2.65 62.0 31.0 1.00 [8]
Black Cotton Soil 1 2.80 84.0 47.0 1.00 [8]
Ashikari Town clay 6 2.62 80.3 30.9 1.00 - 1.22 [9]
Kawasoe Town clay 2 2.65 50.9 26.6 1.00 - 1.23 [9]
Ariake Town clay 14 2.60 104.8 33.9 1.01 - 1.42 [9]
Kaolinite 4 2.8.0 42.0 26.0 1.00 - 1.75 [10]
Bostion Blue Clay 4 2.68 45.0 23.0 1.00 - 1.75 [10]
J. YIN, Y. H. MIAO
Copyright © 2013 SciRes. OJCE
11
0
0.5
1
1.5
2
2.5
3
3.5
4
01 23 4
Measured values of e
*100
Calculated values of e
*100
0
0.5
1
1.5
2
00.5 1 1.5 2
Measured values of C
*c
Calculated values of C
*c
(a) (b)
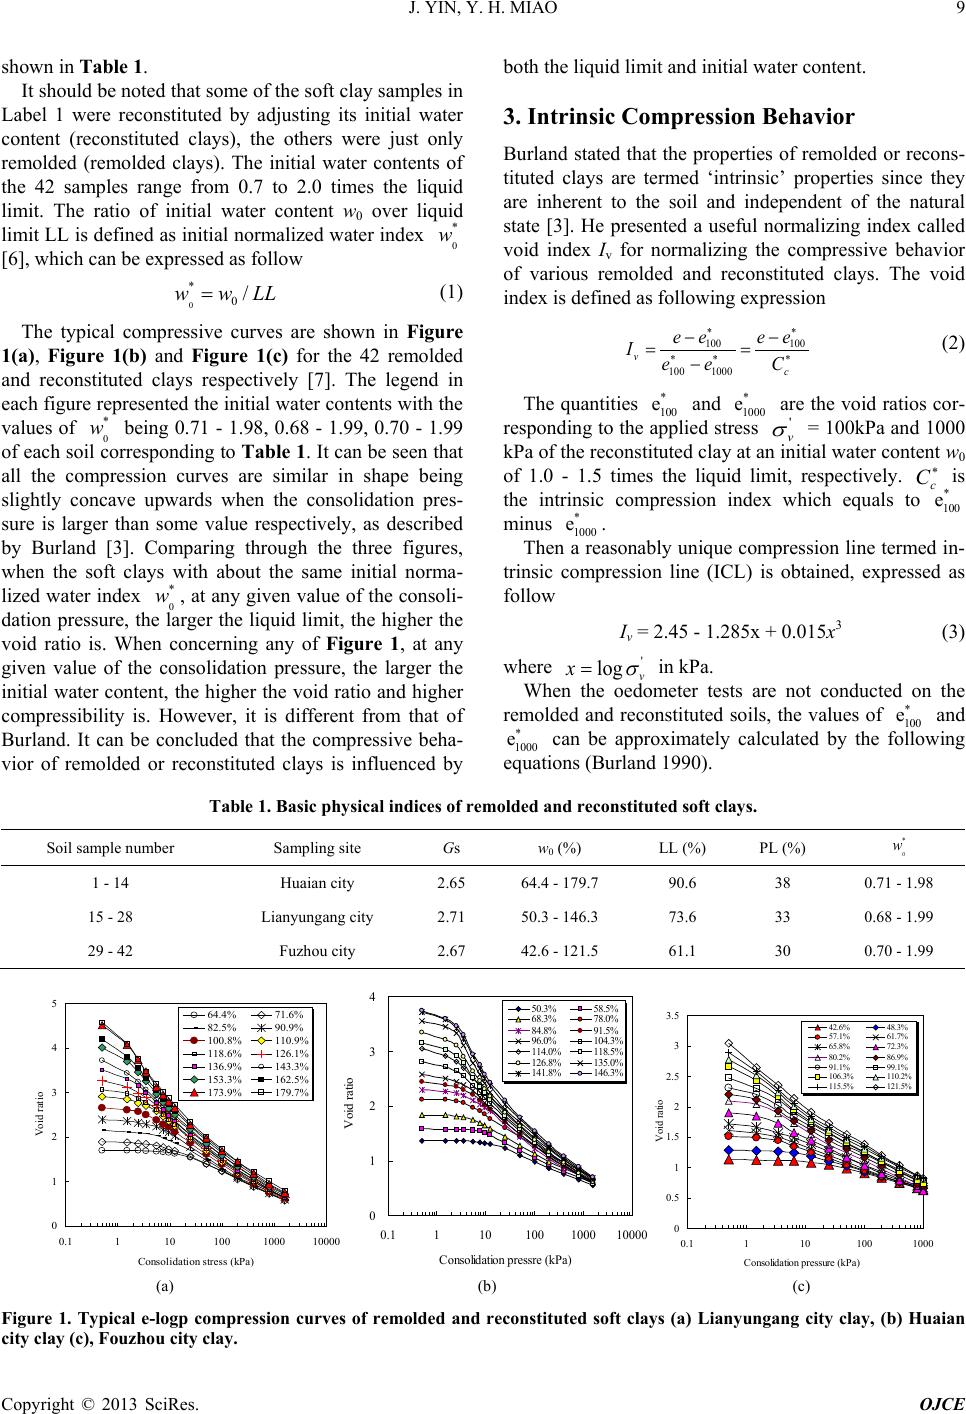
Figure 3. Comparison of the *
e
100
and
*
c
C
between calculated and measured values in literatures (a) for *
e
100
; (b) for
*
c
C
.
encouraged that most of the independent data have a
close relationship to Equation (6) and (7) although with
some data having a little scatter.
Based on the Equation (2), (3), (6) and (7), A norma-
lized compression line considering both the effects of
initial water content and liquid limit can be obtained in
the e-log p plot written as
( )
∗∗
+⋅
⋅+
⋅=
100
3
vv
)(log0.015log1.285-2.45(eCe
c
σσ
(8)
The values of *
100
e and
c
C
can be predicted by Eq-
uation (6) and (7) respectively. Equation (8) can be used
to evaluate the effects of soil structure quantitatively on
the intact compressive behavior for natural sedimentary
clays by enabling the initial water content being equal to
the natural water content.
4. Conclusions
The main conclusions obtained in this study are summa-
rized as follows:
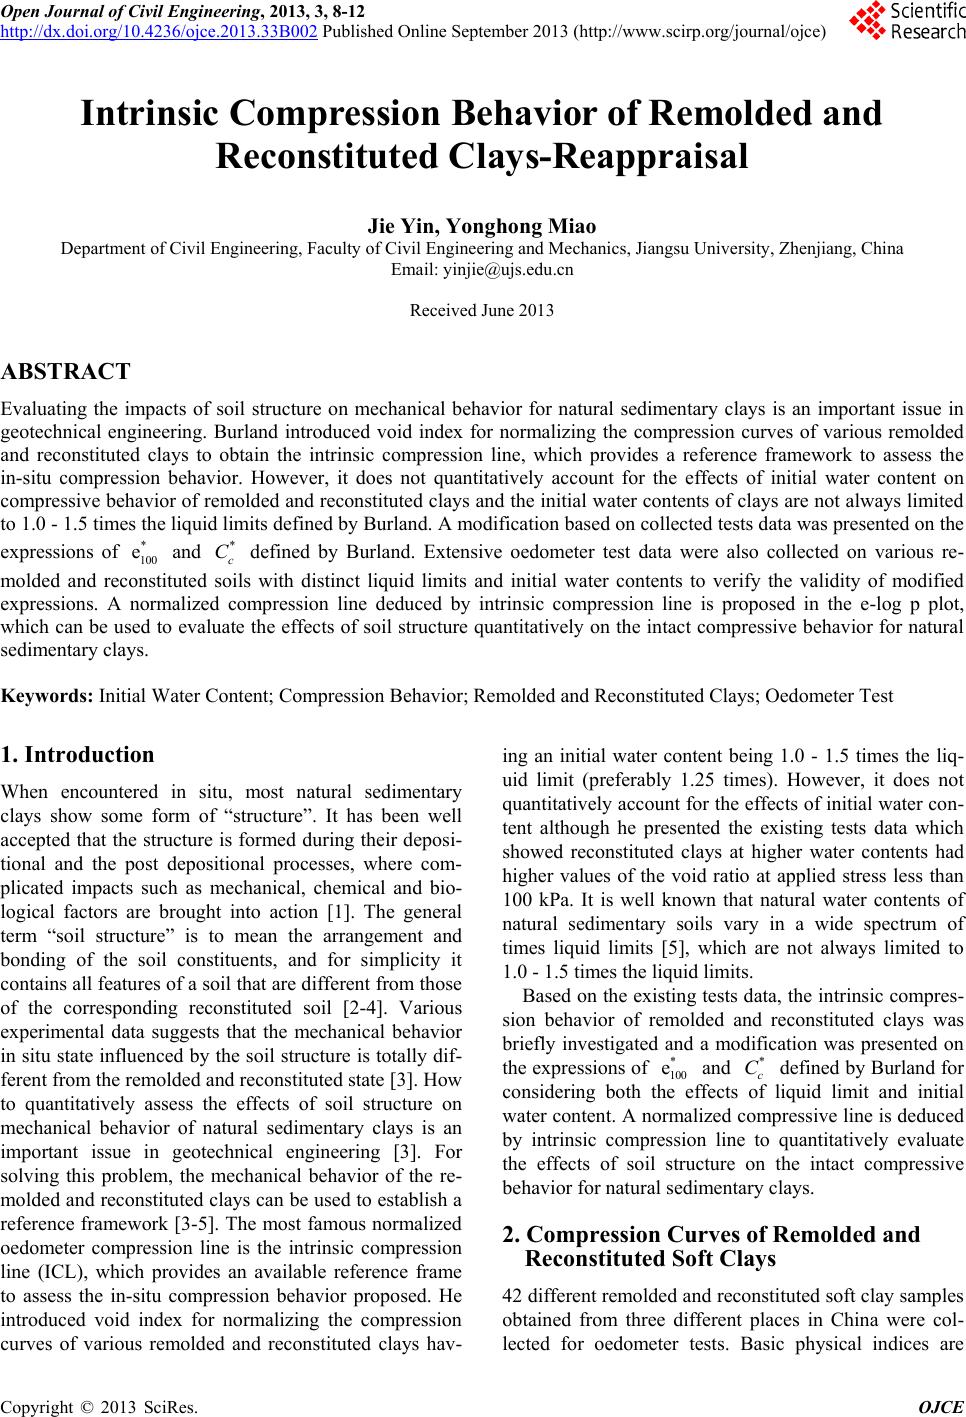
(1) Oedometer tests results for three clays with differ-
ent initial water contents suggest that the compression
behavior of remolded or reconstituted clays is influenced
by both the liquid limit and initial water content.
(2) By correlating with the empirical equations pro-
posed by Burland and oedometer test data in this study, a
simple form of expressions of
*
100
e
and
c
C
are ob-
tained by the multiple liner regression, which are
084.039.013.1
0100
−+=
LL
wwwe
and
461.025.091.0
0
−+=
LLc
wwwC
, respectively.
5. Acknowledgements
This research is sponsored by natural science foundation
of Jiangsu province in China (Grant No. BK2011476),
which is gratefully acknowledged.
REFERENCES
[1] R. J. Chandler, “Clay Sediments in Depositional Basin:
The Geotechnical Cycle,” The Quarterly Journal of En-
gineering Geology and Hydrology, Vol. 33, No. 1, 2000,
pp. 7-39. http://dx.doi.org/10.1144/qjegh.33.1.7
[2] S. Leroueil and P. R. Vaughan, “The General and Con-
gruent Effects of Structure in Natural Soils and Weak
Rocks,Géotechnique, Vol. 40, 1990, pp. 467-488.
http://dx.doi.org/10.1680/geot.1990.40.3.467
[3] J. B. Burland, “On the Compressibility and Shear Strength
of Natural Clays,Gé otechnique, Vol. 40, No. 3, 1990,
pp. 329-378.
http://dx.doi.org/10.1680/geot.1990.40.3.329
[4] M. D. Liu, J. P. Carter and C. S. Desai, “Modeling Com-
Pression Behavior of Structured Geomaterials,” Interna-
tional Journal of Geomechanics, ASCE, Vol. 3, No. 2,
2003, pp. 191-204.
[5] S. Buchan and D. T. Smith, “Deep-Sea Sediment Com-
pression Curves: Some Controlling Factors, Spurious
Overconsolidation, Predictions, and Geophysical Repro-
duction,” Marine Georesources and Geotechnology, Vol.
17, No. 1, 1999, pp. 65-81.
http://dx.doi.org/10.1080/106411999274016
[6] T. S. Nagaraj and B. R. Srinivasa Murthy, “A Critical
Reappraisal of Compression Index Equation,Géotech-
nique, Vol. 36, 1986, pp. 27-32.
http://dx.doi.org/10.1680/geot.1986.36.1.27
[7] Z. Hong, J. Yin and Y. Cui. “Compression Behaviour of
Reconstituted Soils at High Initial Water Contents,Géo-
technique, Vol. 60, No. 9, 2010, pp. 691-700.
http://dx.doi.org/10.1680/geot.09.P.059
[8] T. S. Nagaraj and B. R. Srinivasa Murthy, “Rationaliza-
tion of Skempton’s Compressibility Equation,Géotech-
nique, Vol. 33, No. 4, 1983, pp. 433-443.
http://dx.doi.org/10.1680/geot.1983.33.4.433
[9] Z. Hong, “Void Ratio-Suction Behavior of Remolded
Ariake Clays,” Geotechnical Testing Journal, Vol. 30, No.
3, 2007, pp. 234-239.
J. YIN, Y. H. MIAO
Copyright © 2013 SciRes. OJCE
12
[10] A. B. Cerato and A. J. Lutenegger, “Determining Intrinsic
Compressibility of Fine-Grained Soils,” ASCE Journal of Geotechnical and Geoenvironmental Engineering, Vol.
130, No. 8, 2004, pp. 872-877.