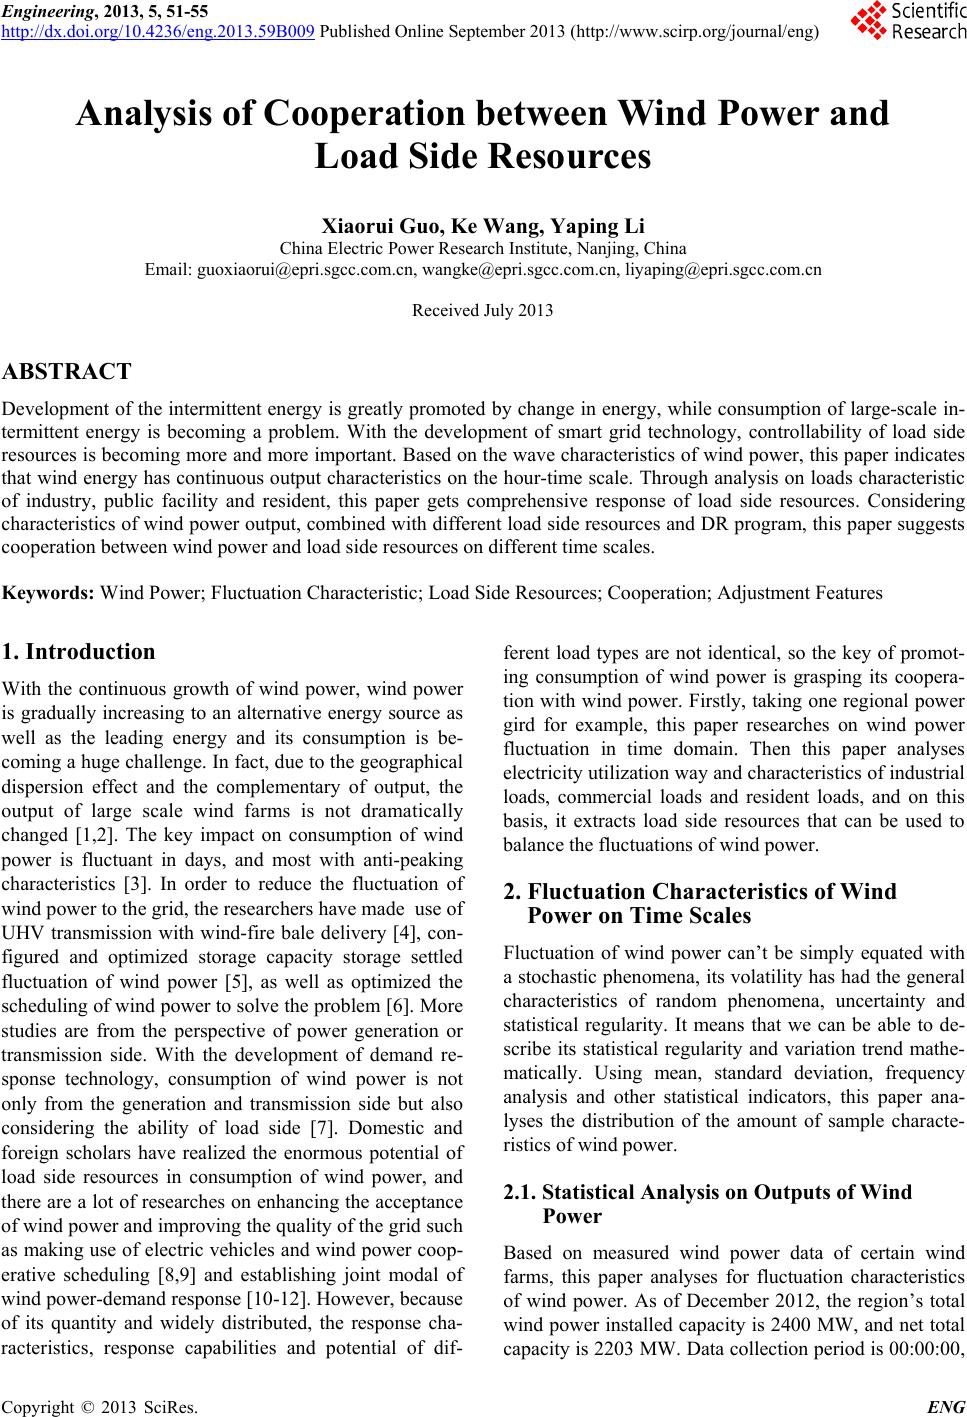
 Engineering, 2013, 5, 51-55 http://dx.doi.org/10.4236/eng.2013.59B009 Published Online September 2013 (http://www.scirp.org/journal/eng) Copyright © 2013 SciRes. ENG Analysis of Cooperation between Wind Power and Load Side Resources Xiaorui Guo, Ke Wang, Yaping Li China Electric Power Research Institute, Nanjing, China Email: guoxi a orui@epri.sgcc.com.cn, wangke@epri.sgcc.com.cn, liyaping@epri.sgcc.com.cn Received July 2013 ABSTRACT Development of the intermittent energy is greatly promoted by change in energy, while consumption of large -scale in- termittent energy is becoming a problem. With the development of smart grid technology, controllability of load side resources is becoming more and more important. Based on the wave characteristics of wind power, this paper indicates that wind energy has continuous output characteristics on the hour-time scale. Through ana lysis on loads characteristic of indu stry, public facility and resident, this paper gets comprehensive response of load side resources. Considering characteristics of wind power output, combined with different load side resources and DR program, this paper suggests cooperation between wind power and load side resources on different time scales. Keywords: Wind Power; Fluctuation Characteristic; Load Side Resources; Cooperation ; Adjustment Featu res 1. Introduction With the continuous growth of wind power, wind power is gradually increasing to an alternative energy source as well as the leading energy and its consumption is be- coming a huge challenge. In fact, due to the geographical dispersion effect and the complementary of output, the output of large scale wind farms is not dramatically changed [1,2]. The key impact on consumption of wind power is fluctuant in days, and most with anti-peaking characteristics [3]. In order to reduce the fluctuation of wind power to the grid, the researchers have made use of UHV transmission with wind-fire bale delivery [4], con- figured and optimized storage capacity storage settled fluctuation of wind power [5], as well as optimized the scheduling of wind power to solve the problem [6]. More studies are from the perspective of power generation or transmission side. With the development of demand re- sponse technology, consumption of wind power is not only from the generation and transmission side but also considering the ability of load side [7]. Domestic and foreign scholars have realized the enormous potential of load side resources in consumption of wind power, and there are a lot of r esearche s on enhancing the acceptance of wind power and improving the quality of the grid such as making use of electric vehicles and wind power coop- erative scheduling [8,9] and establishing joint modal of wind power-demand response [10-12]. However, because of its quantity and widely distributed, the response cha- racteristics, response capabilities and potential of dif- ferent load types are not identical, so the key of promot- ing consumption of wind power is grasping its coopera- tion with wind po wer. Firstly, taking one regional power gird for example, this paper researches on wind power fluctuation in time domain. Then this paper analyses electricity utilization way and characteristics of industrial loads, commercial loads and resident loads, and on this basis, it extracts load side resources that can be used to balance the fluctuations of wind power. 2. Fluctuation Characteristics of Wind Power on Time Scales Fluctuation of wind power can’t be simply equated with a stochastic phenomena, its volatility has had the general characteristics of random phenomena, uncertainty and statistical regularity. It means that we can be able to de- scribe its statistical regularity and variation trend mathe- matically. Using mean, standard deviation, frequency analysis and other statistical indicators, this paper ana- lyses the distribution of the amount of sample characte- ristics of wind power. 2.1. Statistical Analysis on Outputs of Wind Power Based on measured wind power data of certain wind farms, this paper analyses for fluctuation characteristics of wind power. As of December 2012, the region’s total wind power installed capacity is 2400 MW, and net total capacity is 2203 MW. Data collection period is 00:00:00, 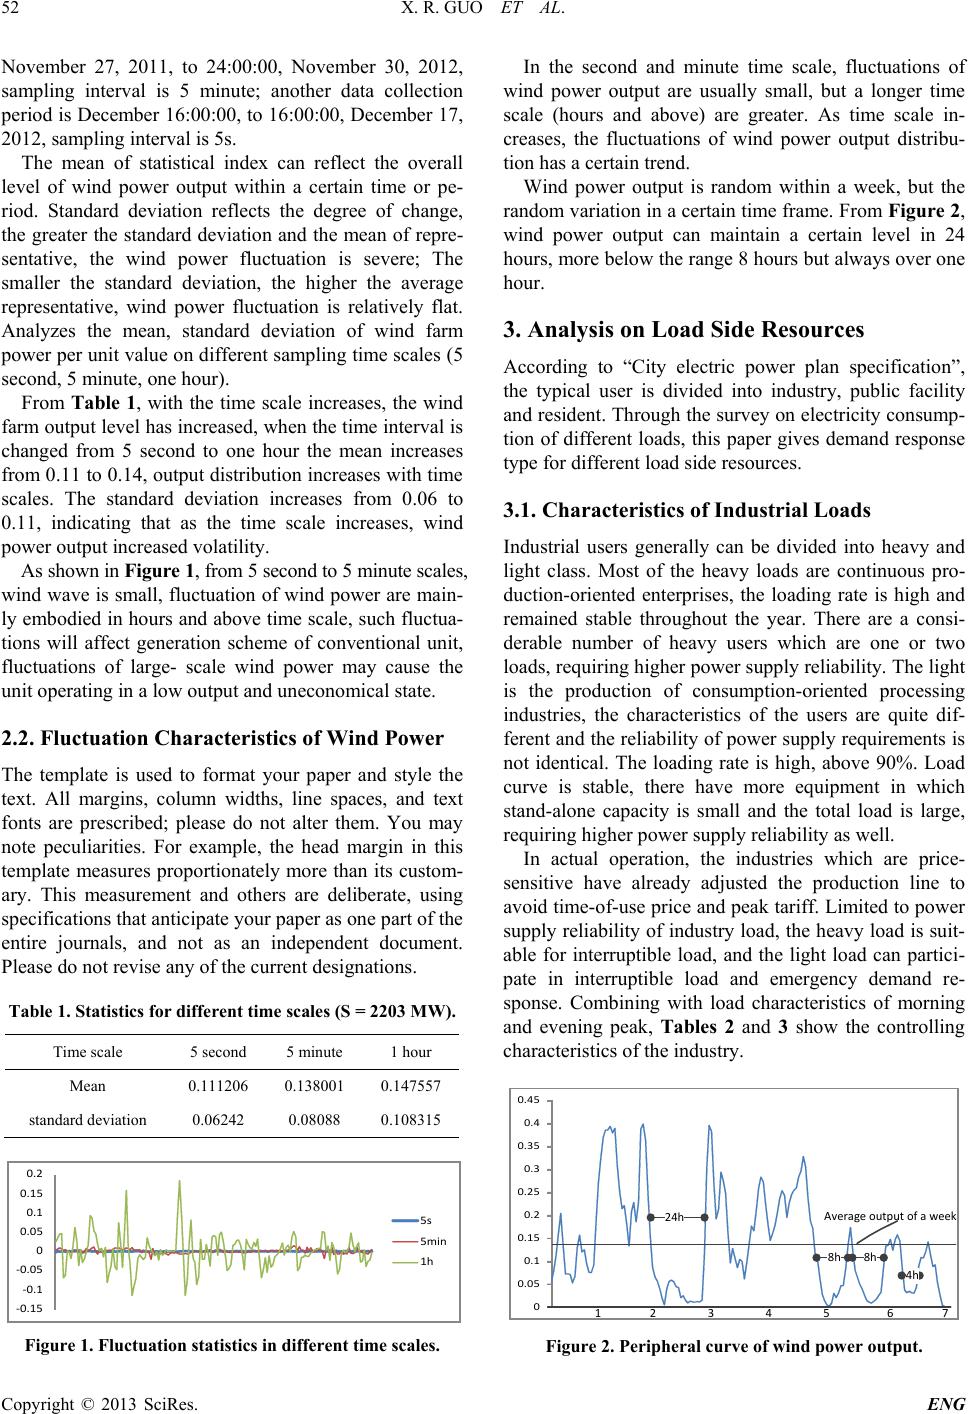 X. R. GUO ET AL. Copyright © 2013 SciRes. ENG November 27, 2011, to 24:00:00, November 30, 2012, sampling interval is 5 minute; another data collection period is December 16:00:00, to 16:00 :00, December 17, 2012, sampling interval is 5s. The mean of statistical index can reflect the overall level of wind power output within a certain time or pe- riod. Standard deviation reflects the degree of change, the greater the standard deviation and the me an of repre- sentative, the wind power fluctuation is severe; The smaller the standard deviation, the higher the average representative, wind power fluctuation is relatively flat. Analyzes the mean, standard deviation of wind farm power per unit value on dif ferent sampling time scales (5 second, 5 minute , one hour). From Table 1, with the time scale increases, the wind farm output level has increased, when the time interv al is changed from 5 second to one hour the mean increases from 0.11 to 0.14, output distribution increases with time scales. The standard deviation increases from 0.06 to 0.11, indicating that as the time scale increases, wind power output increa sed volat i lity. As shown in Figure 1, from 5 second to 5 minute scales, wind wave is small, fluctuation of wind power are main- ly embodied in hours and above time scale, such fluctua- tions will affect generation scheme of conventional unit, fluctuations of large- scale wind power may cause the unit operating in a low output and uneconomical state. 2.2. Fluctuation Characteristics of Wind Power The template is used to format your paper and style the text. All margins, column widths, line spaces, and text fonts are prescribed; please do not alter them. You may note peculiarities. For example, the head margin in this template measures proportionately more than its custom- ary. This measurement and others are deliberate, using specifications that an ticip a te yo ur paper as one part of the entire journals, and not as an independent document. Please do not revis e an y of the current design a tions. Table 1. Statistics for different time scales (S = 2203 MW). Time scale 5 second 5 minute 1 hour Mean 0.111206 0.138001 0.147557 standard deviation 0.06242 0.08088 0.108315 Figure 1. Fluctuation statistics in different time scales. In the second and minute time scale, fluctuations of wind power output are usually small, but a longer time scale (hours and above) are greater. As time scale in- creases, the fluctuations of wind power output distribu- tion has a certain trend. Wind power output is random within a week, but the random variation in a certain time frame. From Figure 2, wind power output can maintain a certain level in 24 hours, more below the range 8 hours but always over one hour. 3. Analysis on Load Side Resources According to “City electric power plan specification”, the typical user is divided into industry, public facility and resident. Through the survey on electricity consump- tion of different loads, this paper gives demand response type for different load side resources. 3.1. Characteristics of Industrial Loads Industrial users generally can be divided into heavy and light class. Most of the heavy loads are continuous pro- duction-oriented enterprises, the loading rate is high and remained stable throughout the year. There are a consi- derable number of heavy users which are one or two loads, requiring higher power supply reliability. The light is the production of consumption-oriented processing industries, the characteristics of the users are quite dif- ferent and the reliability of po wer supply requirements is not identical. The loading rate is high, above 90%. Load curve is stable, there have more equipment in which stand-alone capacity is small and the total load is large, requiring higher power supply reliability as well. In actual operation, the industries which are price- sensitive have already adjusted the production line to avoid time-of-use price and peak tariff. Limited to power supply reliability of industry load, the heavy load is suit- able for interruptible load, and the light load can partici- pate in interruptible load and emergency demand re- sponse. Combining with load characteristics of morning and evening peak, Tables 2 and 3 show the controlling characteristics of the industr y. 0 0.05 0.1 0.15 0.2 0.25 0.3 0.35 0.4 0.45 1 2 3 4 5 6 7 Average output of a week 24h 8h 8h 4h Figure 2. Peripheral curve of wind power output. -0.15 -0.1 -0.05 0 0.05 0.1 0.15 0.2 5s 5min 1h  X. R. GUO ET AL. Copyright © 2013 SciRes. ENG Table 2. Adjustment features of heavy industries. Industry Proportion of interruptible load Remark Heavy industry Steel- Rolling production line (0.75 - 0.85)*0.8 8 hours interr upt suitable for early peak, 4 hours interrupt suitable for evening peak Nonferrous Metals Processing 0.35 - 0.5 Low production continuity, 4 hours interrupt Building Materials(cement) (0.75 - 0.85)*0.8 Notice for a long time, 8 hours interrupt Table 3. Adjustment features of light industries. Industry Proportion of interruptible load Proportion of emergency demand response Light industry Spinning Cotton production: 0.54 / Manufacturing on appliances, electronics, daily necessities 025 - 0.4 025 - 0.4 Pharmaceutical industry Chinese medicine: 0.5 0.5 Table 4. Adjustment features of public utilities. Type Proportion of HVAC Proportion of lighting load 20 minutes 2 hours Day-time Night-time Day-time Night-time Day-time Night-time Office 0.24 0.01 0.18 0.01 0.033 0.005 Catering 0.008 0.001 0.006 0.001 0 0 Retail 0.101 0.01 0.101 0.01 0.083 0.01 Refrigeration 0.064 0.004 0.048 0.004 0.01 0.001 School 0.32 0.01 0.24 0.01 0.043 0.006 3.2. Characteristics of Public Facilities Loads Users of public facilities are divided into administrative offices, cultural and entertainment, sports, education and scientific research, health classes, and commercial, fi- nancial, services, etc. This class of load is mainly using heating, ventilation, air-conditioning and cooling (HVAC) and lighting load, can be divided into HVAC and lighting reduced capacity. The users who have energy manage- ment and control system (EMCS) or system control and data acquisition (SCADA) can participate in the regula- tion of HVAC and lighting. According to electricity consumption, the regulation time period is divided into daytime (6:00 -22:00) and night time (22:00-6:00 the next day). According responsiveness HVAC has two ways: one has response speed of 15 minute and sustained re- ductions time of 2 hours; the other has response speed of 5second to 5 minute and sustained reductions time of 20 minutes. The lighting load has the same responsiveness whether 2 hours or 20 minutes. According to the survey data of literature [13], consi- dering the popularizing rate of EMCS/SCADA system, this paper gives the control characteristics of the public utilities in Table 4. Public facilities can be suitable for fast and flexible load regulation, and can be used as a flexible scheduling resource to participate in the distr ibution of the load. 3.3. Characteristics of Residential Loads Intelligent use of electricity can provide information and have features to facilitate the residents of household electricity and it will be a trend for electricity consump- tion of resident. Having small electricity consumption for individual and large for whole, residents are important participator in demand response under the smart grid. Project of demand response in which resident participate is in residential area. Regulation of resident is mainly the energy storage capacity load (refrigerators , air conditio n- ers, heaters and water heaters, etc.) and transfer load (washing machine, dishwasher). Considering participa- tion degree of users and electrical usage in different time periods, this paper gives the control characteristics of the resident in Table 5. 3.4. Characteristics of Comprehen sive Response Different electricity Characteristics of industr ies, public facilities and residents determine the difference between 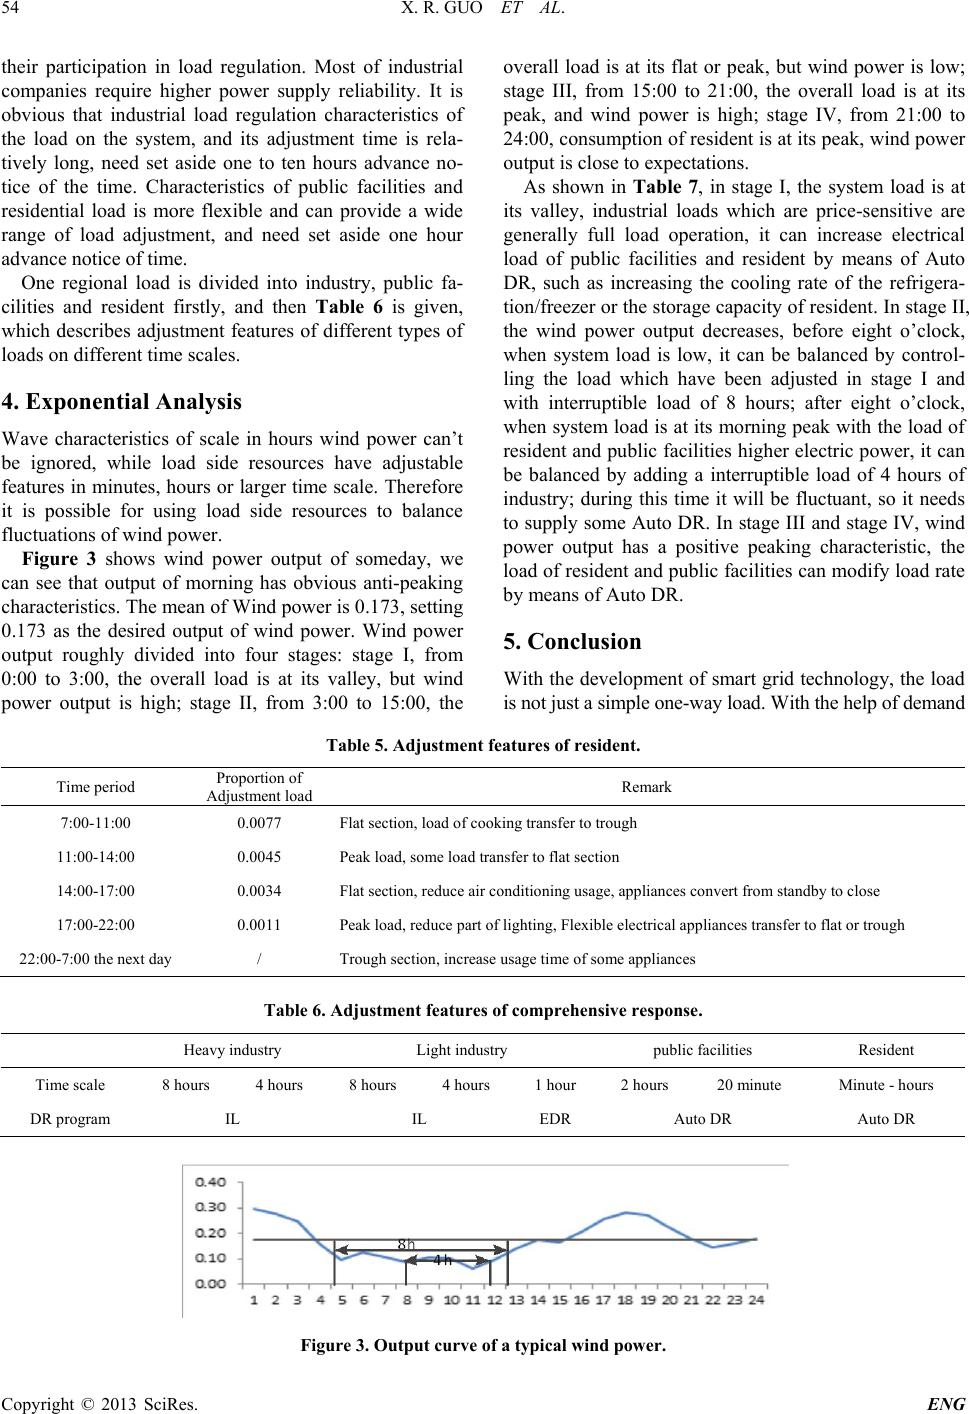 X. R. GUO ET AL. Copyright © 2013 SciRes. ENG their participation in load regulation. Most of industrial companies require higher power supply reliability. It is obvious that industrial load regulation characteristics of the load on the system, and its adjustment time is rela- tively long, need set aside one to ten hours advance no- tice of the time. Characteristics of public facilities and residential load is more flexible and can provide a wide range of load adjustment, and need set aside one hour advance notice of time. One regional load is divided into industry, public fa- cilities and resident firstly, and then Table 6 is given, which describes adjustment features of different types of loads on different time scales. 4. Exponential Analysis Wave characteristics of scale in hours wind power can’t be ignored, while load side resources have adjustable features in minutes, ho urs or larger time scale. Therefore it is possible for using load side resources to balance fluctuations of wind power. Figure 3 shows wind power output of someday, we can see that output of morning has obvious anti-peaking characteristics. The mean of Wind power is 0.173, setting 0.173 as the desired output of wind power. Wind power output roughly divided into four stages: stage I, from 0:00 to 3:00, the overall load is at its valley, but wind power output is high; stage II, from 3:00 to 15:00, the overall load is at its flat or peak, but wind power is low; stage III, from 15:00 to 21:00, the overall load is at its peak, and wind power is high; stage IV, from 21:00 to 24:00, consumption of resident is at its peak, wind powe r output is close to expectations. As shown in Tab le 7, in stage I, the system load is at its valley, industrial loads which are price-sensitive are generally full load operation, it can increase electrical load of public facilities and resident by means of Auto DR, such as increasing the cooling rate of the refrigera- tion/freezer or the storage capacity of resident. In stage II, the wind power output decreases, before eight o’clock, when system load is low, it can be balanced by control- ling the load which have been adjusted in stage I and with interruptible load of 8 hours; after eight o’clock, when system load is at its morning peak with the load of resident and public facilities higher electric power, it can be balanced by adding a interruptible load of 4 hours of industry; during this time it will be fluctuant, so it needs to supply some Auto DR. In stage III and stage IV, wind power output has a positive peaking characteristic, the load of resident and public facilities can mod ify load rate by means of Auto DR. 5. Conclusion With the development of smart grid technology, the load is not just a simple one-way load. With the he l p of demand Table 5. Adjustment features of resident. Time period Proportion of Adjustment load Remark 7:00-11:00 0.0077 Flat section, load of cooking transfer to trough 11:00-14:00 0.0045 Peak load, some load transfer to flat section 14:00-17:00 0.0034 Flat section, reduce air conditioning usage, appliances convert from standby to close 17:00-22:00 0.0011 Peak load, reduce part of lighting, Flexible electrical appliances transfer to flat or trough 22:00-7:00 the next day / Trough section, increase usage time of some appliances Table 6. Adjustment features of comprehensive response. Heavy industry Light industry public facilities Resident Time scale 8 hours 4 hours 8 hours 4 hours 1 hour 2 hours 20 minute Minute - hours DR program IL IL EDR Auto DR Auto DR Figure 3. Out put curve of a typical wind power. 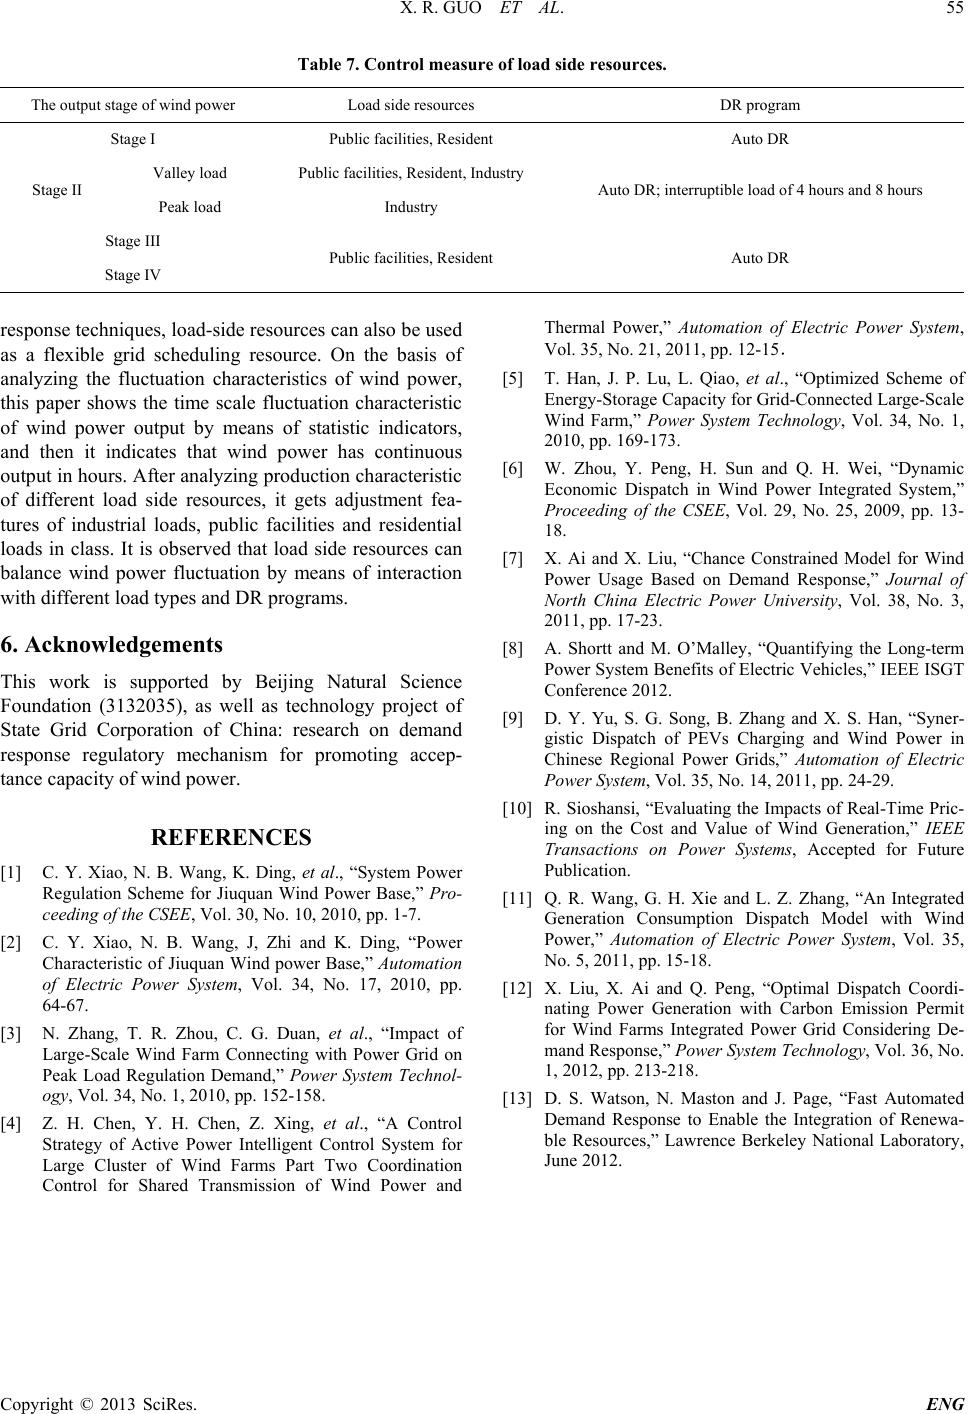 X. R. GUO ET AL. Copyright © 2013 SciRes. ENG Table 7. Control measure of load side resources. The output stage of wind power Load side resources DR program Stage I Public facilities, Resident Auto DR Stage II Valley load Public facilities, Resident, Industry Auto DR; interruptible load of 4 hours and 8 hours Peak load Industry Stage III Public facilities, Resident Auto DR Stage IV response techniques, load-side resources can also be used as a flexible grid scheduling resource. On the basis of analyzing the fluctuation characteristics of wind power, this paper shows the time scale fluctuation characteristic of wind power output by means of statistic indicators, and then it indicates that wind power has continuous output in hours. After analyzing production characteristic of different load side resources, it gets adjustment fea- tures of industrial loads, public facilities and residential loads in class. It is observed that load side resources can balance wind power fluctuation by means of interaction with different load types and DR programs. 6. Acknowledgements This work is supported by Beijing Natural Science Foundation (3132035), as well as technology project of State Gr id Corporation of China: research on demand response regulatory mechanism for promoting accep- tance capacity of wind power. REFERENCES [1] C. Y. Xiao, N. B. Wa ng, K. Ding, et al., “System Power Regulation Scheme for Jiuquan Wind Power Base,” Pro- ceeding of the CSEE, Vol. 30, No. 10, 2010, pp. 1-7. [2] C. Y. Xiao, N. B. Wang, J, Zhi and K. Ding, “Power Characteristic of Jiuquan Wind power Base,” Automation of Electric Power System, Vol. 34, No. 17, 2010, pp. 64-67. [3] N. Zhang, T. R. Zhou, C. G. Duan, et al., “Impact of Large-Scale Wind Farm Connecting with Power Grid on Peak Load Regulation Demand,” Power System Technol- ogy, Vol. 34, No. 1, 2010, pp. 152-158. [4] Z. H. Chen, Y. H. Chen, Z. Xing, et al., “A Control Strategy of Active Power Intelligent Control System for Large Cluster of Wind Farms Part Two Coordination Control for Shared Transmission of Wind Power and Thermal Power,” Automation of Electric Power System, Vol. 35, No. 21, 2011, pp. 12-15. [5] T. Han, J. P. Lu, L. Qiao, et al., “Optimized Scheme of Energy-Storage Capacity for Grid-Connected Large-Scale Wind Farm,” Power System Technology, Vol. 34, No. 1, 2010, pp. 169-173. [6] W. Zhou, Y. Peng, H. Sun and Q. H. Wei, “Dynamic Economic Dispatch in Wind Power Integrated System,” Proceeding of the CSEE, Vol. 29, No. 25, 2009, pp. 13- 18. [7] X. Ai and X. Liu, “Chance Constrained Model for Wind Power Usage Based on Demand Response,” Journal of North China Electric Power University, Vol. 38, No. 3, 2011, pp. 17-23. [8] A. Shortt and M. O’Malley, “Quantifying the Long-term Power System Benefits of Electric Vehicles,” IEEE ISGT Conference 2012. [9] D. Y. Yu, S. G. Song, B. Zhang and X. S. Han, “Sy ner- gistic Dispatch of PEVs Charging and Wind Power in Chinese Regional Power Grids,” Automation of Electric Power System, Vol. 35, No. 14, 2011, pp. 24-29. [10] R. Sioshansi, “Evaluating the Impacts of Real-Time Pric- ing on the Cost and Value of Wind Generation,” IEEE Transactions on Power Systems, Accepted for Future Publication. [11] Q. R. Wang, G. H. Xie and L. Z. Zhang, “An Integrated Generation Consumption Dispatch Model with Wind Power,” Automation of Electric Power System, Vol. 35, No. 5, 2011, pp. 15-18. [12] X. Liu, X. Ai and Q. Peng, “Optimal Dispatch Coordi- nating Power Generation with Carbon Emission Permit for Wind Farms Integrated Power Grid Considering De- mand Response,” Power System Technology, Vol. 36, No. 1, 2012, pp. 213-218. [13] D. S. Watson, N. Maston and J. Page, “Fast Automated Demand Response to Enable the Integration of Renewa- ble Resources,” Lawrence Berkeley National Laboratory, June 2012.
|