Communications and Network, 2013, 5, 596-600
http://dx.doi.org/10.4236/cn.2013.53B2107 Published Online September 2013 (http://www.scirp.org/journal/cn)
Copyright © 2013 SciRes. CN
Speaker Recognition System Based on the Baseband
Correlation Score Reliability Fusion
Qi He1, Ting Huang2, Hongbo Zhang3*
1Science and Technology Department of Ningxia, Yinchuan, China
2MicroStrategy Software (Hangzhou) Co., Ltd., Hangzhou, China
3School of Physics & Electrical Information Engineering, Ningxia University, Yinchuan, China
Email: *904291161@qq.com
Received May 2013
ABSTRACT
Emotion mismatch between training and testing will cause system performance decline sharply which is emotional
speaker recognition. It is an important idea to solve this problem according to the emotion normalization of test speech.
This method proceeds from analysis of the differences between every kind of emotional speech and neutral speech. Be-
sides, it takes the baseband mismatch of emotional changes as the main line. At the same time, it gives the correspon d-
ing algorithm according to four technical points which are emotional expansion, emotional shield, emotional normaliz a-
tion and score compensation. Compared with the traditional GMM-UBM method, the recognition rate in MASC corpus
and EPST corpus wa s inc reased by 3.80% and 8.81% respectively.
Keywords: Emotional Speaker Recognition ; Pitch Normalization Method; Model Mismatch Detection; Emotional
Normalization
1. Introduction
Because of the inconsistent training and testing condi-
tions, the model of the training set cannot effectively
describe the characteristic distribution of the test voice,
referred to herein as the model mismatch. The core of
speaker recognition technology is the pre-entry of the
speakers voice samples to which is extracted as the
unique speaker voice feature and stored in the database,
according to match the testing speech with the characte-
ristics in database, then determine the identity of the
speaker. There are many factors that affect the perfor-
mance of the speaker recognition system in a real envi-
ronment; their sources can be divided into external fac-
tors and internal factors. External factors mainly come
from the ambient noise, channel change and the differ-
ence of coding sche me. In tern al fac tor s chan ge, also known
as intra-Speaker variation, refers to the speakers own
physiological characteristics or personality and behavior
characteristics change, can be divided into the two cate-
gories of lon g-term and short term. The long-term change
[1] generally refers to the vocal organs slow changes due
to the increasing age of the speaker. The short-term dis-
ease generally refers to the temporary illness such as cold,
cough, inflammation of the tonsils, inflammation of the
gums which could cause the change of vocal organs.
Emotional change is another common factor to cause
performance degradation of speaker recognition system.
Different emotional statuses cause the different effect of
speakers utterance mechanism. This will lead to the
change of the personality traits of the speakers voice,
and then lead to the mismatch between training and test-
ing feature space distribution.
We propose a score reliability fusion based on the ba-
seband correlation to avoid identifying the user’s specific
emotional type. This method using the correlation of ba-
seband mean deviation and the recognition rate existence
between high difference emotional speech and neutral
voice, by reducing the weight of high-baseband mean
deviation part in high difference emotional speech, to
reduce the score of impersonate model and improve the
score of the real speaker model. Thus, the performance
for speaker recognition is improved.
2. The Application and Mismatch Effects of
the Baseband in Speaker Recognition
The voice is the result of the combined effect of the
sound source and channel, sound source excitation signal,
by modulation of channel and radiation effects of nose
and mouth, form the final speech. The speech contain
two parts (the sound source and channel) [2] of informa-
tion. In phonetics, we usually use cepstral coefficients
*
Corresponding author.
Q. HE ET AL.
Copyright © 2013 SciRes. CN
597
(such as MFCC, LPCC [3]) to describe the speech signal
channel response. And use pitch frequency to describe
the excitation of the speech signal sound source. Using
global statistics of baseband can enhance the perfor-
mance of speaker recognition. But because of the lack of
description of the baseband partial information, the ex-
isting methods are generally by speech segmentation,
then extract statistical features to make up for the short-
fall in the baseband fragment.
As the speech baseband characteristics contains the
speakers personality traits, and characteristics of no ef-
fect by the channel and noise. So it has been used to im-
prove system robustness of channel mismatch and envi-
ronmental noise in speaker recognition. However, in the
actual environment, the baseband is often affected by the
change of text content of the speakers voice, manner of
speaking and emotional state. Thus, in these circums-
tances, using the difference of speaker baseband feature
to distinguish the speaker performance will be greatly
reduced. The mismatch of baseband distribution between
training and testing by the same speaker is baseband
mismatch [4]. It would lead a negative impact to speaker
recognition. Emotion al change is one of the main factors
leading to baseband mismatch. The shape of speech ba-
seband envelope curve is dependent on the speaker’s
speech emotional state [5].
It is different from external factors such as ambient
noise, channel mismatch. The most obvious performance
of emotional changes in speech is the change of the pro-
sodic features such as baseband. So it is not feasible to
take baseband relevant information as the characteristics
of emotional speaker recognition. On the basis of in-
depth study of prosodic features such as baseband in the
emotional changes and Interference phenomena between
baseband characteristics and channel characteristics
(MFCC), in this article, we proposed several emotions
compensation algorithm to reduce the effect of speakers
emotional state mismatch between tra ining and testing to
the speaker recognition system.
3. Pitch Normalization Method (PNM)
As it was found there was severe deviation in pitch mean
between HMS and corresponding neutral speech, the idea
of PNM was to normalize pitch of HMS more approx-
imately to the neutral speech. Following the thought,
firstly, varied proportion of pitch mean between HMS
and corresponding neutral speech was need to obtain.
The proportion
F
was defined as follow:
/F HL=
(1)
In Equation (1),
H
and
L
were pitch mean of the
HMS and of the responding neutral speech respectively.
Because speaker was unknown in testing,
L
was un-
known. It was assumed that the function mapping rela-
tion
g
f
mapped
H
to
L
, i.e.:
)(HfL g
=
(2)
The subscript g presented gender, because
g
f
was
related with speak ers gender. Equation (1) turned to Equ-
ation (3):
// ()
gg
FHL HfH= =
(3)
And then pitch of HMS was normalized by the fol-
lowing equation:
(4)
t
H
was the pitch of a period of emotional speech,
while
t
L
was the normalized pitch that approximated
the speakers corresponding neutral speech.
Obviously, the form of
g
f
was unknown and hard to
solve analytically. Polynomial was a smooth and conti-
nuous function, and its differential form was also a po-
lynomial. So it was a good choice for polynomial to fit
g
f
. Polynomial form was as follow:
0
() g
ki
g ig
i
f xax
=
=
(5)
Polynomial order
g
k
was able to obtain by Akaike
information criterion (AIC) [1]. One of AIC forms was
adopted here as follow:
(6)
In Equation (6),
n
was sample count, and RSS was
residual sum of squares (RSS). When AIC got its mini-
mum value, corresponding
g
k
got its most proper order
for the polynomial. Then the method of least squares (LS)
was able to solve polynomial coefficients
ig
a
, i.e.,
g
f
was fit by polynomial.
4. Score Reliability Fusion Based on the
Baseband
In this paper, we propose a score reliability fusion based
on the baseband, getting the voice contribution to correct
identification voice by way of evaluating high-mismatch
parts of speech, and taking the contribution as the frame
score weighting weights of high-mismatch parts of speech
in test. Finally, we achieve an effective use of speech
high-mismatch parts.
4.1. Score Reliability Fusion Based on the
Baseband Correlation
In speaker recognition, every frame in test voice makes a
contribution to correctly identify. When the frame plays a
positive role for the correct identification, contribution is
positive, otherwise it is negative. When test voice is in-
correctly identified, contribution of a part of frame score
must be negative. Different frame score contribution in
the speech frame level using different weights. It is ob-
Q. HE ET AL.
Copyright © 2013 SciRes. CN
598
vious to improve the score of the real speaker and reduce
the score of impersonation. Thus, the performance for
speaker recognition is improved.
According to the study of the relationship between the
baseband mean deviation and the degree of mismatch, for
HD emotional speech. The greater the baseband mean
deviation, the lower speaker recognition rate is. That is,
the more unreli able the s cor e calcu lated is, an d the smaller
the contribution for a system to correctly identify is. So,
we propose a score reliability fusion based on the base-
band deviation correlation of difference determine, spe-
cific processes shown in Figure 1. The method to obtain
the weight ing coefficie nts can be di vided int o four steps:
1) Build reliability fusion coefficients related to base-
band for male and female speaker respectively;
2) Use gender recognition to distinguish Gender in-
formation of test speech;
3) Detect the High Mismatch Segment (HMS) of test-
ing speec h according to the method in Chapter 5;
4) Calculate the score weighting coefficients of each
of the test speech frame, according to the high mismatch
identification and reliability weighting coeff icient.
4.2. High Mismatch Detection
There is a discontinuity in the speakers emotional ex-
pression. Even in the same speech, there are some fluctu-
ations. The purpose of the method is to identify the se-
rious mismatch segment relative to the neutral model in
speech. That is high mismatch segment. And reduce its
weight when calculating the final test statement score, in
order to improve the speaker recognition performance.
Figure 1. System flowchart of score reliability fusion based
on the baseband correlation.
For high mismatch detection, the first step is to detect
whether the testing speech belongs to the high difference
emotional speech, by using difference detection method
fusion of the short acoustic characteristics and statistical
prosodic features. Then divide the testing speech into
several baseband snippets. The next, the baseband mean
which is higher than the thresholdmale: 156 Hz, female:
250 Hz) is marked as the high mismatch segment.
4.3. Score Reliability Fusion Function Based on
the Baseband Correlation
For high difference emotion, there is a positive correla-
tion between baseband mean deviation and the degree of
mismatch of emotional state. In this article, we use the
correlation to build a score reliability fusion function
related to baseband for high mismatch segment. But for
low mismatch segment, we consider it is relatively close
to its neutral, and its frame score weight is set as 1.
We use the deviation between tested voice baseband
mean and the groups of neutral voice baseband to instead
that deviation between tested voice baseband mean and
corresponding neutral voice-based frequency deviation
from the mean. In addition, voice baseband deviation
band speaker voice recognition as one of the bands neu-
tral voice matches the State, that is, the coefficient of
reliability weighted scores on such frames. Below we de-
fine specific forms of the weighting function:
1) We concentrated frequency values Fg of neutral
voice fundamental which is in set of parameters devel-
oped (g is the gender), and deviate speaker’s baseband of
the mean of range [250, 250] into k equal parts, each of
equal parts is Inv
500/K;
2) We calculate the identification rate
m
g
IR
of set of
parameters developed male and female high difference
class Emotional Speech which are among the every devi-
ation interval Rm (m
1,2,…,K).
3) For a period of test speech X
{xt ǀ t
1,2,Λ,T},
the Score reliability weighting function is
=else
StifIRe
tw HMSgtm
g1
,
)( )(
(7)
We shoul d know
 
M
i
i
e]0,,1,
,0[=
m(t) is the t frame pitch deviation of mean value relative
to the base frequency of the pieces fall within the m/K
range, IRg
[
1
g
ir
,,
K
g
ir
]T is the high differences class
of emotional speech recognition rate that we precompute
the gender related deviation band in step 2. SHMS is the
frame number collection of the high mismatch in the
testing speech. When the frame score weighting factor in
SHMS collection is zero, we call that excluding strategy.
Q. HE ET AL.
Copyright © 2013 SciRes. CN
599
4.4. Speaker Recognition System of Score
Reliability Fusion Based on the Baseband
Correlation
Speaker recognition model training is the same as the
traditional speaker recognition. For the collection of N
registered speaker, we train one speaker model λi for
every speaker, 1
i
N. In the test, we should determine
the gender information of testing speech X
{xt ǀ t
1,2,
Λ,T}, then calculate the reliability weighting coeff icients
wg(t), t
1,2,Λ,T. At last, we have a weight for X about
the score for each frame of Λ
{λ1,λ2,L,λN}, and the
testing speech is determined the speaker i·corresponded
the probability value of the maximum model.
=
≤≤≤≤
==
T
titg
Ni
i
Ni
xptwXPW
1
11
*
)|(log)(maxarg)|(logmaxargi
λλ
(8)
5. Experimental Analysis and Discussion
Experimental corpus base Mandarin Affective Speech
Corpus (MASC) and Emotional Prosody Speech and
Transcripts (EPST). MASC has 23 female and 45 male
speakers’ utterance in Chinese mandarin with 5 emotion-
al classifications (neutral, angry, happy, scared, and sad
classifications). Every speaker has 5 phrases and 60 sen-
tences in every emotional state. Each phrase lasts 0.8
second averagely, while each sentence lasts 2 seconds
averagely. Besides, there are 2 short passages with aver-
age duration of 15 seconds per passage in neutral state.
EPST is the first emotional speech corpus released by
Linguistic Data Consortium (LDC). It includes 8 actors
(3 male, 5 female). 7 speakers of them provide their Eng-
lish speech in 14 emotional classifications and their neu-
tral speech with different distance. The corpus used in
the experiment is split into 3 parts: Speeches of the first
18 people (7 female and 11 male) in MASC were taken
as development data to obtain fitting parameters; Speeches
of the remains in MASC were test data. 2 short passages
of every speaker were used to train speaker model, and
the other 15,000 sentences were used as testing speeches;
In addition, speeches of 7 speakers in EPST correspond-
ing with 5 same emotional classifications as MASC w ere
treated as extended test data. About 5 minutes neutral
speeches of each speaker in normal distance were used to
train speaker model. 5 kinds of emotional sentences with
total count 670 were taken as testing speech.
In the experiment, UBM is adopted 1024 orders and
characteristics are 13-dimensional MFCC and its delta.
The length of window for MFCC, energy and pitch are
32 ms uniformly, and step sizes are 16 ms uniformly. All
neutral speeches of the first 18 people in MASC were
used as training speeches for UBM, and UBM was ob-
tained by expectation maximization algorithm (EM). For
every speaker, his speaker model was obtained using his
neutral speech from UBM by MAP. In addition, GMM is
adopted 1024 ord e rs in gender recognition.
For verifying the validity of two kinds fusion weight
estimating strategy based on the score reliability assess-
ment, this part will compare the four methods of recogni-
tion performance on the MASC corpus and EPST corpus.
The four methods are: the bi-model method fusion weight
estimating strategy based on the score reliability assess-
ment (score difference), the bi-model method based on
the weight strategy of recognition rate (recognition rate),
the bi-model method based on the equal weight (equal
weight) and the traditional GMM-UBM me thod (datum).
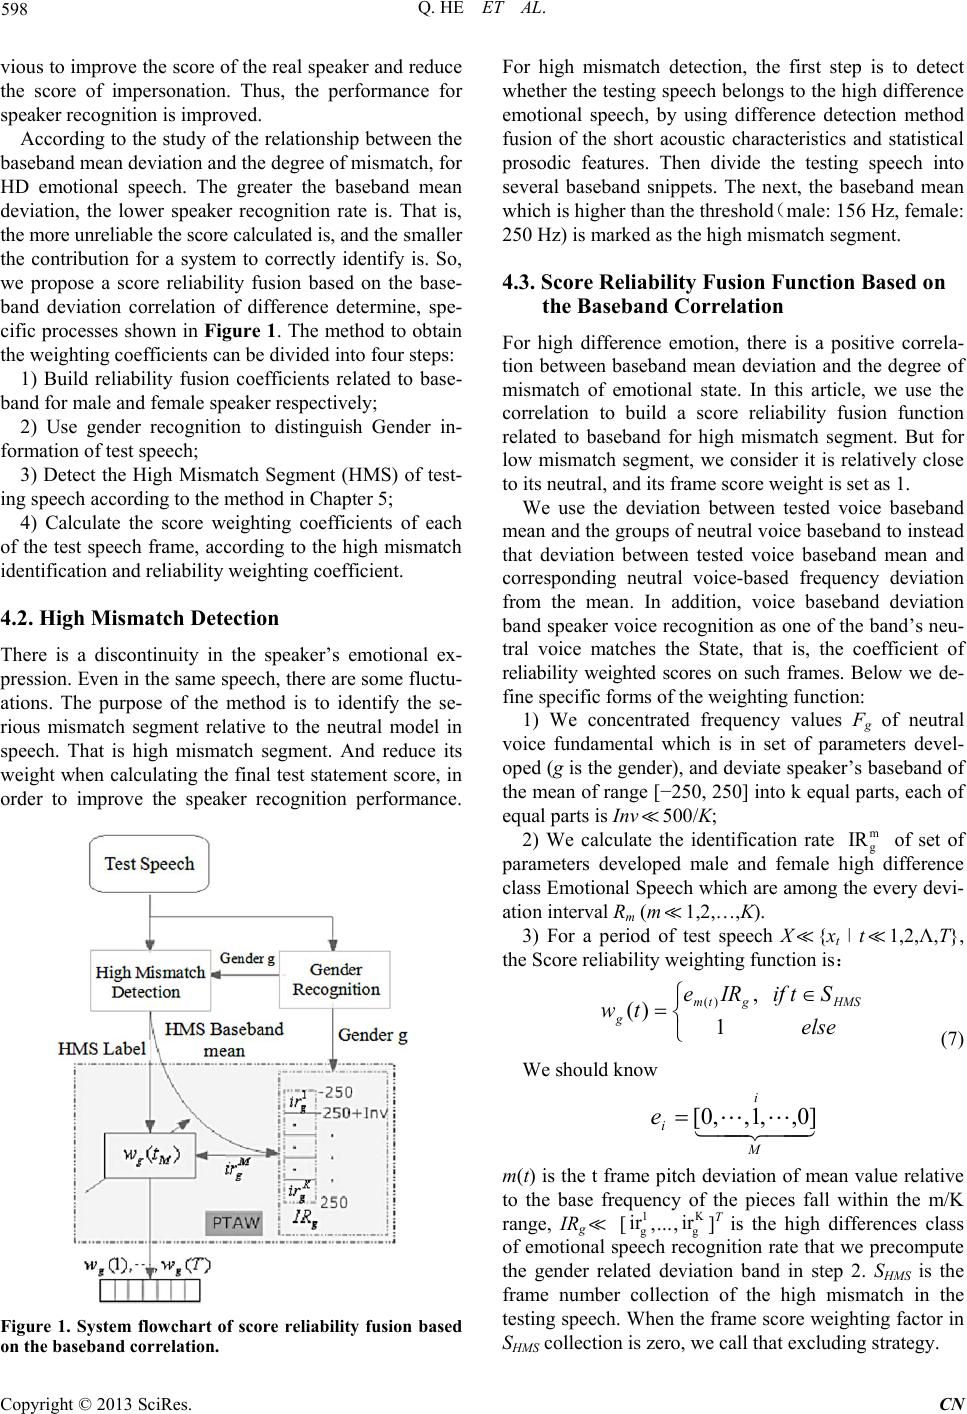
5.1. Experimental results on the MASC
For each speaker , the two-stage neutral parag raphs speech
are used to each speaker models from the UBM adaptive.
The specific experimental results of the three methods
are shown in Tab le 1. From the table, we first found this
method as opposed to elimination in anger, pleasure and
panic on the recognition rate improved, 0.7%, 2.00% and
1.53% respectively. This suggests that high mismatch
part which is excluded of your tests to correctly identify
the voice still has a role, and recognition of the base-
band-weighted approach can effectively measure the role
of that part of the speech. For two emotion of LD type,
neutral and sad, due to difference testing had been wrong-
fully convicted as a high difference in emotional, leading
to more significant decrease in the elimination. The LD
type emotional statement which is wrongfully convicted,
identified as highly mismatched parts of voice baseband
is relatively low. Weights in weighted method in this
paper is much higher, thereby avoiding removal method
to ignore the part of speech, negative impact on system
performance. Relative to the elimination method in this
article as a whole has increased 1.1%, relative to the base
has increased 2.48%.
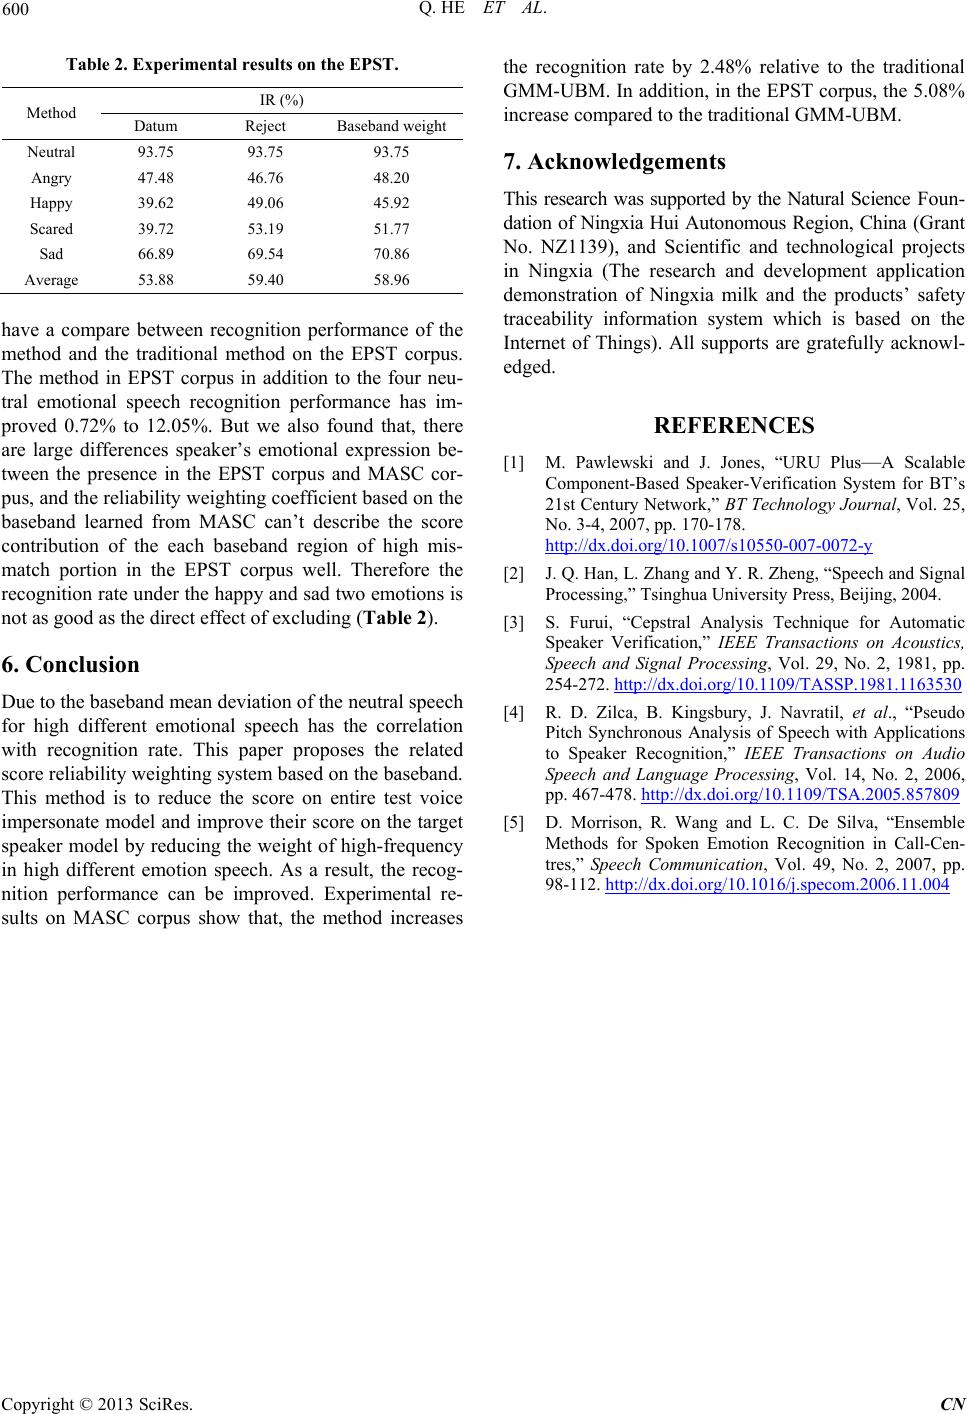
5.2. Experimental Results on the EPST
The EPST corpus and MFC corpus are the speech data-
base under two differ ent cultur al backgr ounds. To furth er
validate the effectiveness of the proposed method, we
Table 1. Experimental res ul t s on the MASC.
Method IR (%)
Datum Reject Baseband weight
Neutral 96.23 95.47 96.13
Angry 31.50 35.80 36.50
Happy 33.57 36.40 38.40
Scared 35.00 36.10 37.63
Sad 61.43 60.87 61.50
Average 51.55 52.93 54.03
Q. HE ET AL.
Copyright © 2013 SciRes. CN
600
Table 2. Experimental results on the EPST.
Method IR (%)
Datum Reject Baseband weight
Neutral 93.75 93.75 93.75
Angry 47.48 46.76 48.20
Happy 39.62 49.06 45.92
Scared 39.72 53.19 51.77
Sad 66.89 69.54 70.86
Average 53.88 59.40 58.96
have a compare between recognition performance of the
method and the traditional method on the EPST corpus.
The method in EPST corpus in addition to the four neu-
tral emotional speech recognition performance has im-
proved 0.72% to 12.05%. But we also found that, there
are large differences speakers emotional expression be-
tween the presence in the EPST corpus and MASC cor-
pus, and the reliability weighting coefficient based on the
baseband learned from MASC cant describe the score
contribution of the each baseband region of high mis-
match portion in the EPST corpus well. Therefore the
recognition rate under the happy and sad two emotions is
not as good as the direct effect of excluding (Table 2).
6. Conclusion
Due to the baseband mean deviation of the neutral speech
for high different emotional speech has the correlation
with recognition rate. This paper proposes the related
score reliability weighting system based on the baseband.
This method is to reduce the score on entire test voice
impersonate model and improve their score on the target
speaker model by reducing the weight of high-frequency
in high different emotion speech. As a result, the recog-
nition performance can be improved. Experimental re-
sults on MASC corpus show that, the method increases
the recognition rate by 2.48% relative to the traditional
GMM-UBM. In addition, in the EPST corpus, the 5.08%
increase compared to the traditional GMM-UBM.
7. Acknowledgements
This research was supported by the Natural Science Foun-
dation of Ningxia Hui Autonomous Region, China (Grant
No. NZ1139), and Scientific and technological projects
in Ningxia (The research and development application
demonstration of Ningxia milk and the products’ safety
traceability information system which is based on the
Internet of Things). All supports are gratefully acknowl-
edged.
REFERENCES
[1] M. Pawlewski and J. Jones, URU PlusA Scalable
Component-Based Speaker-Verification System for BT’s
21st Century Network,” BT Technology Journal, Vol. 25,
No. 3-4, 2007, pp. 170-178.
http://dx.doi.org/10.1007/s10550-007-0072-y
[2] J. Q. Han, L. Zhang and Y. R. Zheng, Speech and Signal
Processing,” Tsinghua University Press, Beijing, 2004.
[3] S. Furui, “Cepstral Analysis Technique for Automatic
Speaker Verification,” IEEE Transactions on Acoustics,
Speech and Signal Processing, Vol. 29, No. 2, 1981, pp.
254-272. http://dx.doi.org/10.1109/TASSP.1981.1163530
[4] R. D. Zilca, B. Kingsbury, J. Navratil, et al., “Pseudo
Pitch Synchronous Analysis of Speech with Applications
to Speaker Recognition,” IEEE Transactions on Audio
Speech and Language Processing, Vol. 14, No. 2, 2006,
pp. 467-478. http://dx.doi.org/10.1109/TSA.2005.857809
[5] D. Morrison, R. Wang and L. C. De Silva, “Ensemble
Methods for Spoken Emotion Recognition in Call-Cen-
tres,” Speech Communication, Vol. 49, No. 2, 2007, pp.
98-112. http://dx.doi.org/10.1016/j.specom.2006.11.004