Communications and Network, 2013, 5, 448-454
http://dx.doi.org/10.4236/cn.2013.53B2083 Published Online September 2013 (http://www.scirp.org/journal/cn)
Copyright © 2013 SciRes. CN
Radio Link Parameters Based QoE Measur ement of Voice
Service in GSM Network*
Wenzhi Li1, Jing Wang1, Zesong Fei1, Yuqiao Ren1, Xiao Yang2, Xiaoqi Wang2
1School of Information and Electronics, Beijing Institute of Technology, Beijing, China
2The Research Institution of China Mobile, Beijing, China
Email: we nz hi306@163.com, wangjing@bit.edu.cn, feizesong@bit.edu.cn, ryq8884291@126.com,
yangxiao@chinamobile.com, wangxiaoqiyf@chinamobile.com
Received May 2013
ABSTRACT
Recently, Quality of Experience (QoE) of voice service has been paid more attentions because it represents the perfor-
mance of voice service subjectively perceived by the end users. And speech quality is commonly used to measure the
QoE value. In this paper, a speech quality assessment algorithm is proposed for GSM network, aiming to predict and
monitor QoE of voice service based on radio link parameters with low complexity for operators. Multiple Linear Re-
gression (MLR) and Principal Component Analysis (PCA) are combined and used to establish the mapping model from
radio link parameters to speech quality. Data set for model training and testing is obtained from real commercial net-
work of China Mobile. The experimental results show that w ith sufficient training data, this algor ithm can predict radio
speech quality with high accuracy and could be used to monitor speech quality of mobile network in real time.
Keywords: QoE; Speech Quality Assessment; Voice Service; Regression Ana lysis; P CA; GSM
1. Introduction
Voice service has been and will continue to be the most
fundamental and significant service in cellu lar mob ile com-
munication systems. And speech delivered over Global
System for Mobile Communications (GSM) network ac-
counts for much of voice traffic. Therefore, fo r o p erat ors,
it is of significant that Quality of Experience (QoE) [1]
of voice service can be monitored in real time, which
guides network optimization as well as network main-
tenance directly and effectively. Speech quality is consi-
dered as the most comprehensive metric that characteriz-
es the QoE of end subscriber. A QoE measurement algo-
rithm, which can reflect the radio link condition and
could be integrated in the signaling monitor system, is
preferred from the perspective of operators. Note that the
novel algorithm should be real-time and accurate. Be-
sides, low complexity is also necessary.
Subjective Mean Opinion Score (MOS) [2] assessment
reflects the listener’s actual perception of voice best, but
the operation is time-consuming and laborious. Thus, ob-
jective assessments algorithm, which can be divided into
voice based and radio link parameters based algorithms
depending on whether voice signal is needed, is devel-
oped to approximate the subjective MOS. Perceptual
Evaluation of Speech Quality (PESQ) [3] proposed by
ITU-T is a typical voice-based algorithm which is a
commonly used method of voice quality test in wireless
network due to its quite high relevance with subjective
MOS. However, PESQ does not apply to the long-term
and large scale network monitoring for its high cost of
implementation. The assessment method based on net-
work parameters [4] is more suitable to real-time assess-
ment of voice quality in mobile network, because most of
its input parameters can be measured from network in
real time.
The Speech Quality Indicator (SQI) [5] algorithm de-
veloped by Ericsson Corporation and the Voice Quality
Index (VQI) [6] specifically for Time Division Synchron-
ous Code Division Multiple Access (TD-SCDMA) net-
work by Huawei Corporation are two typical algorithms
based on network parameters. SQI expresses the degree
of voice distortion caused by radio link transmission,
which is calculated by weighting a number of radio link
parameters including Bit Error Rate (BER), Frame Error
Rate (FER), handing over, Discontinuous Transmission
(DTX) and speech coding mode (speech codec), etc. VQI
has a similar thinking with SQI. The input parameters of
VQI are speech coding mode, FER, BER, handing over
and frame loss.
*
This work was supported by China National S&T Major Project
(2012ZX03001034).
W. Z. LI ET AL.
Copyright © 2013 SciRes. CN
449
Although those two algorithms have been implemented
by equipment manufacturers, with high accuracy if ade-
quate enough network parameters are collected, their in-
dex values are not very applicable to monitor the QoE of
voice service and network quality. That’s because the
major parameters such as FER, BER, frame loss and so
on which have a great impact on QoE can’t be real-time
acquired by operators in the GSM signaling monitoring
platform. Besides, the speech index values of SQI and
VQI cannot be compared in the network monitoring and
optimization because of their private interfaces by dif-
ferent manufacturers. The purpose of this paper is to solve
the existing problems by proposing a novel QoE mea-
suring algorithm especially for GSM network. The algo-
rithm inputs are specific network parameters collected in
signaling monitoring platform from commercial GSM net-
work of China Mobile. Multiple Linear Regression (MLR)
based on least squares is adopted to further investigate
the relationship between network parameters and QoE of
voice service. All of these features make it possible that
the real-time algorithm with low complexity is suitable
for monitoring QoE of v oi c e s e r vi c e by opera tors.
2. Measurement of QoE of Voice Service
Based on GSM Network Parameters
2.1. Thinking of Measurement Algorithm
The purpose of this algorithm is to measure QoE of voice
service in real time by GSM network parameters. There-
fore, two conditions should be satisfied: network para-
meters must be obtained in real time; a mapping model
from network parameters to speech quality should be es-
tablished.
In GSM network, Measurement Repor t (MR) is one of
the main foundations to assess the quality of radio envi-
ronment. The MR signaling is transmitted every 480ms
in traffic channel (470ms in signaling channel), including
Received S ignal Qua lity (Rx Qual), Re ceived Signal Level
(RxLev), handing over, hopping, speech coding mode and
etc. Therefore, selecting MR as the access of network pa-
rameters can not only express the quality of current radio
link, but also requires little cost to transform current net-
work. Considering the following conditions: time for hu-
man ear to percept voice, PESQ algorithm proposing the
assessed object includes at least 3.2 s speech [7] and the
quantity of MR demanded by measuring algorithm and
the efficiency of data collection in commercial network,
the time granularity of measuring algorithm used in this
paper is set as 4.8 s finally.
The next step is to obtain the speech quality used for
data modeling corresponding to network parameters. The
specific approach is to record the voice sample corres-
ponding to a set of network parameters in time, and then
assess the speech quality with PESQ a lgor ithm . T he model
mapping from network parameters to voice quality adopts
the Multiple Linear Regression method which takes the
advantage of low complexity and high accuracy.
2.2. Obtaining Network Parameters
To reflect the status of current n e two rk more r e alistically,
both the model training and testing use data are collected
from the commercial network. In order to accurately meas-
ure the influence to speech quality caused by radio link
parameters, we ca ptured t he net work param eters and speech
data using the way of cell phone calls landline.
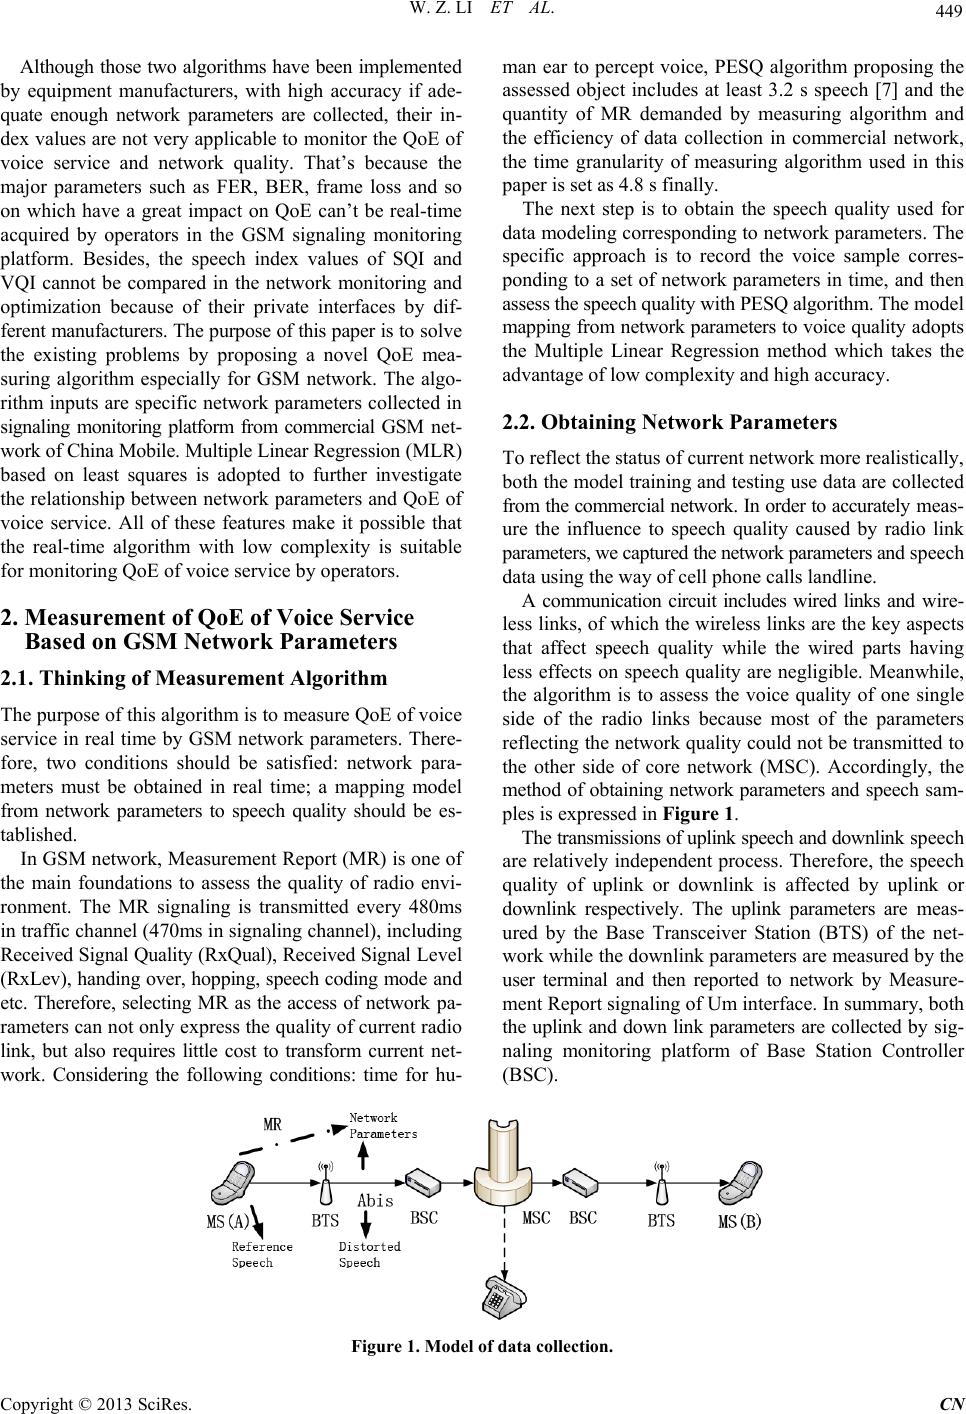
A communication circuit includes wired links and wire-
less links, of which the wireless links are the key aspects
that affect speech quality while the wired parts having
less effects on speech quality are negligible. Meanwhile,
the algorithm is to assess the voice quality of one single
side of the radio links because most of the parameters
reflecting the network q uality could not be transmitted to
the other side of core network (MSC). Accordingly, the
method of obtaining network parameters and speech sam-
ples is expressed in Figure 1.
The transmissions of uplink speech and downlink speech
are relatively independent process. Therefore, the speech
quality of uplink or downlink is affected by uplink or
downlink respectively. The uplink parameters are meas-
ured by the Base Transceiver Station (BTS) of the net-
work while the downlink parameters are measured by the
user terminal and then reported to network by Measure-
ment Report signaling of Um interface. In summary, both
the uplink and down link parameters are collected by sig-
naling monitoring platform of Base Station Controller
(BSC).
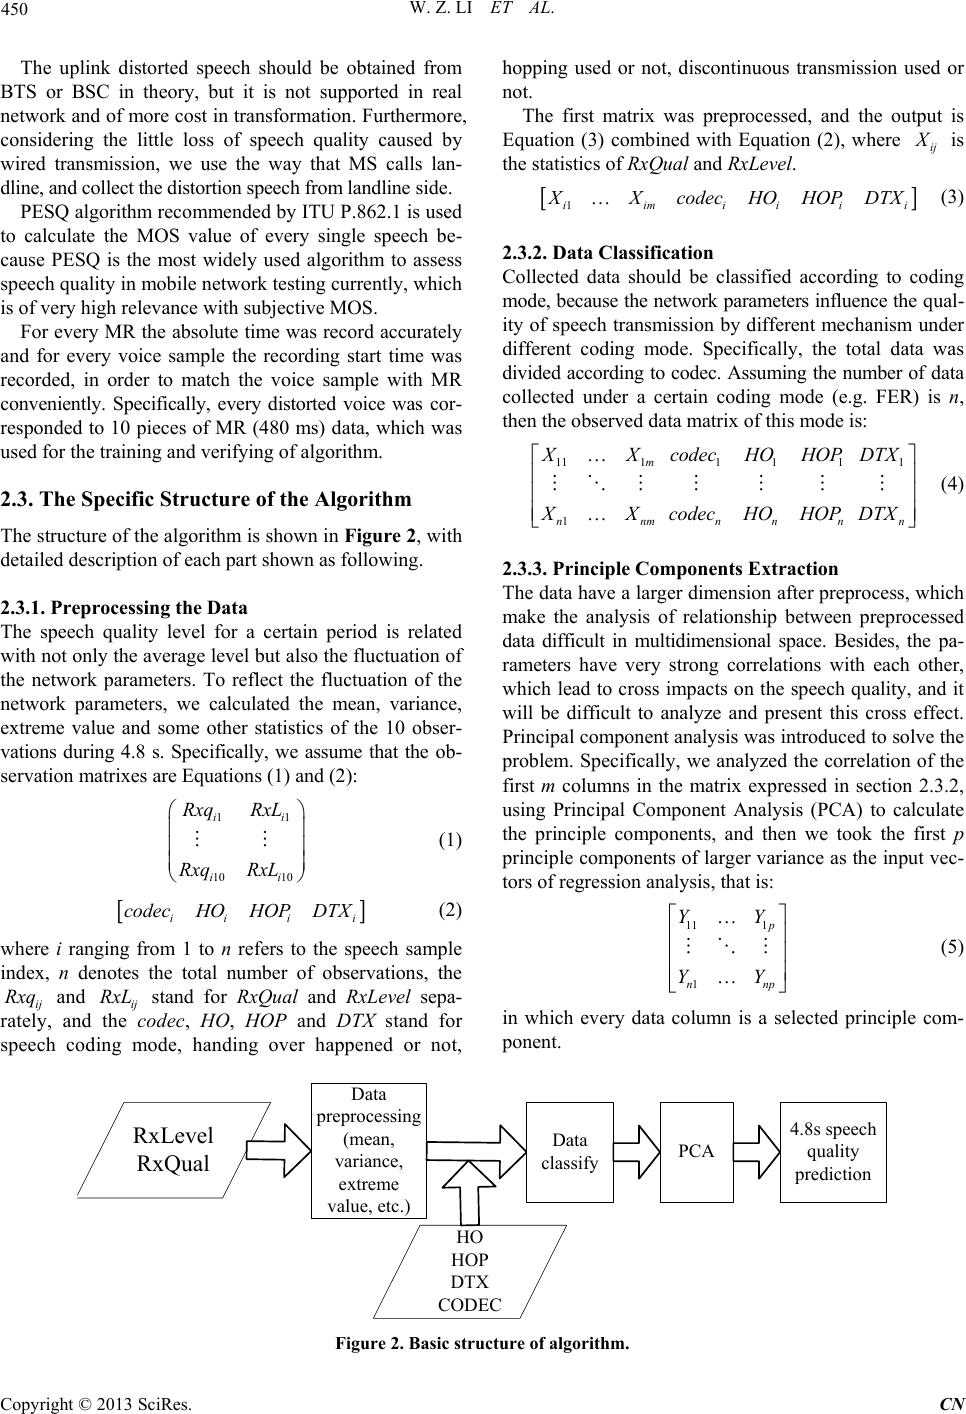
Figure 1. Model of data collection.
W. Z. LI ET AL.
Copyright © 2013 SciRes. CN
450
The uplink distorted speech should be obtained from
BTS or BSC in theory, but it is not supported in real
network and of more cost in transformation. Furthermore,
considering the little loss of speech quality caused by
wired transmission, we use the way that MS calls lan-
dline, and c ollec t the dist orti on speec h from landli ne side.
PESQ algorithm reco mmended by I TU P.862.1 is used
to calculate the MOS value of every single speech be-
cause PESQ is the most widely used algorithm to assess
speech quality in mobile network testing currently, which
is of very high relevance with subjective MOS.
For every MR the absolute time was record accurately
and for every voice sample the recording start time was
recorded, in order to match the voice sample with MR
conveniently. Specifically, every distorted voice was cor-
responded to 10 pieces of MR (480 ms) data, which was
used for the training and verifying of algorithm.
2.3. The Specific Structure of the Algorithm
The structure of the algorithm is shown in F igure 2, with
detailed descr iption of each part shown as following.
2.3.1. Preprocessing the Data
The speech quality level for a certain period is related
with not only the average level but also the fluctuation of
the network parameters. To reflect the fluctuation of the
network parameters, we calculated the mean, variance,
extreme value and some other statistics of the 10 obser-
vations during 4.8 s. Specifically, we assume that the ob-
servation matrixes are Equations (1) and (2):
11
10 10
ii
ii
Rxq RxL
Rxq RxL






(1)
[ ]
ii ii
codecHOHOPDTX
(2)
where i ranging from 1 to n refers to the speech sample
index, n denotes the total number of observations, the
ij
Rxq
and
ij
RxL
stand for RxQual and RxLevel sepa-
rately, and the codec, HO, HOP and DTX stand for
speech coding mode, handing over happened or not,
hopping used or not, discontinuous transmission used or
not.
The first matrix was preprocessed, and the output is
Equation (3) combined with Equation (2), where
ij
X
is
the statistics of RxQual and RxLevel.
[ ]
1iimi iii
XXcodecHOHOP DTX
(3)
2.3.2. D ata Class i ficatio n
Collected data should be classified according to coding
mode, because the network parameters influence the qual-
ity of speech transmission by different mechanism under
different coding mode. Specifically, the total data was
divided according to codec. Assuming the number of data
collected under a certain coding mode (e.g. FER) is n,
then the observed data matrix of this mode is:
(4)
2.3.3. Principle Components Extraction
The data have a larg er dimension after preprocess, which
make the analysis of relationship between preprocessed
data difficult in multidimensional space. Besides, the pa-
rameters have very strong correlations with each other,
which lead to cross impacts on the speech quality, and it
will be difficult to analyze and present this cross effect.
Principal component analysis was introduced to solve the
problem. Specifically, we analyzed the correlation of the
first m columns in the matrix expressed in section 2.3.2,
using Principal Component Analysis (PCA) to calculate
the principle components, and then we took the first p
principle components of larger variance as the input vec-
tors of regression analysis, that is:
11 1
1
p
n np
YY
YY






(5)
in which every data column is a selected principle com-
ponent.
Figure 2. Basic structure of algorithm.
RxLevel
RxQual
Data
preprocessing
(mean,
variance,
extreme
value, etc.)
Data
classify PCA 4.8s speech
quality
prediction
HO
HOP
DTX
CODEC
W. Z. LI ET AL.
Copyright © 2013 SciRes. CN
451
It should be noted that not all selected p principle
components will necessarily remain in the final measur-
ing formula, because some principle components of little
impact on speech quality would be excluded according to
the hypothesis testing results in the fitting procedure of
regressing equation.
2.3.4. Quality Me asurin g of 4.8 s Speech
Under a certain coding mode (e.g. uplink FER), the basic
form of the measuring formula is:
0 111
23
* **
**
upEFRi ii
ii
MOSaa Ya YaHO
aHOP aDTX
+
++
=++++
++
(6)
where
1i
YY
are the extracted principle components,
and HO, HOP, DTX, codec are limited to specific dis-
crete values, and
i
a
are fitted coefficients.
The final form of the measuring formula and the fitting
coefficients would be obtained through multiple regres-
sion analysis [8]. For each coding mode, the preliminary
least-squares fitting of the input data and the speech qual-
ity values would be taken, and then the test of signific-
ance (e.g. the F-test and T-test) will apply to the obtained
regression equation. An F-test (
0.05a=
) is used to de-
termine whether the liner relationship of the equation is
significant, while a T-test is used to determine whether
the impact of each variable is significant, leading to some
variables excluded according to the result. After the hy-
pothesis testing, the regression equation needs residual
test and outlier test to determine whether the nonlinear
transform processing or some other kinds of processing
should be taken to the data. Normality test is used in the
residual analysis.
3. Performance Analysis
3.1. Condition of Data Collection
The data collection for algorithm training and testin g was
based on three typical codec modes of GSM network,
with the network parameters and speech samples record-
ed according to uplink and downlink separately. The dis-
tribution of valid data used in the algorithm is shown as
Table 1.
For each case, three quarters of the total data are used
for algorithm training to produce the measuring formula
of speech quality. The left one quarter data are used to
test the performance of algorithm.
3.2. Evaluation Index of the Algorithm
Here, we call the QoE value of voice service predicted by
radio link parameters in mobile network as RSQ (Radio
Speech Quality) . For each set of network para meters (cor-
responded to 10 pieces of MR data), we predict a RSQ
value using this algorithm, and compare it with the actual
PESQ value of the speech, counting the following indi-
cators to measure the algorithm’s prediction accuracy.
Aiming at monitoring speech quality in actual network,
this paper proposed a stricter segmented relative error
indicator.
Indicator 1: Segmented relative error, as shown in
Table 2. In order to eliminate the in fluen ce to statistic
result caused by the interval endpoint value, norma-
lized relative error expressed in Equation (7) is used
based on the fact that PESQ (MOS-LQO) [9] has a
workin g ra nge of (1. 02 , 4.56].
*100%
Actual MOSPredictedMOS
relative error
=
(7)
where
( )
4.56 1.02
HL
MOS MOS∆=−= −
, MOSH and
MOSL stand for upper and lower limits of the PESQ val-
ue.
Specially, in MOS range of (1.02, 2], the accuracy of
low value alarm was taken to indicate the accuracy of the
algorithm. That is b ecause the referenced P ESQ algorithm
Table 1. Distribution of data used in algorithm.
Actual PESQ value range Uplink Downlink
EFR FR HR EFR FR HR
(1, 2] 82 20 4 13 20 2
(2, 3] 62 63 18 110 63 10
(3, 4.5] 413 251 185 326 251 198
Table 2. Relative error indicators in segments.
Actual RSQ Output of algorithm Segmented indicators of accuracy
(1.02, 2] RSQ value and low value alarm
(give low value alarm when predicted speech quality is in (1.02, 2]) Accuracy of low value alarm
(2, 3] RSQ value Percentage of data whose relative error is less than 10%
(3, 4.56] RSQ value Percentage of data whose relative error is less than 10%
W. Z. LI ET AL.
Copyright © 2013 SciRes. CN
452
itself has a low measuring accuracy in low value interval,
and the speech quality become intolerable when MOS
value is lower than 2, where it moots to give the specific
MOS value, so alarm should be given when the actual
network quality appears very low. The accuracy of low
value alarm is calculated in Equation (8),
M
Accuracy oflow value alarmN
=
. (8)
where M denotes the number of samples with predicted
MOS in
(
]
1.02,20.2+
and actual MOS in
(
]
1.02,2.0
,
N is the total number of samples with actual MOS in
(
]
1.02,2.0
.
Indicator 2: Pearson's correlation coefficient R cal-
culated by E quation (9 ),
( )( )
( )( )
=1
22
=1 =1
=
N
ii
i
NN
ii
ii
qqy
Rq yqy
y−−
−−
∑∑
(9)
where
i
q
and
q
stand for the value and mean of ac-
tual MOS separately;
i
y
and
y
stand for the value
and mean of predicted MOS by algorithm separately.
Indicator 3: Root Mean Square Error RMSE is
shown in Equation (10), where
i
q
and
i
y
stand for
the actual MOS value and the predicted MOS value
separately.
( )
2
=1
=
i
N
i
i
yq
RMSE N
(10)
Correlation coefficient and Root Mean Square Error
are metrics of performance commonly used in interna-
tional objective quality assessment algorithm, which can
measure not only the correlation between the predicted
value and the real value but also the degree of dispersion.
3.3. Test Performance of the Algorithm
The valid data collected were divided into training data
accounted for three quarters and testing data accounted
for one quarter. Accuracy in indicator 1 (Table 2) is
shown as Table 3 (“-” indicates amount of data of the
interval is too small to count accuracy).
Due to the network conditions, the data collected from
commercial network was difficult to achieve traversal,
and most networks in the collection area were configured
EFR mode to achieve relatively better performance, with
fewer FR and HR data. Accordingly, the algorithm has a
better performance under EFR mode because of more
training data. Table 4 shows the measuring results of
indicator R and RMSE under EFR mode .
To reflect the performance of alg orithm intuitive ly, the
maps of actual RSQ and predicted RSQ under uplink
EFR mode is shown for example in Figure 3.
Table 3. Accuracy of algorithm in indicator 1.
Actual PESQ value range (1, 2] (2, 3] (3, 4.5]
Uplink EFR training effect 93% 60% 96%
testing effect 95% 58% 94%
Downlink EFR training effect 67% 65% 92%
testing effect 100% 67% 93%
Uplink FR training effect 71% 54% 88%
testing effect 100% 56% 88%
Downlink FR training effect - 83% 99%
testing effect - 100% 97%
Uplink HR training effect 67% 73% 98%
testing effect - - 98%
Downlink HR training effect - 85% 97%
testing effect - 67% 95%
Table 4. R and RMSE in EFR mode.
Actual PESQ value range (1, 2] (2, 3] (3, 4.5] Overall
Uplink EFR training results R 86% 91% 84% 97%
RMSE 0.19 0.27 0.17 0.19
Uplink EFR testing results R 86% 82% 83% 97%
RMSE 0.20 0.25 0.17 0.19
Downlink EFR training results R 66% 52% 89% 92%
RMSE 0.50 0.28 0.19 0.23
Downlink EFR testing results R 82% 56% 89% 91%
RMSE 0.50 0.29 0.21 0.25
W. Z. LI ET AL.
Copyright © 2013 SciRes. CN
453
Figure 3. Distribution of Actual MOS and Predicted MOS for UP-EFR Mode.
In Figure 3, the abscissa indicates the RSQ predicted
by the algorithm using radio link parameters, and the
ordinate indicates the speech quality assessed by PESQ.
The middle is the 45˚ isoline, on which the predicted
values and the actual values are equal. And two lines
which indicate that the absolute value of estimated error
is 0.5 are below and above the isoline.
It can be suggested, for uplink EFR, the amount of da-
ta is adequate and the MOS values distribute relatively
evenly, which means the amount and ergodicity are bet-
ter. Consequently, the overall correlation is greater than
90%, and the RMSE is about 0.2, indicating that the
measuring algorithm is of better performance, In addition,
accuracy of tra ining and testing are b asically equal, show-
ing a good stability of proposed algorithm. Meanwhile,
amount of data is much larger in MOS interval o f (3, 4. 5]
than (2, 3], accordingly the former relative error is sig-
nificantly smaller than the later, from which we can see
that the amount of training data has an important impact
on the algorithm accuracy.
Under downlink EFR mode, the accuracy difference
between training and testing of the algorithm is larger in
MOS interval of (1, 2] because the amount of available
data in the interval is smaller, leading to local instability
of the algorithm.
For FR and HR modes, because of less data and poor
MOS ergodicity, it is still not sufficient to support effec-
tive training of the algorithm.
In conclusion, when the amount of training data is
adequate and the distribution of MOS value is evenly, the
algorithm provides a high measuring accuracy.
4. Conclusion
This paper proposed a QoE measuring algorithm of voice
service for GSM network, taking radio link parameters
which can be obtained from mobile network in real time
as inputs. Multiple regression and principle component
analysis are combined in the modeling approach of QoE
assessment. The method is especially convenient to be
integrated into signaling monitoring platform of wireless
networks. Both the algorithm’s training and testing pro-
cedures use data collected from commercial GSM net-
works, and the result has shown that with adequate valid
data, the algorithm will achieve high accuracy. Further-
more, the propos e d QoE pre diction met hod ba se d on GSM
network can also be extended to other wireless networks
such as Universal Mobile Telecommunications System
(UMTS) and Long-term Evolution (LTE).
REFERENCES
[1] ITU-T P.10/G.100, “Vocabulary and Effects of Transmis-
sion Parameters on Customer Opinion of Transmission
Quality,” 2008.
[2] ITU-T Recommendation P.800, “Methods for Subjective
Determination of Transmission Quality,” 1996.
[3] ITU-T Recommendation P.862, “Perceptual Evaluation of
Speech Quality (PESQ): An Objective Method for End-
to-End Speech Quality Assessment of Narrow-Band Tel-
ephone networks and Speech Codecs,” 2001.
[4] Huawei Technologies Co., Ltd. “The Methods and De-
vices for the Estimation of Spe ech Quality ,” China Patent
No. 200710172408.7, 2009.
W. Z. LI ET AL.
Copyright © 2013 SciRes. CN
454
[5] Ericsson Telefon AB-LM, “Speech Qua lity Measurement
in Mobile Telecommunication Networks Based on Radio
Link Parameters,” US Patent No. 19970861563, 2000.
[6] Y. J. ZUO, “Perception of Voice, Win by Method—So-
lutions for Voice Quality Assessment in TD-SCDMA by
HUAWEI: VQI,” Mobile Communications, Vol. 34, No.
3, 2010, pp. 30-31.
[7] ITU-T Recommendation P.862.3, “Application Guide for
Objective Quality Measurement Based on Recommenda-
tions P.862, P.862.1 and P.862.2,” 2007.
[8] M. Kantardzic (translated by S.Q. Shan, Y. Chen and Y.
Cheng), “Data Mining,” Tsinghua University Press, Bei-
jing, 2003.
[9] ITU-T Recommendation P.862.1, “Mapping Function for
Transforming P.862 Raw Result Scores to MOS-LQO,
2003.