Paper Menu >>
Journal Menu >>
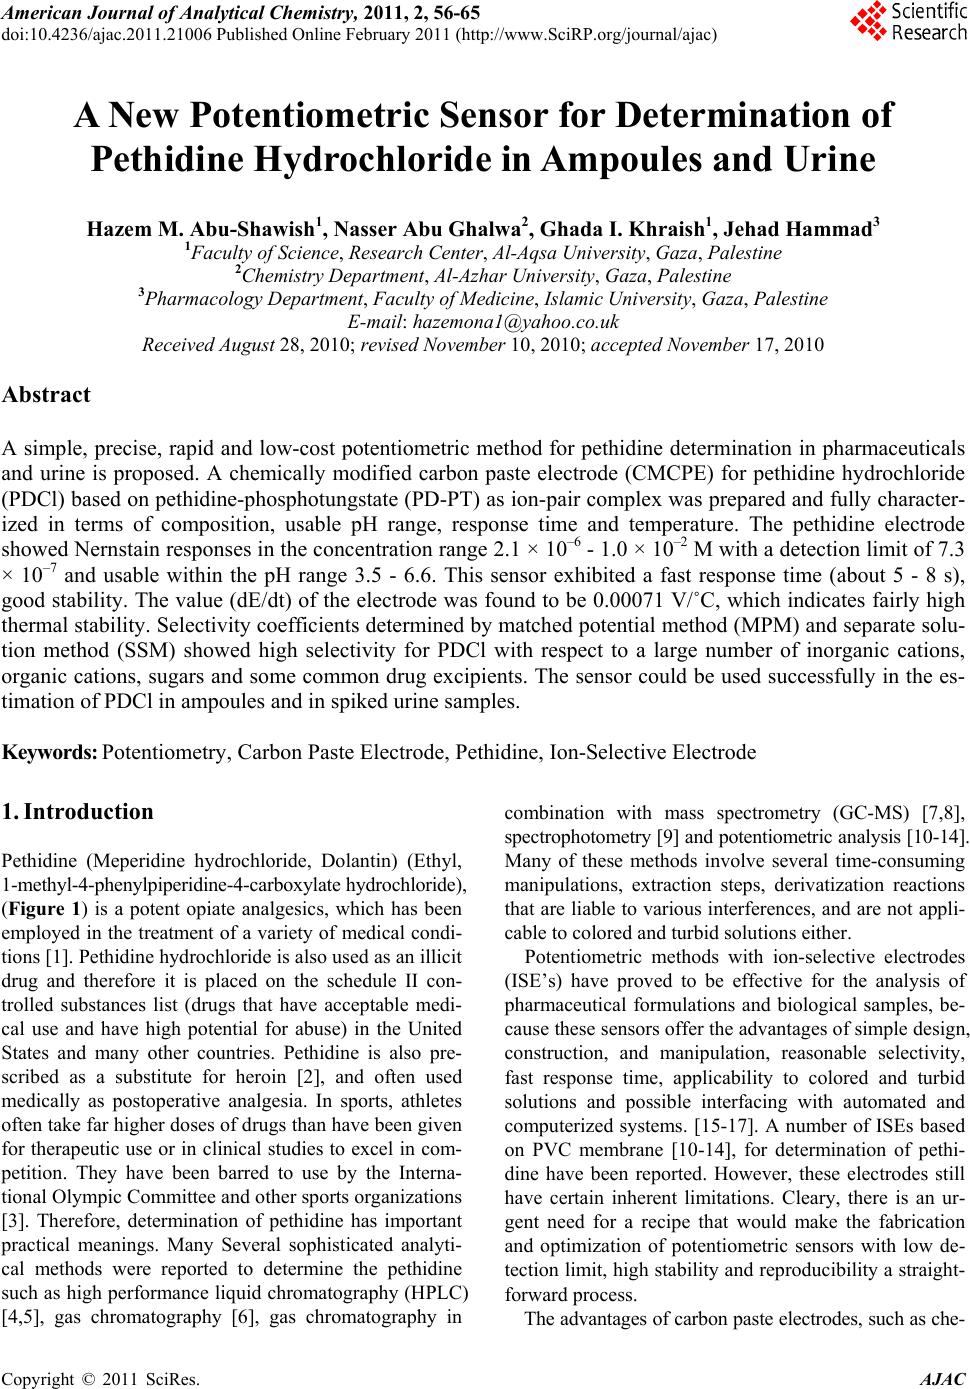 American Journal of Analyt ical Chemistry, 2011, 2, 56-65 doi:10.4236/ajac.2011.21006 Published Online February 2011 (http://www.SciRP.org/journal/ajac) Copyright © 2011 SciRes. AJAC A New Potentiometric Sensor for Determination of Pethidine Hydrochloride in Ampoules and Urine Hazem M. Abu-Shawish1, Nasser Abu Ghalwa2, Ghada I. Khraish1, Jehad Hammad3 1Faculty of Sc ience, Research Center, Al-Aqsa University, Gaza, Palestine 2Chemistry Department, Al-Azhar University, Gaza, Palestine 3Pharmacology Department, Faculty of Medicine, Islamic University, Gaza, Palestine E-mail: hazemona1@yahoo.co.uk Received August 28, 2010; revised November 10, 2010; accepted November 17, 2010 Abstract A simple, precise, rapid and low-cost potentiometric method for pethidine determination in pharmaceuticals and urine is proposed. A chemically modified carbon paste electrode (CMCPE) for pethidine hydrochloride (PDCl) based on pethidine-phosphotungstate (PD-PT) as ion-pair complex was prepared and fully character- ized in terms of composition, usable pH range, response time and temperature. The pethidine electrode showed Nernstain responses in the concentration range 2.1 × 10⁻⁶ - 1.0 × 10⁻² M with a detection limit of 7.3 × 10⁻⁷ and usable within the pH range 3.5 - 6.6. This sensor exhibited a fast response time (about 5 - 8 s), good stability. The value (dE/dt) of the electrode was found to be 0.00071 V/˚C, which indicates fairly high thermal stability. Selectivity coefficients determined by matched potential method (MPM) and separate solu- tion method (SSM) showed high selectivity for PDCl with respect to a large number of inorganic cations, organic cations, sugars and some common drug excipients. The sensor could be used successfully in the es- timation of PDCl in ampoules and in spiked urine samples. Keywords: Potentiometry, Carbon Paste Electrode, Pethidine, Ion-Selective Electrode 1. Introduction Pethidine (Meperidine hydrochloride, Dolantin) (Ethyl, 1-methyl-4-phenylpiperidine-4-carboxylate hydrochloride), (Figure 1) is a potent opiate analgesics, which has been employed in the treatment of a variety of medical condi- tions [1]. Pethidine hydrochloride is also used as an illicit drug and therefore it is placed on the schedule II con- trolled substances list (drugs that have acceptable medi- cal use and have high potential for abuse) in the United States and many other countries. Pethidine is also pre- scribed as a substitute for heroin [2], and often used medically as postoperative analgesia. In sports, athletes often take far higher doses of drugs than have been given for therapeutic use or in clinical studies to excel in com- petition. They have been barred to use by the Interna- tional Olympic Committee and other sports organizations [3]. Therefore, determination of pethidine has important practical meanings. Many Several sophisticated analyti- cal methods were reported to determine the pethidine such as high performance liquid chromatography (HPLC) [4,5], gas chromatography [6], gas chromatography in combination with mass spectrometry (GC-MS) [7,8], spectrophotometry [9] and potentiometric analysis [10-14]. Many of these methods involve several time-consuming manipulations, extraction steps, derivatization reactions that are liable to various interferences, and are not appli- cable to colored and turbid solutions either. Potentiometric methods with ion-selective electrodes (ISE’s) have proved to be effective for the analysis of pharmaceutical formulations and biological samples, be- cause these sensors offer the advantages of simple design, construction, and manipulation, reasonable selectivity, fast response time, applicability to colored and turbid solutions and possible interfacing with automated and computerized systems. [15-17]. A number of ISEs based on PVC membrane [10-14], for determination of pethi- dine have been reported. However, these electrodes still have certain inherent limitations. Cleary, there is an ur- gent need for a recipe that would make the fabrication and optimization of potentiometric sensors with low de- tection limit, high stability and reproducibility a straight- forward process. The advantages of carbon paste electrodes, such as che-  H. M. ABU-SHAWISH ET AL. 57 Figure 1. Chemical structure of pethidine hydrochloride. mical inertness, robustness, low cost, renewability, very low background current, stable response, low ohmic re- sistance and no need for internal solution over conven- tional polymeric membrane electrodes has attracted the attention of researchers in recent years [15-18]. After careful review of literature, there is no report on deter- mination of pethidine hydrochloride using a carbon paste electrode. This paper describes the construction, potentiometric characterization, and analytical application of a pethidine- chemically modified carbon paste electrode (D-CMCPE) based on the use of pethidine-phosphotungstate (PD-PT) as electroactive materials and 2-nitrophenyl octyl ether (2-NPOE) as plasticizer. The results presented in this paper show that the sensor constructed for pethidine ion has a wide concentration range, low limit of detection, good Nernstain slope, and high selectivity over a wide variety of other cations and compared with electrodes previously reported [10-14]. 2. Experimental 2.1. Reagents and Solutions Pethidine hydrochloride PDCl was obtained from general administration of pharmacy, ministry of health (Gaza- Palestine). Graphite powder, 2-nitrophenyl octyl ether (2-NPOE), dioctyl phthalate (DOP), dibutyl phthalate (DBP), tris(2-ethylhexyl) phosphate (DOPh), dioctyl sebacate (DOS), tributyl phosphate (TPh), tricresyl phos- phate (TCP) and dibutyl butyl phosphonate (DDBP), as well as metal salts were purchased from Aldrich and used as received. Silicotungstic acid (STA), phospho- tungstic acid (PTA), phosphomolybdic acid (PMA), sili- comolybdic acid (SMA) and sodium tetraphenyl borate (Na-TPB) were obtained from Sigma. 2.2. Apparatus Potentiometric measurements were carried out with a digital millivoltmeter (SR-MUL-3800). pH measurements were made on a digital pH meter (Wissenscha-ftlich-Te- chnische WerkstattenGmbH (WTW)-Germany) at room temperature (25.0˚C ± 1.0˚C). 2.3. Preparation of Ion-Exchanger Complex An ion-exchanger complex was made from pethidine hydrochloride (PD) and one of the following substances: silicotungstic acid (STA), silicomolybdic acid (SMA) phosphotungstic acid (PTA), phosphomolybdic acid (PMA), or sodium tetraphenyl borate (Na-TPB) accord- ing to a previously reported method [19]. This precipi- tated ion-pair was washed, dried and used as the active substances for preparing the chemically modified carbon paste electrodes of pethidine hydrochloride. 2.4. Preparation of the Electrode A Teflon holder (12 cm length) with a hole at one end (7 mm diameter, 3.5 mm deep) for the carbon paste filling served as the electrode body. Electrical contact was made with a stainless steel rod through the centre of the holder. This rod moved up and down by screw movement to press the paste down when renewal of the electrode sur- face was needed. Modified carbon paste was prepared by mixing weighed amounts of PD-PT and high purity graphite. The mixture was homogenized, and then the impregnated carbon powder was added to a weighed amount of 2-nitrophenyl octyl ether (2-NPOE). A very high degree of homogenization is then achieved by care- ful mixing with a glass rod in an agate mortar and sub- sequent thorough crushing with a pestle. The ready-pre- pared paste was then packed into the hole of the elec- trode body. The carbon paste was smoothed onto paper until it had a shiny appearance and was used directly for potentiometric measurements without preconditioning requirements. 2.5. Sample Analysis The standard addition method in which small increments (10 - 100 µl) of (0.1 M) TDCl solution were added to 50 mL aliquot-samples of various concentrations (5.0 × 10⁻⁶ to 1.0 × 10⁻⁵ M) PDCl was applied. The potential after each increment was recorded at 25˚C ± 0.1˚C and used to calculate the concentration of TDCl in the drug samples. The potentiometric titration of different volumes of 1.0 × 10⁻³ M and 1.0 × 10⁻² M PDCl solution: 5 - 10 mL equivalent to 1.42 - 28.4 mg, were transferred to a 25 mL beaker, and titrated with a standard solutions of Na-TPB and PTA using the prepared PD-electrode as indicator electrode. The end points were determined from the S-shaped curve. In the calibration graph method, different amounts of Copyright © 2011 SciRes. AJAC 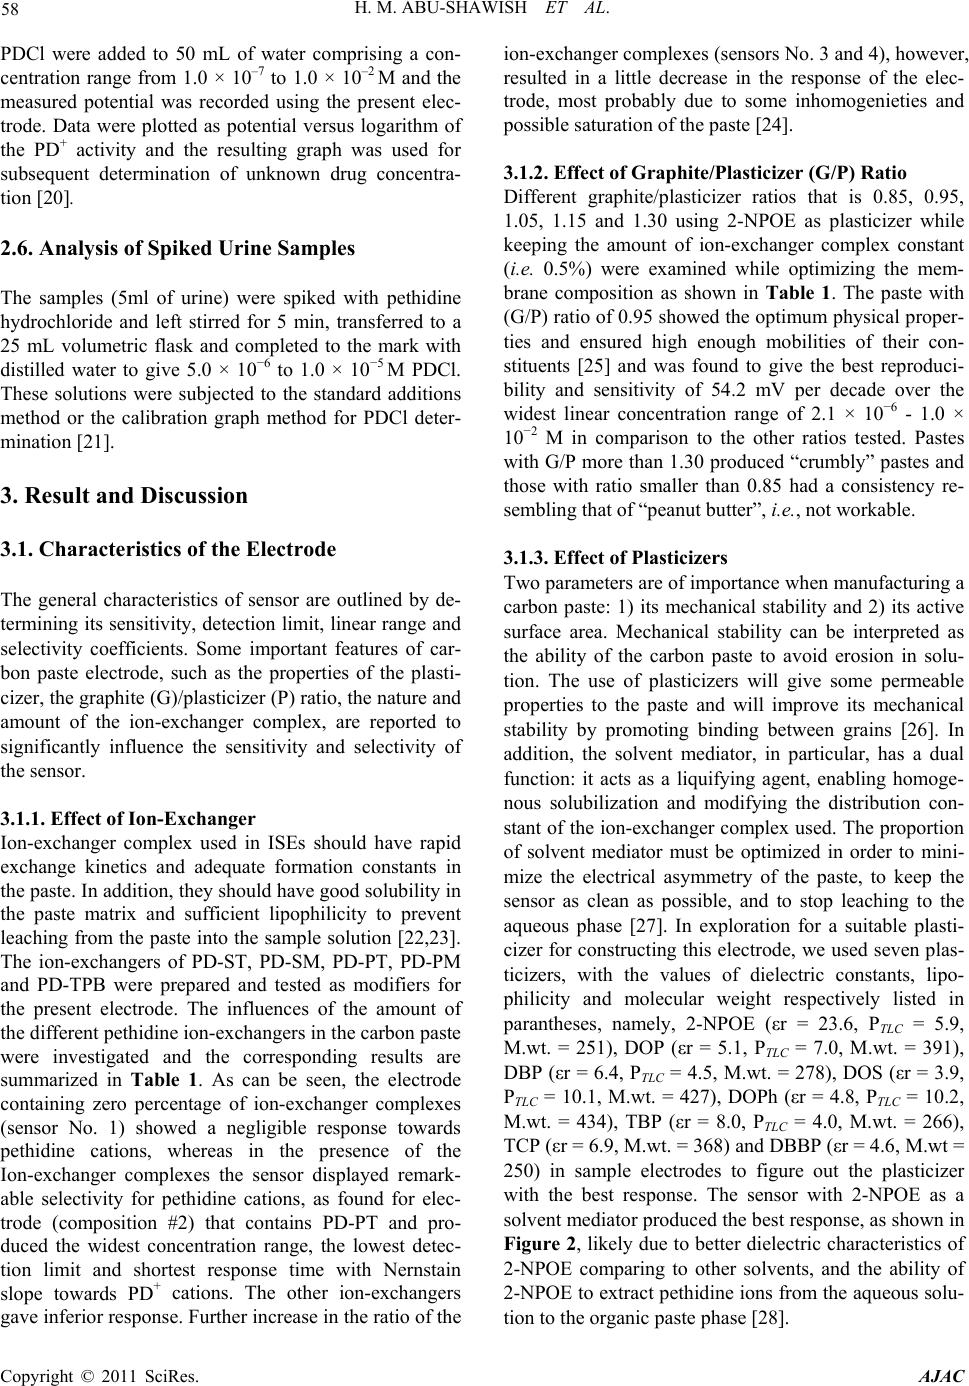 58 H. M. ABU-SHAWISH ET AL. PDCl were added to 50 mL of water comprising a con- centration range from 1.0 × 10⁻⁷ to 1.0 × 10⁻² M and the measured potential was recorded using the present elec- trode. Data were plotted as potential versus logarithm of the PD+ activity and the resulting graph was used for subsequent determination of unknown drug concentra- tion [20]. 2.6. Analysis of Spiked Urine Samples The samples (5ml of urine) were spiked with pethidine hydrochloride and left stirred for 5 min, transferred to a 25 mL volumetric flask and completed to the mark with distilled water to give 5.0 × 10⁻⁶ to 1.0 × 10⁻⁵ M PDCl. These solutions were subjected to the standard additions method or the calibration graph method for PDCl deter- mination [21]. 3. Result and Discussion 3.1. Characteristics of the Electrode The general characteristics of sensor are outlined by de- termining its sensitivity, detection limit, linear range and selectivity coefficients. Some important features of car- bon paste electrode, such as the properties of the plasti- cizer, the graphite (G)/plasticizer (P) ratio, the nature and amount of the ion-exchanger complex, are reported to significantly influence the sensitivity and selectivity of the sensor. 3.1.1. Effect of Ion-Exchanger Ion-exchanger complex used in ISEs should have rapid exchange kinetics and adequate formation constants in the paste. In addition, they should have good solubility in the paste matrix and sufficient lipophilicity to prevent leaching from the paste into the sample solution [22,23]. The ion-exchangers of PD-ST, PD-SM, PD-PT, PD-PM and PD-TPB were prepared and tested as modifiers for the present electrode. The influences of the amount of the different pethidine ion-exchangers in the carbon paste were investigated and the corresponding results are summarized in Table 1. As can be seen, the electrode containing zero percentage of ion-exchanger complexes (sensor No. 1) showed a negligible response towards pethidine cations, whereas in the presence of the Ion-exchanger complexes the sensor displayed remark- able selectivity for pethidine cations, as found for elec- trode (composition #2) that contains PD-PT and pro- duced the widest concentration range, the lowest detec- tion limit and shortest response time with Nernstain slope towards PD+ cations. The other ion-exchangers gave inferior response. Further increase in the ratio of the ion-exchanger complexes (sensors No. 3 and 4), however, resulted in a little decrease in the response of the elec- trode, most probably due to some inhomogenieties and possible saturation of the paste [24]. 3.1.2. Effect of Graphite/Plasticizer (G/P) Ratio Different graphite/plasticizer ratios that is 0.85, 0.95, 1.05, 1.15 and 1.30 using 2-NPOE as plasticizer while keeping the amount of ion-exchanger complex constant (i.e. 0.5%) were examined while optimizing the mem- brane composition as shown in Table 1. The paste with (G/P) ratio of 0.95 showed the optimum physical proper- ties and ensured high enough mobilities of their con- stituents [25] and was found to give the best reproduci- bility and sensitivity of 54.2 mV per decade over the widest linear concentration range of 2.1 × 10⁻⁶ - 1.0 × 10⁻² M in comparison to the other ratios tested. Pastes with G/P more than 1.30 produced “crumbly” pastes and those with ratio smaller than 0.85 had a consistency re- sembling that of “peanut butter”, i.e. , not workable. 3.1.3. E ffect of Plasticizers Two parameters are of importance when manufacturing a carbon paste: 1) its mechanical stability and 2) its active surface area. Mechanical stability can be interpreted as the ability of the carbon paste to avoid erosion in solu- tion. The use of plasticizers will give some permeable properties to the paste and will improve its mechanical stability by promoting binding between grains [26]. In addition, the solvent mediator, in particular, has a dual function: it acts as a liquifying agent, enabling homoge- nous solubilization and modifying the distribution con- stant of the ion-exchanger complex used. The proportion of solvent mediator must be optimized in order to mini- mize the electrical asymmetry of the paste, to keep the sensor as clean as possible, and to stop leaching to the aqueous phase [27]. In exploration for a suitable plasti- cizer for constructing this electrode, we used seven plas- ticizers, with the values of dielectric constants, lipo- philicity and molecular weight respectively listed in parantheses, namely, 2-NPOE (εr = 23.6, PTLC = 5.9, M.wt. = 251), DOP (εr = 5.1, PTLC = 7.0, M.wt. = 391), DBP (εr = 6.4, PTLC = 4.5, M.wt. = 278), DOS (εr = 3.9, PTLC = 10.1, M.wt. = 427), DOPh (εr = 4.8, PTLC = 10.2, M.wt. = 434), TBP (εr = 8.0, PTLC = 4.0, M.wt. = 266), TCP (εr = 6.9, M.wt. = 368) and DBBP (εr = 4.6, M.wt = 250) in sample electrodes to figure out the plasticizer with the best response. The sensor with 2-NPOE as a solvent mediator produced the best response, as shown in Figure 2, likely due to better dielectric characteristics of 2-NPOE comparing to other solvents, and the ability of 2-NPOE to extract pethidine ions from the aqueous solu- tion to the organic paste phase [28]. Copyright © 2011 SciRes. AJAC 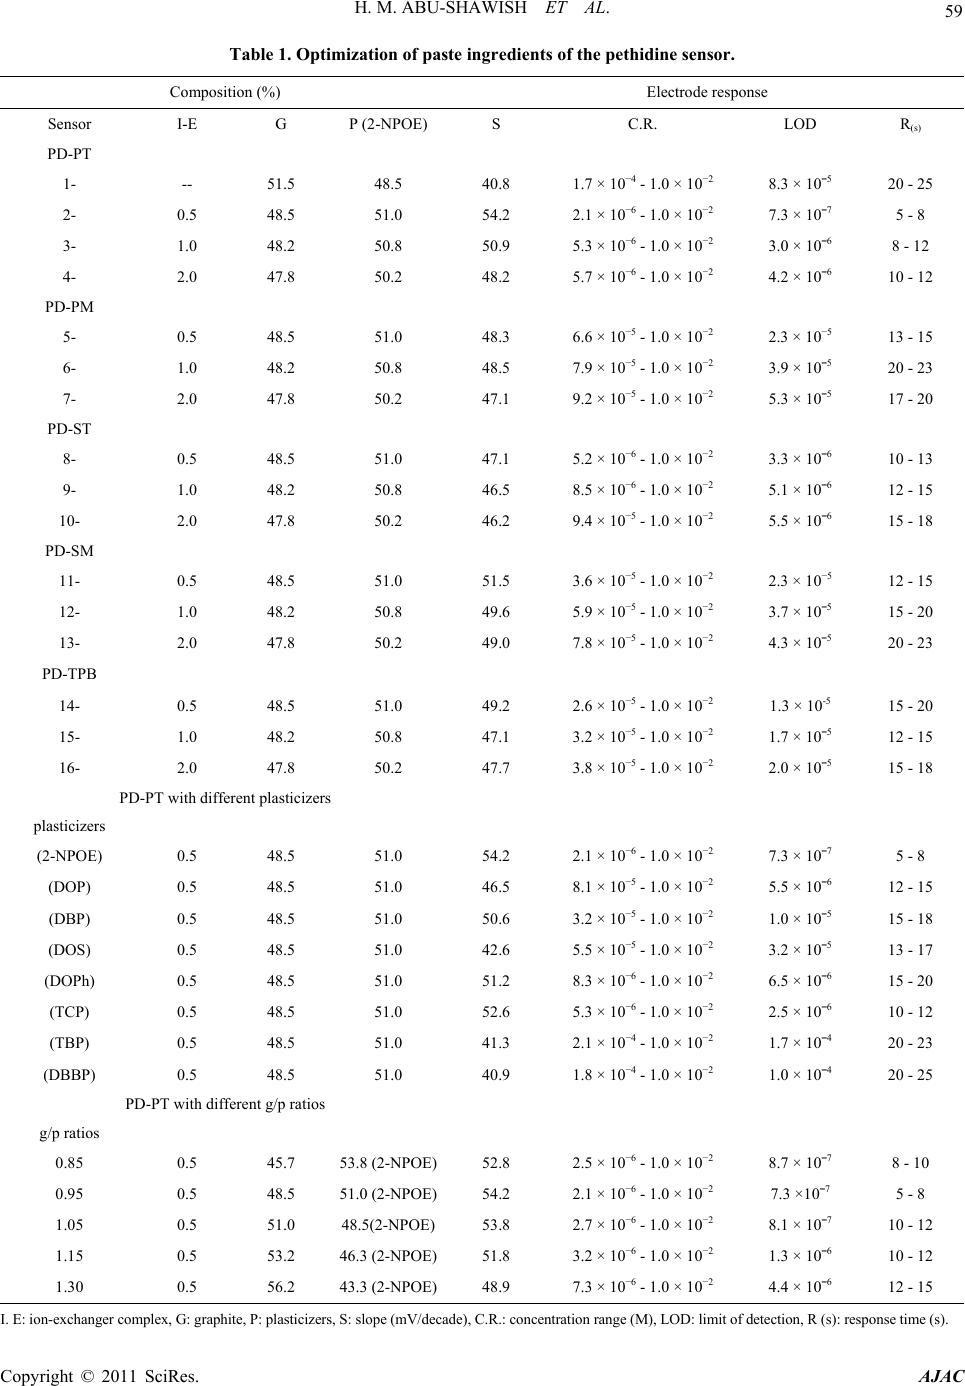 H. M. ABU-SHAWISH ET AL. Copyright © 2011 SciRes. AJAC 59 Table 1. Optimization of paste ingredients of the pethidine sensor. Electrode response Composition (%) R(s) LOD C.R. S P (2-NPOE) G I-E Sensor PD-PT 20 - 25 8.3 × 10¯5 1.7 × 10⁻⁴ - 1.0 × 10⁻² 40.8 48.5 51.5 -- 1- 5 - 8 7.3 × 10¯7 2.1 × 10⁻⁶ - 1.0 × 10⁻² 54.2 51.0 48.5 0.5 2- 8 - 12 3.0 × 10¯6 5.3 × 10⁻⁶ - 1.0 × 10⁻² 50.9 50.8 48.2 1.0 3- 10 - 12 4.2 × 10¯6 5.7 × 10⁻⁶ - 1.0 × 10⁻² 48.2 50.2 47.8 2.0 4- PD-PM 13 - 15 2.3 × 10⁻⁵ 6.6 × 10⁻⁵ - 1.0 × 10⁻² 48.3 51.0 48.5 0.5 5- 20 - 23 3.9 × 10¯5 7.9 × 10⁻⁵ - 1.0 × 10⁻² 48.5 50.8 48.2 1.0 6- 17 - 20 5.3 × 10¯5 9.2 × 10⁻⁵ - 1.0 × 10⁻² 47.1 50.2 47.8 2.0 7- PD-ST 10 - 13 3.3 × 10¯6 5.2 × 10⁻⁶ - 1.0 × 10⁻² 47.1 51.0 48.5 0.5 8- 12 - 15 5.1 × 10¯6 8.5 × 10⁻⁶ - 1.0 × 10⁻² 46.5 50.8 48.2 1.0 9- 15 - 18 5.5 × 10¯6 9.4 × 10⁻⁵ - 1.0 × 10⁻² 46.2 50.2 47.8 2.0 10- PD-SM 12 - 15 2.3 × 10⁻⁵ 3.6 × 10⁻⁵ - 1.0 × 10⁻² 51.5 51.0 48.5 0.5 11- 15 - 20 3.7 × 10¯5 5.9 × 10⁻⁵ - 1.0 × 10⁻² 49.6 50.8 48.2 1.0 12- 20 - 23 4.3 × 10¯5 7.8 × 10⁻⁵ - 1.0 × 10⁻² 49.0 50.2 47.8 2.0 13- PD-TPB 15 - 20 1.3 × 10⁻⁵ 2.6 × 10⁻⁵ - 1.0 × 10⁻² 49.2 51.0 48.5 0.5 14- 12 - 15 1.7 × 10¯5 3.2 × 10⁻⁵ - 1.0 × 10⁻² 47.1 50.8 48.2 1.0 15- 15 - 18 2.0 × 10¯5 3.8 × 10⁻⁵ - 1.0 × 10⁻² 47.7 50.2 47.8 2.0 16- PD-PT with different plasticizers plasticizers 5 - 8 7.3 × 10¯7 2.1 × 10⁻⁶ - 1.0 × 10⁻² 54.2 51.0 48.5 0.5 (2-NPOE) 12 - 15 5.5 × 10¯6 8.1 × 10⁻⁵ - 1.0 × 10⁻² 46.5 51.0 48.5 0.5 (DOP) 15 - 18 1.0 × 10¯5 3.2 × 10⁻⁵ - 1.0 × 10⁻² 50.6 51.0 48.5 0.5 (DBP) 13 - 17 3.2 × 10¯5 5.5 × 10⁻⁵ - 1.0 × 10⁻² 42.6 51.0 48.5 0.5 (DOS) 15 - 20 6.5 × 10¯6 8.3 × 10⁻⁶ - 1.0 × 10⁻² 51.2 51.0 48.5 0.5 (DOPh) 10 - 12 2.5 × 10¯6 5.3 × 10⁻⁶ - 1.0 × 10⁻² 52.6 51.0 48.5 0.5 (TCP) 20 - 23 1.7 × 10¯4 2.1 × 10⁻⁴ - 1.0 × 10⁻² 41.3 51.0 48.5 0.5 (TBP) 20 - 25 1.0 × 10¯4 1.8 × 10⁻⁴ - 1.0 × 10⁻² 40.9 51.0 48.5 0.5 (DBBP) PD-PT with different g/p ratios g/p ratios 8 - 10 8.7 × 10¯7 2.5 × 10⁻⁶ - 1.0 × 10⁻² 52.8 53.8 (2-NPOE)45.7 0.5 0.85 5 - 8 7.3 ×10¯7 2.1 × 10⁻⁶ - 1.0 × 10⁻² 54.2 51.0 (2-NPOE)48.5 0.5 0.95 10 - 12 8.1 × 10¯7 2.7 × 10⁻⁶ - 1.0 × 10⁻² 53.8 48.5(2-NPOE)51.0 0.5 1.05 10 - 12 1.3 × 10¯6 3.2 × 10⁻⁶ - 1.0 × 10⁻² 51.8 46.3 (2-NPOE)53.2 0.5 1.15 12 - 15 4.4 × 10¯6 7.3 × 10⁻⁶ - 1.0 × 10⁻² 48.9 43.3 (2-NPOE)56.2 0.5 1.30 I. E: ion-exchanger complex, G: graphite, P: plasticizers, S: slope (mV/decade), C.R.: concentration range (M), LOD: limit of detection, R (s): response time (s).  H. M. ABU-SHAWISH ET AL. Copyright © 2011 SciRes. AJAC 60 Figure 2. Effect of different plasticizers on the response of PD-CMCPE. Among the different compositions studied, a paste containing ion-exchanger complex 0.5 wt% PD-PT , 48.5 wt% graphite, 51.0 wt% 2-NPOE exhibited the best re- sponse characteristics and the lowest detection limit. Therefore, this composition was used to study various operation parameters of the electrodes. The electro- chemical performance characteristics of this electrode were systematically evaluated according to the IUPAC recommendations [29]. 3.2. Surface-Renewal and Reproducibility of the Electrode The main attraction of using the modified electrode is that the electrode surface can be renewed after every use. The bulk modified electrode can be renewed by squeez- ing a little carbon paste out of the tube and a fresh sur- face is smoothed on a piece of weighing paper whenever needed [30]. Accordingly, a paste of optimum composi- tion and suitable weight (1.5 g) can be used for several months without any deterioration or change in the re- sponse of the electrode. The slope of the calibration graph was found to decrease slightly from 54.4 to 50.8 mV/decade after three times of use. This decrease may be attributed to memory effect due to the surface con- tamination [31]. In this case, the electrode surface should be renewed. The repeatability of the potential reading of the electrode was examined by subsequent measurements of 1 × 10⁻⁴ M PDCl solution immediately after measur- ing the first set of solutions at 1.0 × 10⁻³ M PDCl. The standard deviation of measuring emf for 5 replicate measurements was found to be 1.127 for 1.0 × 10⁻⁴ M solution and 0.747 for 1.0 × 10⁻³ M solution. 3.3. Response Time and Reversibility of the Electrode For analytical applications, dynamic response time is a significant parameter for any sensor. The response time of the electrode is defined as the time between addition of the analyte to the sample solution and the time when a limiting potential has been reached [29]. In this work, the response time of the electrode was measured by varying the pethidine concentration over the range 1.0 × 10⁻⁵ to 1.0 × 10⁻² M. The electrode reaches equilibrium in about 5 - 8 s. As shown in Figure 3. To evaluate the reversibility of the electrode, the potential measurements were performed in the sequence high-to- low (from 1.0 × 10⁻² to 1.0 × 10⁻⁵ M) sample concentra- tions. Figure 3 showed that the response of the electrode was reversible; although the time needed to reach equi- librium values (12 s) was longer than that for low-to-high sample concentrations. 3.4. Effect of Diverse Ions The separate solution method (SSM) is recommended by IUPAC to determine the selectivity coefficient of the ISE [32]. SSM is based on Nickolsky-Eisenman equation. However, it has been shown that this method suffers some limitations in terms of the values for ions of un- equal charges, a non-Nernstain behavior of interfering ions [33]. Therefore another method named the “matched potential method (MPM)” was recommended [32] espe- cially when the primary ion and/or the interfering ion dissatisfy with the Nernst response or when the involved ions have unequal charges [34]. The resulting values, presented in Table 2, show that the electrode display significantly high selectivity for pethidine over many common organic and inorganic compounds, drugs, sug- ars, amino acids as well as some anions. In pharmaceuti- cal analysis, it is important to test the selectivity towards  H. M. ABU-SHAWISH ET AL. 61 Figure 3. Dynamic response of sensor A for step changes in concentration of pethidine hydrochloride (from low to high and vice versa). Table 2. Selectivity coefficients of various interfering ions for PD-CMCPE. MPM SSM Interfering ions 8.41 × 10¯5 1.41 × 10¯4 NH+ 1.18 × 10¯5 9.52 × 10¯5 Na+ 1.20 × 10¯4 2.71 × 10¯4 K+ 1.66 × 10¯4 4.34 × 10¯4 Li+ 8.34 × 10¯6 5.69 × 10¯4 Cd2+ 7.81 × 10¯6 1.94 × 10¯4 Mg2+ 2.10 × 10¯5 1.13 × 10¯4 Ca2+ 2.02 × 10¯5 8.02 × 10¯4 Ba2+ 5.11 × 10¯5 2.73 × 10¯4 Zn2+ 3.85 × 10¯5 1.19 × 10¯4 Co2+ 7.73 × 10¯5 6.98 × 10¯4 Al3+ 4.30 × 10¯5 1.86 × 10¯4 Ce3+ 4.86 × 10¯2 2.53 × 10¯2 Diclofenac sodium 4.86 × 10¯2 3.41 × 10¯2 Spiramycine 2.47 × 10¯2 2.93 × 10¯2 Spectinomycine Hcl 2.45 × 10¯2 6.76 × 10¯2 Captopril 8.89 × 10¯³ 1.27 × 10¯2 Ephidrine 4.86 × 10¯2 1.27 × 10¯1 Lidocaine 9.14 × 10¯7 - D-Fractose 1.35 × 10¯6 - D- Galactose 5.54 × 10¯6 - Maltose 8.04 × 10¯6 - Sucrose 2.47 × 10¯6 - Glucose the excipients such as such as lactose, glucose, sucrose, starch, stearic acid, magnesium stearate and microcrys- talline cellulose and the fillers added to the pharmaceu- tical preparations. The interference of some of these ex- cipients was explored and measured. It is found that they cause minor effect on the function of the electrode as shown in Table 2. 3.5. Effect of Temperature To study the thermal stability of the sensor, calibration graphs were constructed at different test solution tem- peratures 20, 30, 40, 50 and 60˚C. From these graphs the electrode potentials at pPD = 0 were obtained and plotted versus (t−25), where t is the temperature of the experi- ment. A straight line plot was obtained for each electrode with slope represents the thermal coefficient value (dE/dt) of the electrode [35]. The value (dE/dt) of the electrode was found to be 0.00071 V/˚C. This indicates fairly high thermal stability of the electrode within the investigated temperature range and shows no deviation from the theoretical Nernstian behavior. 3.6. Effect of pH The pH dependence of the potentials of the proposed electrode was tested over the pH range 2.2 - 10.0 for 1.0 × 10¯5 and 1.0 × 10¯4 M PDCl solutions. The acidity was adjusted by adding small volumes of (1.0 M HCl or NaOH) to the test solutions and the variation in potential was followed. As it can be seen in Figure 4, the potential response remains almost constant over the pH range 2.7 - 6.8 which can be taken as the working pH range of the electrode. However, there is a slight deviation at pH val- ues lower than 2.7 which may be due to H+ interference. On the other hand, the potential decreases gradually at pH values higher than 6.8. This drop may be attributed to formation of free pethidine base in the test solution. 4. Applications 4.1. Titration of Pethidine Solution with a Standard PTA and Na-TPB Solution The PD-CMCPE was successfully used as an indicator electrode in the potentiometric titration of 5 ml of 0.01 M (14.2 mg) of pethidine hydrochloride with a standard solution of Na-TPB and PTA solution. The method for pethidine ion (PD ) titration is based on the decrease of (PD ) concentration by precipitation with PTA and Na-TPB standard solution. As is obvious from Figure 5, Copyright © 2011 SciRes. AJAC  62 H. M. ABU-SHAWISH ET AL. Figure 4. Effect of pH of the test solution on the potential response of PD-CMCPE. Figure 5. Potentiometric titration of 14.2 mg PDCl with Na-TPB (a) and PTA (b) as titrants using PD-CMCPE. the amount of pethidine can be accurately determined from the end point of the titration curve. 4.2. Determination of Pethidine in Ampoules The standard additions and calibration methods were applied for determination PDCl content in ampoule sam- ples as can be seen in Table 3, the recovery of PDCl is almost quantitative. 4.3. Recovery and Determination of Pethidine Ions in Urine Recovery experiments were conducted by spiking urine samples with appropriate amounts of pethidine ions, and determined by this electrode using the standard addition method and calibration curve. The results shown in Ta- ble 3. Recoveries and R.S.D. values range between 96.6% and 103.0% of pethidine, and 0.27 to 1.33, re- spectively. It is noted that accurate and reproducible re- sults Thus the sensor can be employed for quantification of pethidine in urine samples. 5. Comparison of the Pethidine Selective Electrodes The performance characteristics of the proposed elec- trode and those of some reported carbon paste electrodes are presented in Table 4 for comparison. It is clear that the proposed electrode is comparable with most of the reported electrodes with regard to working concentration range, response time and low detection limit. Overall evaluation indicates this electrode is more useful in such applications. 6. Conclusions The proposed chemically modified carbon paste elec- trode based on pethidine phosphotungstate as an electro- active ion exchanger complex might be a useful analyti- cal tool and interesting alternative for the determination of PD ions in pharmaceutical preparations and urine samples. The electrode shows high sensitivity, reason- able selectivity, fast static response, long term stability and applicability over a wide concentration range with minimal sample pretreatment. The electrode developed is superior as compared with the pethidine selective elec- trode described in the literature [10-14]. 7. Acknowledgements The authors would like to thank Dr Muneer A. Alboursh and Dr Amal Zendah (general administration of phar- macy, Ministry of Health, Gaza-Palestine), Dr. Aleksan- dar Radu, Adaptive Sensors Group, National Centre for Sensor Research, School of Chemical Sciences, Dublin City University, Dublin 9, Ireland, Prof. Yousry M. Issa and Prof. Hosny Ibrahim (Cairo University-Egypt) Copyright © 2011 SciRes. AJAC  H. M. ABU-SHAWISH ET AL. Copyright © 2011 SciRes. AJAC 63 Table 3. Results for determination of PDCl in ampoules and urine samples using PD-CMCPE. Standard error RSDb % Recovery % PD/mga Method* Sample Ampoule 0.025 0.85 96.8 0.0248 SDM 0.032 0.48 97.8 0.248 0.054 0.35 101.5 0.0355 CCM 0.033 0.27 100.8 0.355 Urine 0.021 0.74 96.6 0.0248 SDM 0.017 1.02 97.8 0.248 0.051 1.33 101.5 0.0355 CCM 0.041 1.08 100.8 0.355 PTM using Na-TPB and PTA as a titrant 0.026 0.72 100.5 1.42 Na-TPB 0.022 0.29 100.0 14.2 0.019 0.36 101.2 1.42 PTA 0.047 0.44 103.0 14.2 aMilligrams taken of PDCl in ampoules or spiked to urine samples, bAverage of three determinations, Methods* (used in analytical appli- cations) SDM: standard additions method, CCM: calibration curve method, PTM: potentiometric titration method. Table 4. Comparison of the proposed pethidine sensor wi th published sensors. R(s) LOD C. R S Reference 10 3.3 × 10⁻⁶ 1.0 × 10⁻⁵ - 1.0 × 10⁻² 55.3 [10] < 30 9.9 × 10⁻⁷ 1.0 × 10⁻⁵ - 1.0 × 10⁻² 53.7 [11] < 30 2.2 × 10⁻⁶ 1.0 × 10⁻⁵ - 1.0 × 10⁻² 51.8 [12] < 30 8.2 × 10⁻⁷ 5.0 × 10⁻⁶ - 1.0 × 10⁻² 56.7 [13] 30 4.4 × 10⁻⁶ 1.0 × 10⁻⁵ - 1.0 × 10⁻³ 53.5 [14] 5 - 8 7.3 × 10⁻⁷ 2.1 × 10⁻⁶ - 1.0 × 10⁻² 54.2 Present work C.R.: concentration range (M), LOD: limit of detection, S: slope (mV/decade), R(s): response time. for encouragement, support and providing facilities for research. 8. References [1] S. White and S. H. Y. Wong, “Guidelines for Therapeutic Drug Monitoring Services,” In: A. Warner and T. An- nesley, Eds., The National Academy of Clinical Biochem- istry, Washington, 1999, pp. 63-73. [2] P. A. Greenwood, C. Merrin, T. McCreedy and G. M. Greenway, “Chemiluminescence μTAS for the Determi- nation of Atropine and Pethidine,” Talanta, Vol. 56, No. 3, 2002, pp. 539-545. [3] B. Han, Y. Du and E. Wang, “Simultaneous Determina- tion of Pethidine and Methadone by Capillary Electro- phoresis with Electrochemiluminescence Detection of Tris(2,2’-bipyridyl)ruthenium(II),” Microchemical Jour- nal, Vol. 89, No. 2, 2008, pp. 137-141. [4] T. G. Venkateshwaran, J. T. Stewart and D. T. King, “HPLC Determination of Morphine-Ondansetron and Meperidine-Ondansetron Mixture in 0.9% Sodium Chlo- ride Injection,” Journal of Liquid Chromatography & Related Technologies, Vol. 19, No. 8, 1996, pp. 1329-1338. [5] C. R. Meatherall, D. R. P. Guay and R. P. Dvid, “Analy- sis of Meperidine and Normeperidine in Serum and Urine by High-Performance Liquid Chromatography,” Journal of Liquid Chromatography, Vol. 338, 1985, pp. 141-149.  64 H. M. ABU-SHAWISH ET AL. [6] S. W. Myung, S. Kim, J. H. Park, M. Kim, J. C. Lee and T. J. Kim, “Solid-Phase Microextraction for the Deter- mination of Pethidine and Methadone in Human Urine Using Gas Chromatography with Nitrogen-Phosphorus Detection,” Analyst, Vol. 124, No. 9, 1999, pp. 1283-1286. [7] F. Liu, X. Y. Hu and Y. Luo, “Investigation of Meperidine and Its Metabolites in Urine of an Addict by Gas Chromatography-Flameionization Detection And Gas Chromatography-Mass Spectrometry,” Journal of Chromatography B: Biomedical Sciences and Applica- tions, Vol. 658, 1994, pp. 375-379. [8] A. Ishii, M. Tanaka, R. Kurihara, K. Watanabe-Suzuki, T. Kumazawa, H. Seno, O. Suzuki and Y. Katsumata, “Sen- sitive Determination of Pethidine in Body Fluids by Gas Chromatography-Tandem Mass Spectrometry,” Journal of Chromatography B, Vol. 792, 2003, pp. 117-121. [9] H. Farsam and M. R. Nadjari-Moghaddam, “Spectropho- tometric Determination of Meperidine Hydrochloride in Pharmaceutical Preparations by Complexation with Bro- mocresol Green,” Journal of Pharmaceutical and Bio- medical Analysis, Vol. 2, 1984, pp. 543-547 [10] A. Shalaby, M. El-Tohamy, M. El-Maamly and H. Y. Aboul-Enein, “Potentiometric Membrane Sensor for the Selective Determination of Pethidine in Pharmaceutical Preparations and Biological Fluids,” Annali di Chimica, Vol. 97, No. 10, 2007, pp. 1065-1074. [11] Z. H. Liu, M. L. Wen and J. Xiong, “A Pethidine Selec- tive Polymeric Membrane Electrode Based on Pethidine- Silicotungstate,” Analytical Sciences, Vol. 16, No. 8, 2000, pp. 885-887. [12] Z. H. Liu, M. L. Wen and J. Xiong, “Plastic Membrane Electrode for the Potentiometric Determination of Pethi- Dine Hydrochloride in Pharmaceutical Preparations,” Fresenius Journal of Analytical Chemistry, Vol. 368, No. 4, 2000, pp. 335-337. [13] Z. H. Liu, M. L. Wen, Y. Yao and J. Xiong, “Plastic Pethidine Hydrochloride Membrane Sensor and Its Phar- maceutical Applications,” Sensors and Actuators B, Vol. 72, 2001, pp. 219-223. [14] Z. H. Liu, M. L. Wen, Y. Yao and J. Xiong, “A Pethidine Selective Polymeric Membrane Electrode,” Boletin de la Sociedad Chilena de Quimica, Vol. 47, No. 2, 2002, pp. 163-168. [15] H. Ibrahim, Y. M. Issa and H. M. Abu-Shawish, “Chemi- cally Modified Carbon Paste Electrode of Dicyclomine Hydrochloride in Batch and in FIA Conditions,” Analyti- cal Sciences, Vol. 20, No. 5, 2004, pp. 911-916. [16] A. O. Santini, H. R. Pezza, J. E. de Oliveira and L. Pezza, “Development of a Potentiometric Flufenamate ISE and its Application to Pharmaceutical and Clinical Analyses,” Journal of the Brazilian Chemical Society, Vol. 19, No. 1, 2008. pp. 162-168. [17] Y. M. Issa, H. Ibrahim and H. M. Abu-Shawish, “Carbon Paste Electrode for the Potentiometric Flow Injection Analysis of Drotaverine Hydrochloride in Serum and Urine,” Microchim Acta, Vol. 150, No. 1, 2005, pp. 47-54. [18] H. M. Abu-Shawish, “Potentiometric Response of Modi- fied Carbon Paste Electrode Based on Mixed Ion-Ex- changers,” Electroanalysis, Vol. 20, No. 5, 2008, pp. 491-497. [19] H. Ibrahim, Y. M. Issa and H. M. Abu-Shawish, “Poten- tiometric Flow Injection Analysis of Mebeverine Hydro- chloride in Serum and Urine,” Journal of Pharmaceutical and Biomedical Analysis, Vol. 36, No. 5, 2005, pp. 1053-1061. [20] G. A. E. Mostafa, “Development and Characterization of Ion Selective Electrode for the Assay of Antimony,” Ta- lanta, Vol. 71, No. 4, 2007, pp. 1449-1454. [21] H. Ibrahim, Y. M. Issa and H. M. Abu-Shawish, “Poten- tiometric Flow Injection Analysis of Dicyclomine Hy- drochloride in Serum, Urine and Milk,” Analytica Chimica Acta, Vol. 532, No. 1, 2005, pp. 79-88. [22] V. S. Bhat, V. S. Ijeri and K. A. Srivastava, “Coated Wire Lead(II) Selective Potentiometric Sensor Based on 4-tert- butylcalix[6]arene,” Sensors and Actuators B, Vol. 99, No. 1, 2004, pp. 98-105. [23] H. M. Abu-Shawish, S. M. Saadeh, K. Hartani and H. M. Dalloul, “A Comparative Study of Chromium(III) Ion- Selective Electrodes Based on N,N-Bis(salicylidene)-o- phenylenediaminatechromium(III),” Journal of the Iranian Chemical Society, Vol. 6, No. 4, 2009, pp. 729-737. [24] M. Arvand and S. A. Asadollahzadeh, “Ion-Selective Electrode for Aluminum Determination in Pharmaceuti- cal Substances, Tea Leaves and Water Samples,” Talanta, Vol. 75, No. 4, 2008, pp. 1046-1054. [25] M. Shamsipur, M. Yousefi, M. Hosseini and M. R. Gan- jali, “Lanthanum(III) PVC Membrane Electrodes Based on 1,3,5-trithiacyclohexane,” Analytical Chemistry, Vol. 74, No. 21, 2002, pp. 5538-5543. [26] E. A. Cummings, P. Mailley, S. Linquette-Mailley, B. R. Eggins, E. T. McAdams and S. McFadden, “Amperomet- ric Carbon Paste Biosensor Based on Plant Tissue for the Determination of Total Flavanol Content in Beers,” Ana- lyst, Vol. 123, No. 10, 1998, pp. 1975-1980. [27] J. S´anchez and M. Valle, “Determination of Anionic Surfactants Employing Potentiometric Sensors-A re- view,” Critical Reviews in Analytical Chemistry, Vol. 35, No. 1, 2005, pp. 15-29. [28] X. B. Zhang, Z. X. Han, Z. H. Fang, G. L. Shen and R. Q. Yu, “5,10,15-Tris(pentafluorophenyl)corrole as Highly Selective Neutral Carrier for a Silver Ion-Sensitive Elec- trode,” Analytica Chimica Acta, Vol. 562, No. 2, 2006, pp. 210-215. [29] P. R. Buck and E. Lindner, “IUPAC Recommendation for Nomenclature of Ion-Selective Electrodes,” Pure and Applied Chemistry, Vol. 66, No. 12, 1994, pp. 2527- 2536. [30] H. M. Abu-Shawish, S. M. Saadeh and A. R. Hussien, “Enhanced Sensitivity for Cu(II) by a Sali- cylidine-Functionalized Polysiloxane Carbon Paste Elec- trode,” Talanta, Vol. 76, No. 3, 2008, pp. 941-948. [31] H. M. Abu-Shawish, “A Mercury(II) Selective Sensor based on N,N’-bis(salicylaldehyde)-phenylenediamine as Neutral Carrier for Potentiometric Analysis in Water Copyright © 2011 SciRes. AJAC  H. M. ABU-SHAWISH ET AL. Copyright © 2011 SciRes. AJAC 65 Samples,” Journal of Hazardous Materials, Vol. 167, No. 1-3, 2009, pp. 602-608. [32] Y. Umezawa, P. Buhlmann, K. Umezawa, K. Tohda and S. Amemiya, “Potentiometric Selectivity Coefficients of Ion-Selective Electrodes,” Pure and Applied Chemistry, Vol. 72, No. 10, 2000, pp. 1851-2082. [33] S. Chandra, H. Agarwal and C.K. Singh, “A highly Se- lective and Sensitive Thorium(IV) PVC Membrane Elec- trode Based on a Dithio-Tetraaza Macrocyclic Com- pound,” Analytical Sciences, Vol. 23, No. 4, 2007, pp. 469-473. [34] H. X. Wang and M. Pu, “A Method of Determining Se- lectivity Coefficients Based on the Practical Slope of Ion Selective Electrodes,” Chinese Chemical Letters, Vol. 13, No. 4, 2002, pp. 355-358. [35] M. Arvand, M. Vejdani and M. Moghimi, “Construction and Performance Characterization of an Ion Selective Electrode for Potentiometric Determination of Atenolol in Pharmaceutical Preparations,” Desalination, Vol. 225, No. 1-3, 2008, pp. 176-184. |