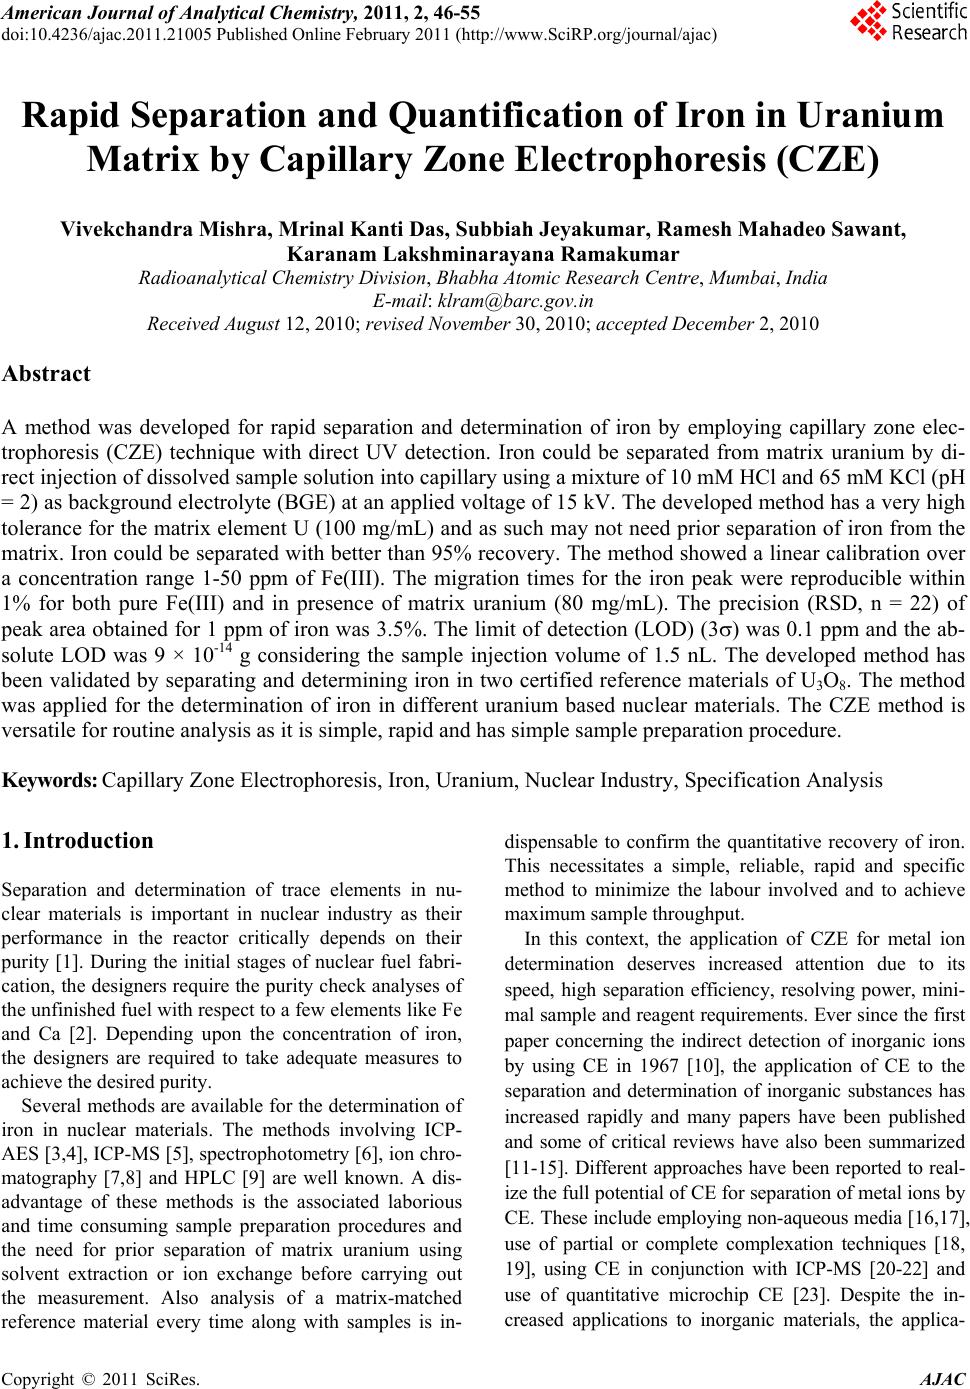
 American Journal of Analyt ical Chemistry, 2011, 2, 46-55 doi:10.4236/ajac.2011.21005 Published Online February 2011 (http://www.SciRP.org/journal/ajac) Copyright © 2011 SciRes. AJAC Rapid Separation and Quantification of Iron in Uranium Matrix by Capillary Zone Electrophoresis (CZE) Vivekchandra Mishra, Mrinal Kanti Das, Subbiah Jeyakumar, Ramesh Mahadeo Sawant, Karanam Lakshminarayana Ramakumar Radioanalytical Chemistry Division, Bhabha Atomic Resea rch Centre, Mumbai, India E-mail: klram@barc.gov.in Received August 12, 2010; revised November 30, 2010; accepted December 2, 2010 Abstract A method was developed for rapid separation and determination of iron by employing capillary zone elec- trophoresis (CZE) technique with direct UV detection. Iron could be separated from matrix uranium by di- rect injection of dissolved sample solution into capillary using a mixture of 10 mM HCl and 65 mM KCl (pH = 2) as background electrolyte (BGE) at an applied voltage of 15 kV. The developed method has a very high tolerance for the matrix element U (100 mg/mL) and as such may not need prior separation of iron from the matrix. Iron could be separated with better than 95% recovery. The method showed a linear calibration over a concentration range 1-50 ppm of Fe(III). The migration times for the iron peak were reproducible within 1% for both pure Fe(III) and in presence of matrix uranium (80 mg/mL). The precision (RSD, n = 22) of peak area obtained for 1 ppm of iron was 3.5%. The limit of detection (LOD) (3) was 0.1 ppm and the ab- solute LOD was 9 × 10-14 g considering the sample injection volume of 1.5 nL. The developed method has been validated by separating and determining iron in two certified reference materials of U3O8. The method was applied for the determination of iron in different uranium based nuclear materials. The CZE method is versatile for routine analysis as it is simple, rapid and has simple sample preparation procedure. Keywords: Capillary Zone Electrophoresis, Iron, Uranium, Nuclear Industry, Specification Analysis 1. Introduction Separation and determination of trace elements in nu- clear materials is important in nuclear industry as their performance in the reactor critically depends on their purity [1]. During the initial stages of nuclear fuel fabri- cation, the designers require the purity check analyses of the unfinished fuel with respect to a few elements like Fe and Ca [2]. Depending upon the concentration of iron, the designers are required to take adequate measures to achieve the desired purity. Several methods are available for the determination of iron in nuclear materials. The methods involving ICP- AES [3,4], ICP-MS [5], spectrophotometry [6], ion chro- matography [7,8] and HPLC [9] are well known. A dis- advantage of these methods is the associated laborious and time consuming sample preparation procedures and the need for prior separation of matrix uranium using solvent extraction or ion exchange before carrying out the measurement. Also analysis of a matrix-matched reference material every time along with samples is in- dispensable to confirm the quantitative recovery of iron. This necessitates a simple, reliable, rapid and specific method to minimize the labour involved and to achieve maximum sample throughput. In this context, the application of CZE for metal ion determination deserves increased attention due to its speed, high separation efficiency, resolving power, mini- mal sample and reagent requirements. Ever since the first paper concerning the indirect detection of inorganic ions by using CE in 1967 [10], the application of CE to the separation and determination of inorganic substances has increased rapidly and many papers have been published and some of critical reviews have also been summarized [11-15]. Different approaches have been reported to real- ize the full potential of CE for separation of metal ions by CE. These include employing non-aqueous media [16,17], use of partial or complete complexation techniques [18, 19], using CE in conjunction with ICP-MS [20-22] and use of quantitative microchip CE [23]. Despite the in- creased applications to inorganic materials, the applica-  V. MISHRA ET AL. 47 tion of CE in nuclear industry has been somewhat limited [24,25]. The separation principle of CE is based on the differ- ential electrophoretic mobility of charged compounds. The differences in the mobility of the analytes are related, in turn, to their charge densities, i.e., the charge-to-mass ratio. One of the problems in the analysis of metal ions by CE is that most of transition metal cations have al- most the same mobility due to their similar size and identical charge. Obviously, the enhancement of separa- tion selectivity is the only alternative to achieve a satis- factory resolution. Generally, there are two main ap- proaches in this direction that imply the addition of a complexing ligand to either the carrier electrolyte or a sample solution before introduction into the capillary [26]. In the first case, the mobility of sample cations to- ward the cathode can be selectively moderated due to the partial complexation within the capillary, followed by the formation of metal complexes of different stability and thereby effective charge [27,28]. The second ap- proach provides the complete pre-capillary or on- capil- lary conversion of metal ions into stable, charged com- plexes, which can move with different mobilities de- pending on their charge, size and stability [29]. The latter approach was exploited in the present investigation. Several CZE methods have been reported for the de- termination of iron in various matrices like water, elec- troplating baths and cyanide complexes [30-34]. CZE separation of Fe(II) and Fe(III) was demonstrated after complexing with o-phenanthroline and EDTA respec- tively and the same indicates separation feasibility of Fe(III) as its EDTA complex [35]. Another study reports the separation of Fe(III) as its DTPA complex [36]. In these reported methods, for the determination of either total iron or speciation, Fe-aminocarboxylic acid anionic complex was separated from other metal-aminocarbo- xylic acid anionic complexes. It would be difficult to apply these methods directly for the nuclear materials like uranium compounds because U(VI) also forms ani- onic complex with aminocarboxylic acids. Between the aminocarboxylic acid complexes of U(VI) and Fe(III), the net negative charge of the U(VI) complex is more than that of the Fe(III)-complex (eg. Fe(III) [33] and U(VI) [37] with EDTA form Fe-EDTA- and UO2-EDTA2- respectively). Due to the higher charge on the uranyl complex, the migration order follows uranium and then iron and large amount of uranium in the sample solution produces a bulk and long tailing peak, possibly masking the iron peak or affecting its recovery. It is worth mentioning that while separating the metal-ami- nocarboxylic acid anionic complexes, it would be diffi- cult to achieve a large separation factor to overcome the problem of peak masking. Moreover, in these methods higher pH electrolyte media (typically pH 6-10) are used for the effective coating of CTAB on the capillary sur- face and subsequent formation of double layer necessary for reversing the EOF. Under such pH conditions, the bulk uranium will undergo hydrolysis significantly and severely obstruct the movements of ions inside the capil- lary path. This is because unlike the hydroxycarboxylic acids, the aminocarboxylic acids cannot prevent the hy- drolysis of metals at higher pH. Moreover, the pH of the sample cannot be kept low (pH < 3) as effective com- plexation does not occur between metal and aminocar- boxylic acids. The aim of the work was to develop a method for the separation and quantification of iron from uranium. As direct injection of the sample solution into capillary is envisaged, significant reduction in analysis time is possi- ble which is desirable during process control operations. At the same time, interferences from other metal cations can be eliminated due to the anionic complex formation with chloride ligand. 2. Experimental 2.1. Instrumentation Separations were performed on a commercial capillary electrophoresis apparatus (Prince Technologies, CEC-770, Netherlands) equipped with a photodiode array detector. Fused silica capillaries of 50 µm i.d. and 60 cm long were used. A capillary having 75 µm i.d. and 60 cm long was also used. Sample injection was done in hydrody- namic mode by the application of 50 mbar pressure for 0.2 min on the sample vial which corresponds to a sam- ple volume of 1.5 nL. System DAX software was used for data acquisition. Direct UV detection was performed at 214 nm. All the experiments were conducted at room temperature (25-27˚C). The pH measurements were done with a pH meter (Eutech, Tutor-model, Malaysia). 2.2. Reagents and Solutions Standard stock solution of Fe(III) was prepared by dis- solving Fe(NO3)3•9H2O (99.99%, Aldrich Chemicals, USA) in 0.01N HNO3. Subsequently, the working stan- dards were made from the stock by appropriate dilutions. High purity HCl and HNO3 acids (suprapure, MERCK, Germany) were used for the sample and electrolyte preparations. Potassium chloride (GR grade, MERCK, Germany) was used. Nuclear grade UO2 (NFC, India) was used for the preparation of standard uranium solu- tion and the concentration of U was obtained from biam- perometric determination [38]. All solutions, electrolytes Copyright © 2011 SciRes. AJAC  48 V. MISHRA ET AL. and standard solutions were prepared with ultrapure wa- ter (18 MΩ) obtained from a MilliQ-Academic System (Millipore, India). 2.3. Procedure for Conditioning Capillary and Sample Injection Procedures for conditioning capillary, rinsing with elec- trolyte, hydrodynamic injection of the samples and re- rinsing were programmable and these are defined for sequential execution. Briefly, the capillary was washed with 0.2 M NaOH for 15 min and with water for 10 min followed by rinsing with BGE for 15 min. About 1.5nL of the sample solution was injected into the capillary hydrodynamically by applying 50 mbar pressure for 0.2 min. A potential of 15 kV was applied during the sample run and in between two sample runs, the capillary was again rinsed with BGE for 5 min to minimize memory effect, if any. 3. Results and Discussion Generally, capillary zone electrophoresis (CZE) is em- ployed for the separation of metal ions with comparable concentrations. Separating trace amounts of a metal cation present in another metal matrix is a difficult task in any high performance separation technique. However, achieving such separations offer advantages like hassle free sample preparation viz. no need of matrix separation, no uncertainty on analyte recovery and reduction in overall analysis time. Since the dissolved uranium sam- ple solution will have high ionic strength, the direct in- jection of sample into the capillary can cause certain dif- ficulties such as 1) undesirable peak broadening may occur if the conductance of sample zone (λs) becomes higher than the conductance of the BGE (λB), 2) change in the zeta potential and variation in the magnitude of EOF occur due to adsorption of matrix cation on the sur- face of capillary and altering the migration time of all species significantly, 3) poor precision on the migration time due to the delayed desorption of the matrix cations resulting in long tailing or asymmetry, 4) poor separation efficiency with band broadening (the plate height in- creases when sample concentration is more) due to over- loading of the capillary with matrix ions and 5) severe efficiency loss due to large difference in viscosities of sample and BGE. Despite these difficulties, direct separation of trace analyte in presence of bulk matrix is feasible in CZE provided the method satisfies two conditions: 1) the ana- lyte and the matrix elements should have large difference in their relative mobilities and 2) the mobility of the analyte should be faster than matrix element. Under these conditions, the analyte reaches the detector much earlier than the matrix element and therefore, it will be free from matrix effects. In the present case, since both uranyl and ferric ions (in their hydrated form) have little differ- ence in their charge densities, it is difficult to separate them under normal conditions and addition of a com- plexing agent is essential for their separation. The or- ganic ligands reported in literature for complexing Fe(III) in CE studies [30-36,39] may not be suitable in the pre- sent case due to the reasons already mentioned above. Hence, it was proposed to consider chloride as ligand as well as carrier electrolyte since its complexation ability with UO2 2+ and Fe3+ ions is different and they tend to form cationic complexes of different charges. Moreover, the chloride medium enables the direct detection of se- lected metal ions [40,41] including iron. At lower concentrations of chloride ion (<0.5 M), the uranyl ion predominantly forms UO2Cl+ complex [42,43] in the pH range 2-3. Further, the formation of anionic complexes viz. UO2Cl3 -, UO2Cl4 2-, and UO2Cl5 3- occurs only when the chloride concentration exceeds 5 M. Similarly, though Fe(III) forms FeCl2+, FeCl2 +, FeCl3 and FeCl4 - complexes, only FeCl2+ is predominant at low chloride concentrations [44]. The formation constants (log values) for the [UO2Cl]+ and [FeCl]2+ complexes (0.17 and and 1.52 respectively) show that the Fe+3 has more affinity towards chloride complex formation [43,45] than UO2 2+. Therefore, at low chloride concentrations UO2 2+ and Fe+3 form [UO2Cl]+ and [FeCl]2+ complexes respectively and their electrophoretic mobilities will change significantly due to charge differences and their separation from each other may become feasible. Com- plex formation between chloride and divalent transition metal ions such as Zn(II), Cu(II), Cd(II), Mn(II) etc., is readily achieved and the complexes are remarkably sta- ble [46]. These complexes are either anionic or neutral in nature [47] and do not cause any interference. The ab- sorbance of the peak for iron as [FeCl]2+ complex was measured at 214 nm [45]. 3.1. Optimization of Background Electrolyte A mixed solution of HCl and KCl was selected as BGE. The HCl solution is the carrier electrolyte and it prevents the hydrolysis of iron, uranium and their chloride com- plexes by providing lower pH whereas KCl provides adequate chloride (ligand) ions inside the capillary to prevent the decomposition of complexes. All the separa- tions were carried out with 15 kV applied voltage. Initially the separation of Fe(III) was performed with 10-2, 10-3 , 10-4 and 10-5 M HCl solutions corresponding to pH 2, 3, 4 and 5 without KCl. This was done to explore Copyright © 2011 SciRes. AJAC  V. MISHRA ET AL. Copyright © 2011 SciRes. AJAC 49 the feasibility of separating iron with low ionic strength electrolytes, which minimize joule heat generation. The standard iron solutions were also prepared in the respec- tive HCl solutions in order to have almost identical composition in the BGE and standards. Figure 1 shows the overlay of electropherograms obtained for each car- rier electrolyte. It is seen from the figure that decreasing the pH of the carrier electrolyte decreased the migration time of Fe(III) peak with substantial peak broadening. This was unexpected because increasing pH of the car- rier electrolyte typically causes reduction in the migra- tion time. However, the change in migration time in this case may be possibly due to following three reasons. Firstly, on increasing the pH, the silanol group of the capillary dissociates considerably resulting in negative charges on the surface of fused silica. These negatively charged sites attract the free metal ions of iron. Hence, transient retention of iron on the capillary surface occurs, which leads to increase in migration time, band broad- ening and loss in sensitivity. Secondly, at higher pH so- lutions the extent of complex formation is affected due to lower concentrations of chloride. Thirdly, when the pH is above 2, the hydrolysis of Fe(III) and its chloride com- plexes may probably occur and form neutral species (hy- droxides) as reported in the literature [44]. The influence of electrolyte pH on the separation did not result in any definite conclusion because the total chloride concentration at each pH condition was not kept constant. Hence, the influence of pH on the separation of iron at constant chloride concentration and the effect of chloride concentration under different pH conditions were examined. For this, three sets of solutions corre- sponding to pH 2, 3 and 4 were prepared. In each set, the pH was maintained at the pre-selected value by keeping a fixed concentration of HCl but the total chloride content was varied from 30 to 100 mM by adding calculated amount of KCl. With pH 2 electrolyte, on increasing chloride concentration, the migration time of iron in- creased slightly but not significantly and at the same time, the corresponding peak area increased up to a chloride concentration of 75 mM (10 mM HCl + 65 mM KCl). Further increase in chloride concentration caused only marginal changes in the peak areas (Figure 2). On the other hand, electrolytes of pH 3 and pH 4 brought about severe base line drift and huge noise when the chloride concentration was increased. During the separation, there may be a little change in the electrolyte pH due to applied potential and protona- tion of silinol groups. This change can alter the migration time of iron. However, this effect was found to be insig- nificant when iron was separated with electrolytes of pH 1.8, 2.0 and 2.2 as these electrolytes brought about mi- gration time of iron peak within 1% precision (RSD, n = 5 in each pH condition). Based on these, a BGE of 10 mM HCl and 65 mM KCl (pH 2) was chosen for further studies. Figure 1. Electropherograms obtained for a standard iron solution (25 mg•L-1 ) with BGEs of different pH. 1). 10-2 M HCl BGE corresponding to pH 2; 2). 10-3 M HCl BGE corresponding to pH 3; 3). 10-4 M HCl BGE corresponding to pH 4 and 4). 10-5 M HCl BGE corresponding to pH 5, Conditions: Capillary: 60 cm × 50 µm, Applied voltage: 15 kV. Detection: direct UV t 215 nm. a 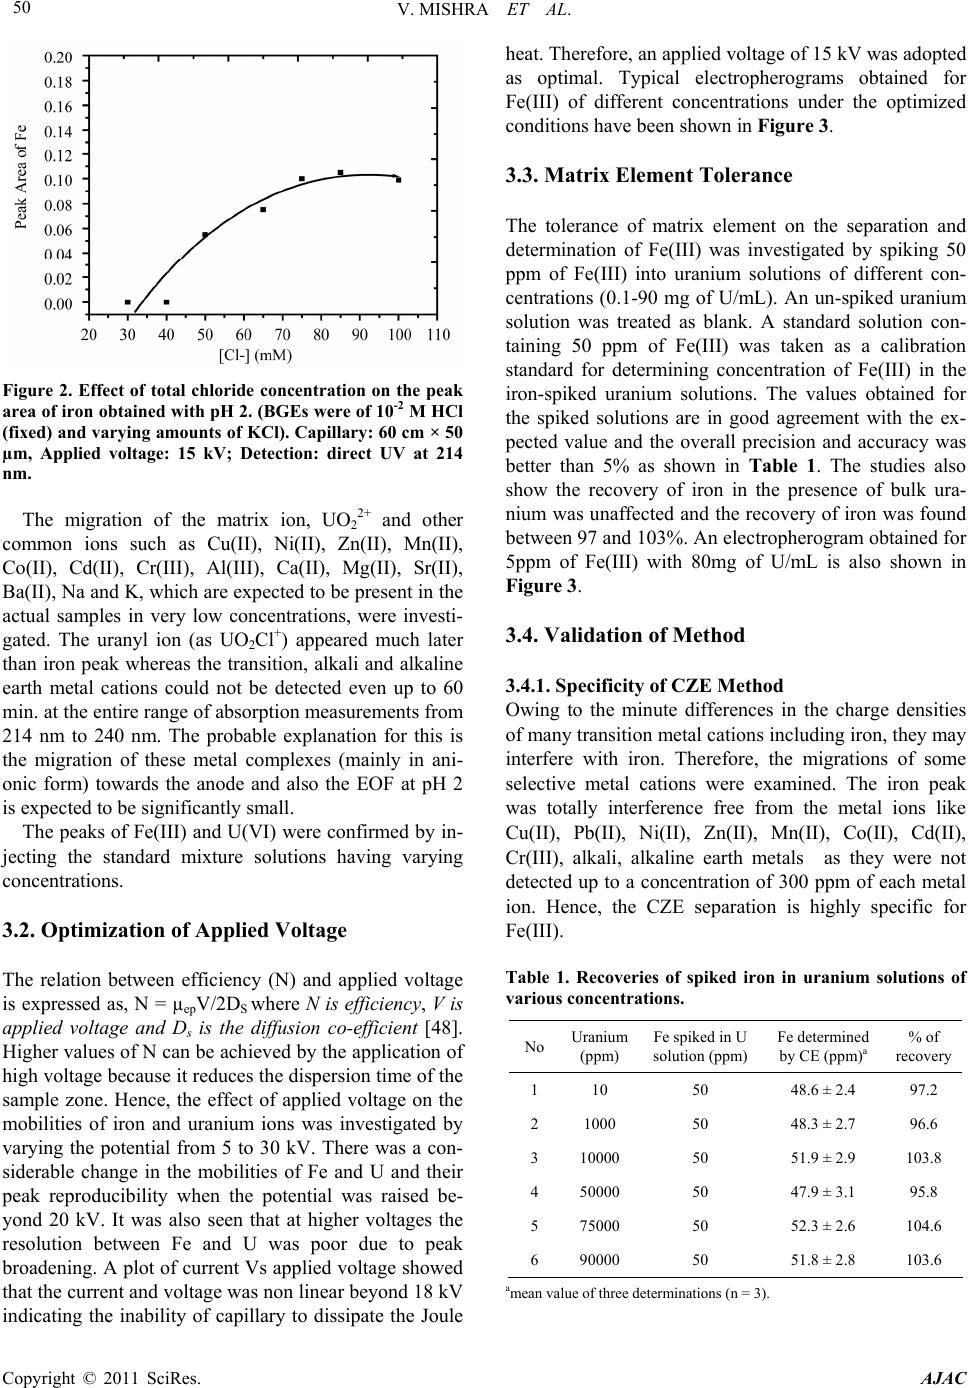 V. MISHRA ET AL. 50 Figure 2. Effect of total chloride concentration on the peak area of iron obtained with pH 2. (BGEs were of 10-2 M HCl (fixed) and varying amounts of KCl). Capillary: 60 cm × 50 µm, Applied voltage: 15 kV; Detection: direct UV at 214 nm. The migration of the matrix ion, UO2 2+ and other common ions such as Cu(II), Ni(II), Zn(II), Mn(II), Co(II), Cd(II), Cr(III), Al(III), Ca(II), Mg(II), Sr(II), Ba(II), Na and K, which are expected to be present in the actual samples in very low concentrations, were investi- gated. The uranyl ion (as UO2Cl+) appeared much later than iron peak whereas the transition, alkali and alkaline earth metal cations could not be detected even up to 60 min. at the entire range of absorption measurements from 214 nm to 240 nm. The probable explanation for this is the migration of these metal complexes (mainly in ani- onic form) towards the anode and also the EOF at pH 2 is expected to be significantly small. The peaks of Fe(III) and U(VI) were confirmed by in- jecting the standard mixture solutions having varying concentrations. 3.2. Optimization of Applied Voltage The relation between efficiency (N) and applied voltage is expressed as, N = µepV/2DS where N is efficiency, V is applied voltage and Ds is the diffusion co-efficient [48]. Higher values of N can be achieved by the application of high voltage because it reduces the dispersion time of the sample zone. Hence, the effect of applied voltage on the mobilities of iron and uranium ions was investigated by varying the potential from 5 to 30 kV. There was a con- siderable change in the mobilities of Fe and U and their peak reproducibility when the potential was raised be- yond 20 kV. It was also seen that at higher voltages the resolution between Fe and U was poor due to peak broadening. A plot of current Vs applied voltage showed that the current and voltage was non linear beyond 18 kV indicating the inability of capillary to dissipate the Joule heat. Therefore, an applied voltage of 15 kV was adopted as optimal. Typical electropherograms obtained for Fe(III) of different concentrations under the optimized conditions have been shown in Figure 3. 3.3. Matrix Element Tolerance The tolerance of matrix element on the separation and determination of Fe(III) was investigated by spiking 50 ppm of Fe(III) into uranium solutions of different con- centrations (0.1-90 mg of U/mL). An un-spiked uranium solution was treated as blank. A standard solution con- taining 50 ppm of Fe(III) was taken as a calibration standard for determining concentration of Fe(III) in the iron-spiked uranium solutions. The values obtained for the spiked solutions are in good agreement with the ex- pected value and the overall precision and accuracy was better than 5% as shown in Table 1. The studies also show the recovery of iron in the presence of bulk ura- nium was unaffected and the recovery of iron was found between 97 and 103%. An electropherogram obtained for 5ppm of Fe(III) with 80mg of U/mL is also shown in Figure 3. 3.4. Validation of Method 3.4.1. Specificity of CZE Method Owing to the minute differences in the charge densities of many transition metal cations including iron, they may interfere with iron. Therefore, the migrations of some selective metal cations were examined. The iron peak was totally interference free from the metal ions like Cu(II), Pb(II), Ni(II), Zn(II), Mn(II), Co(II), Cd(II), Cr(III), alkali, alkaline earth metals as they were not detected up to a concentration of 300 ppm of each metal ion. Hence, the CZE separation is highly specific for Fe(III). Table 1. Recoveries of spiked iron in uranium solutions of various concentrations. No Uranium (ppm) Fe spiked in U solution (ppm) Fe determined by CE (ppm)a % of recovery 1 10 50 48.6 ± 2.4 97.2 2 1000 50 48.3 ± 2.7 96.6 3 10000 50 51.9 ± 2.9 103.8 4 50000 50 47.9 ± 3.1 95.8 5 75000 50 52.3 ± 2.6 104.6 6 90000 50 51.8 ± 2.8 103.6 amean value of three determinations (n = 3). C opyright © 2011 SciRes. AJAC 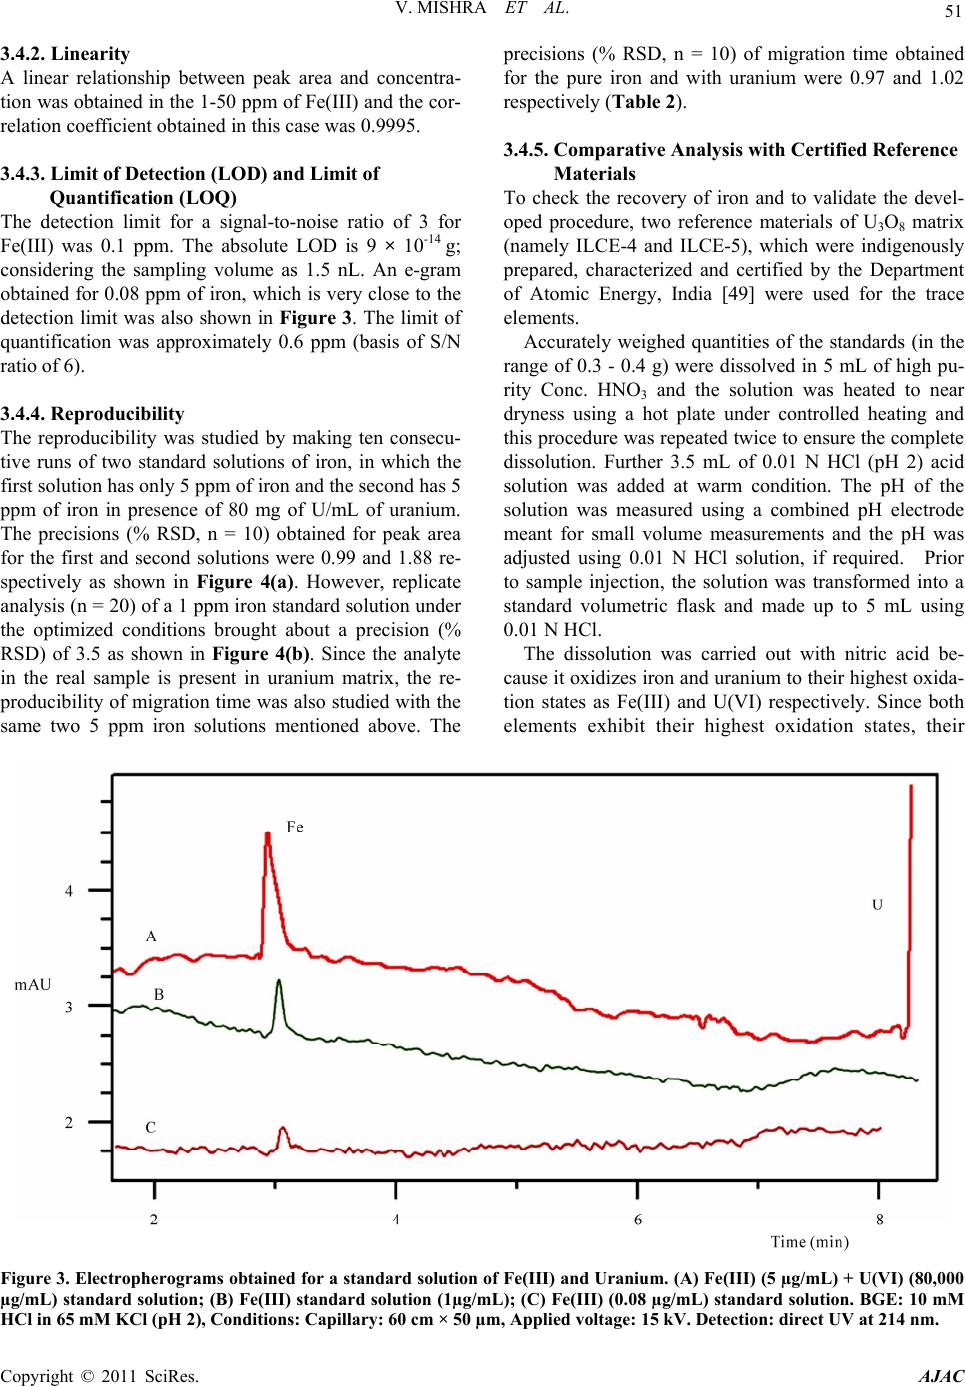 V. MISHRA ET AL. Copyright © 2011 SciRes. AJAC 51 3.4.2. Linearity A linear relationship between peak area and concentra- tion was obtained in the 1-50 ppm of Fe(III) and the cor- relation coefficient obtained in this case was 0.9995. 3.4.3. Limit of Detection (LOD) and Limit of Quantification (LOQ) The detection limit for a signal-to-noise ratio of 3 for Fe(III) was 0.1 ppm. The absolute LOD is 9 × 10-14 g; considering the sampling volume as 1.5 nL. An e-gram obtained for 0.08 ppm of iron, which is very close to the detection limit was also shown in Figure 3. The limit of quantification was approximately 0.6 ppm (basis of S/N ratio of 6). 3.4.4. Reproducibility The reproducibility was studied by making ten consecu- tive runs of two standard solutions of iron, in which the first solution has only 5 ppm of iron and the second has 5 ppm of iron in presence of 80 mg of U/mL of uranium. The precisions (% RSD, n = 10) obtained for peak area for the first and second solutions were 0.99 and 1.88 re- spectively as shown in Figure 4(a). However, replicate analysis (n = 20) of a 1 ppm iron standard solution under the optimized conditions brought about a precision (% RSD) of 3.5 as shown in Figure 4(b). Since the analyte in the real sample is present in uranium matrix, the re- producibility of migration time was also studied with the same two 5 ppm iron solutions mentioned above. The precisions (% RSD, n = 10) of migration time obtained for the pure iron and with uranium were 0.97 and 1.02 respectively (Table 2). 3.4.5. Comparative Analysis with Certified Reference Materials To check the recovery of iron and to validate the devel- oped procedure, two reference materials of U3O8 matrix (namely ILCE-4 and ILCE-5), which were indigenously prepared, characterized and certified by the Department of Atomic Energy, India [49] were used for the trace elements. Accurately weighed quantities of the standards (in the range of 0.3 - 0.4 g) were dissolved in 5 mL of high pu- rity Conc. HNO3 and the solution was heated to near dryness using a hot plate under controlled heating and this procedure was repeated twice to ensure the complete dissolution. Further 3.5 mL of 0.01 N HCl (pH 2) acid solution was added at warm condition. The pH of the solution was measured using a combined pH electrode meant for small volume measurements and the pH was adjusted using 0.01 N HCl solution, if required. Prior to sample injection, the solution was transformed into a standard volumetric flask and made up to 5 mL using 0.01 N HCl. The dissolution was carried out with nitric acid be- cause it oxidizes iron and uranium to their highest oxida- tion states as Fe(III) and U(VI) respectively. Since both elements exhibit their highest oxidation states, their Figure 3. Electropherograms obtained for a standar d solution of Fe(III) and Uranium. (A) Fe(III) (5 µg/mL) + U(VI) (80,000 µg/mL) standard solution; (B) Fe(III) standard solution (1µg/mL); (C) Fe(III) (0.08 µg/mL) standard solution. BGE: 10 mM HCl in 65 mM KCl (pH 2), Conditions: Capillary: 60 cm × 50 µm, Applied voltage: 15 kV. Detection: direct UV at 214 nm. 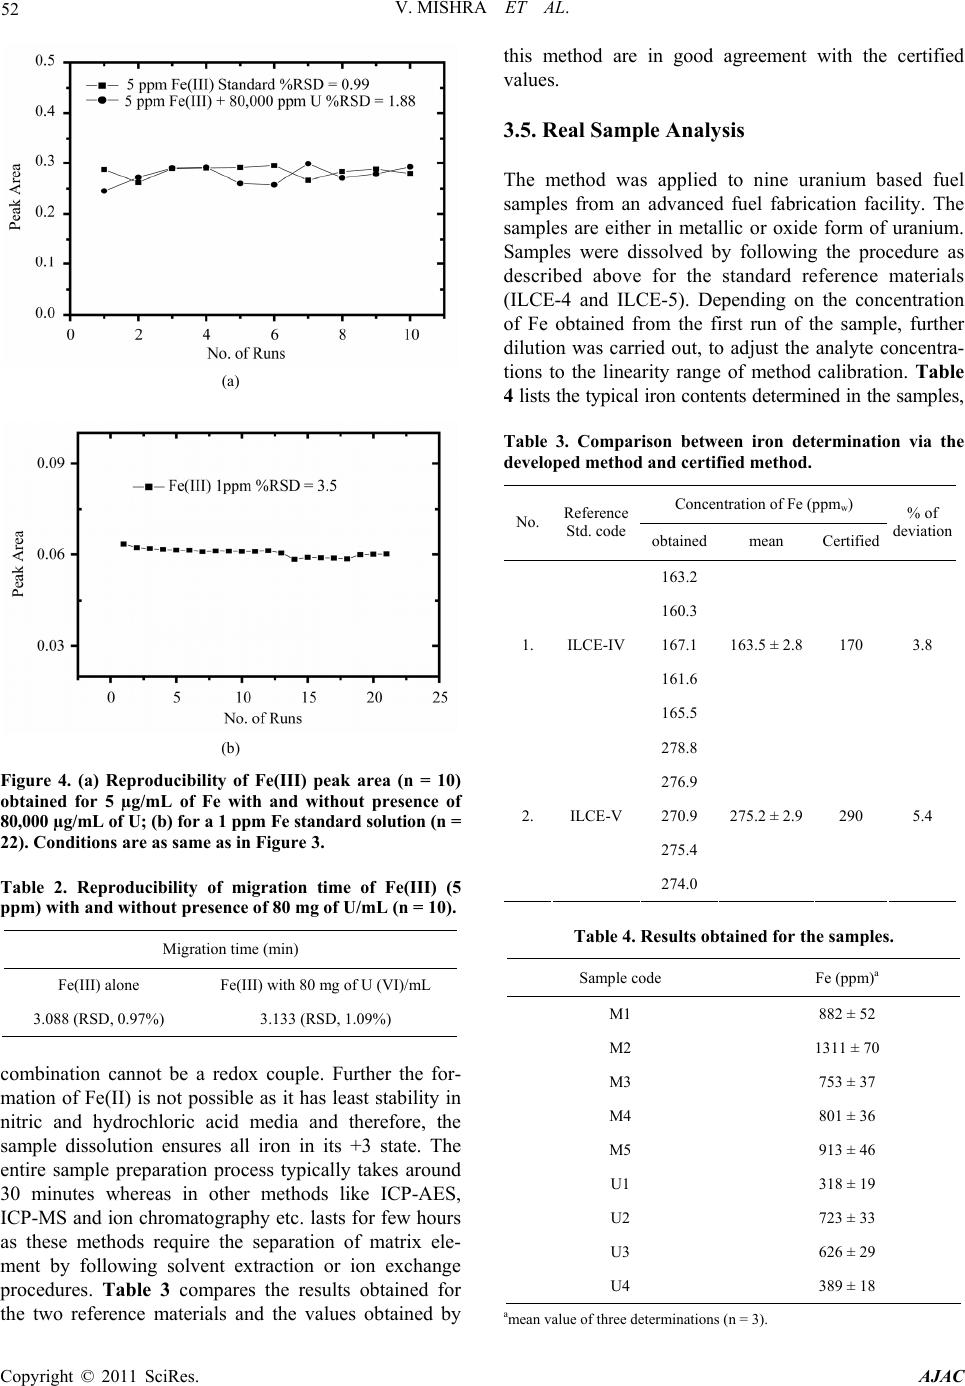 V. MISHRA ET AL. Copyright © 2011 SciRes. AJAC 52 (a) (b) Figure 4. (a) Reproducibility of Fe(III) peak area (n = 10) obtained for 5 µg/mL of Fe with and without presence of 80,000 µg/mL of U; (b) for a 1 ppm Fe st andard sol ution (n = 22). Conditions are as same as in Figure 3. Table 2. Reproducibility of migration time of Fe(III) (5 ppm) with and without presence of 80 mg of U/mL (n = 10). Migration time (min) Fe(III) alone Fe(III) with 80 mg of U (VI)/mL 3.088 (RSD, 0.97%) 3.133 (RSD, 1.09%) combination cannot be a redox couple. Further the for- mation of Fe(II) is not possible as it has least stability in nitric and hydrochloric acid media and therefore, the sample dissolution ensures all iron in its +3 state. The entire sample preparation process typically takes around 30 minutes whereas in other methods like ICP-AES, ICP-MS and ion chromatography etc. lasts for few hours as these methods require the separation of matrix ele- ment by following solvent extraction or ion exchange procedures. Table 3 compares the results obtained for the two reference materials and the values obtained by this method are in good agreement with the certified values. 3.5. Real Sample Analysis The method was applied to nine uranium based fuel samples from an advanced fuel fabrication facility. The samples are either in metallic or oxide form of uranium. Samples were dissolved by following the procedure as described above for the standard reference materials (ILCE-4 and ILCE-5). Depending on the concentration of Fe obtained from the first run of the sample, further dilution was carried out, to adjust the analyte concentra- tions to the linearity range of method calibration. Table 4 lists the typical iron contents determined in the samples, Table 3. Comparison between iron determination via the developed method and certified method. Concentration of Fe (ppmw) No. Reference Std. codeobtainedmean Certified % of deviation 163.2 160.3 167.1 161.6 1. ILCE-IV 165.5 163.5 ± 2.8 170 3.8 278.8 276.9 270.9 275.4 2. ILCE-V 274.0 275.2 ± 2.9 290 5.4 Table 4. Results obtained for the samples. Sample code Fe (ppm)a M1 882 ± 52 M2 1311 ± 70 M3 753 ± 37 M4 801 ± 36 M5 913 ± 46 U1 318 ± 19 U2 723 ± 33 U3 626 ± 29 U4 389 ± 18 amean value of three determinations (n = 3). 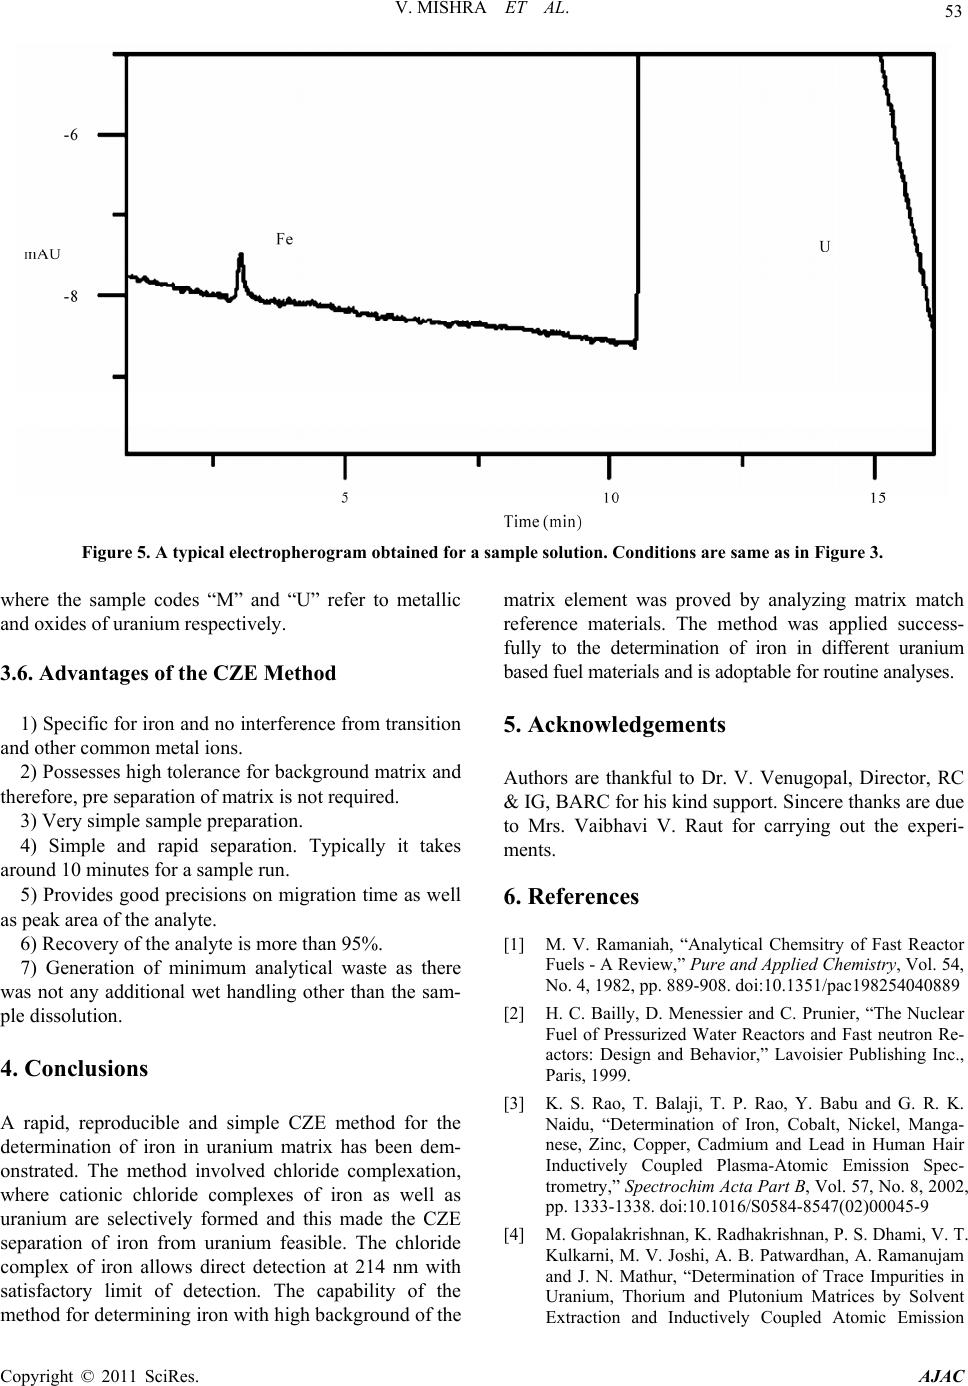 V. MISHRA ET AL. Copyright © 2011 SciRes. AJAC 53 Figure 5. A typical electropherogram obtained for a sample solution. Conditions are same as in Figure 3. where the sample codes “M” and “U” refer to metallic and oxides of uranium respectively. 3.6. Advantages of the CZE Method 1) Specific for iron and no interference from transition and other common metal ions. 2) Possesses high tolerance for background matrix and therefore, pre separation of matrix is not required. 3) Very simple sample preparation. 4) Simple and rapid separation. Typically it takes around 10 minutes for a sample run. 5) Provides good precisions on migration time as well as peak area of the analyte. 6) Recovery of the analyte is more than 95%. 7) Generation of minimum analytical waste as there was not any additional wet handling other than the sam- ple dissolution. 4. Conclusions A rapid, reproducible and simple CZE method for the determination of iron in uranium matrix has been dem- onstrated. The method involved chloride complexation, where cationic chloride complexes of iron as well as uranium are selectively formed and this made the CZE separation of iron from uranium feasible. The chloride complex of iron allows direct detection at 214 nm with satisfactory limit of detection. The capability of the method for determining iron with high background of the matrix element was proved by analyzing matrix match reference materials. The method was applied success- fully to the determination of iron in different uranium based fuel materials and is adoptable for routine analyses. 5. Acknowledgements Authors are thankful to Dr. V. Venugopal, Director, RC & IG, BARC for his kind support. Sincere thanks are due to Mrs. Vaibhavi V. Raut for carrying out the experi- ments. 6. References [1] M. V. Ramaniah, “Analytical Chemsitry of Fast Reactor Fuels - A Review,” Pure and Applied Chemistry, Vol. 54, No. 4, 1982, pp. 889-908. doi:10.1351/pac198254040889 [2] H. C. Bailly, D. Menessier and C. Prunier, “The Nuclear Fuel of Pressurized Water Reactors and Fast neutron Re- actors: Design and Behavior,” Lavoisier Publishing Inc., Paris, 1999. [3] K. S. Rao, T. Balaji, T. P. Rao, Y. Babu and G. R. K. Naidu, “Determination of Iron, Cobalt, Nickel, Manga- nese, Zinc, Copper, Cadmium and Lead in Human Hair Inductively Coupled Plasma-Atomic Emission Spec- trometry,” Spectrochim Acta Part B, Vol. 57, No. 8, 2002, pp. 1333-1338. doi:10.1016/S0584-8547(02)00045-9 [4] M. Gopalakrishnan, K. Radhakrishnan, P. S. Dhami, V. T. Kulkarni, M. V. Joshi, A. B. Patwardhan, A. Ramanujam and J. N. Mathur, “Determination of Trace Impurities in Uranium, Thorium and Plutonium Matrices by Solvent Extraction and Inductively Coupled Atomic Emission  54 V. MISHRA ET AL. Spectrometry,” Talanta, Vol. 44, 1997, pp. 169-176. doi:10.1016/S0039-9140(96)02027-9 [5] H. Vanhoe, C. Vandecasteele, J. Versieck and R. Dams, “Determination of Iron, Cobalt, Copper, Zinc, Rubidium, Molybdenum and Cesium in Human Serum by Induc- tively Coupled Mass Spectrometry,” Analytical Chemis- try, Vol. 61, No. 17, 1989, pp. 1851-1857. doi:10.1021/ac00192a014 [6] Z. Marczenko and M. Balcerzak, “Separation, Precon- centration and Spectrophotometry in Inorganic Analysis,” Elsevier, 2000, pp. 226-237. [7] A. Kelkar, A. Prakash, M. Afzal, J. P. Panakkal and H. S. Kamath, “Determination of Alkali, Alkaline Earth and Transition Metal Ions in UO2, ThO2 Powders and Sin- tered (Th,U)O2 Pellets by Ion Chroamtography,” Journal of Radioanalytical and Nuclear Chemistry, Vol. 284, No. 2, 2010, pp. 443-449. doi:10.1007/s10967-010-0491-y [8] V. V. Raut, M. K. Das, S. Jeyakumar and K. L. Rama- kumar, “HPIC Separation and Quantification of Ca and Fe in Uranium Metal and Alloy Compounds,” Proceed- ings SESTEC-2008, Delhi, 12-14 March 2008. [9] R. M. Cassidy and S. Elchuk, “Application of High Per- formance Liquid Chromatography to the Analysis of Nu- clear Materials,” Journal of Liquid Chromatography & Related Technologies, Vol. 4, No. 3, 1981, pp. 379-398. doi:10.1080/01483918108059943 [10] S. Hjerten, “Free Zone Electrophoresis,” Chroma- tographic Reviews, Vol. 9, 1967, pp. 122-219. doi:10.1016/0009-5907(67)80003-6 [11] A. K. Malik, “Metal Analysis with Capillary Zone Elec- trophoresis,” Methods in Molecular Biology, Vol. 328, 2008, pp. 21-42. doi:10.1007/978-1-59745-376-9_2 [12] J. S. Fritz, “Recent Developments in the Separation of Inorganic and Small Organic Ions by Capillary Electro- phoresis,” Journal of Chromatography A, Vol. 884, No. 1-2, 2000, pp. 261-275. doi:10.1016/S0021-9673(00)00186-2 [13] A. R. Timerbaev, “Capillary Electrophoresis of Inorganic Ions: An Update,” Electrophoresis, Vol. 25, 2004, pp. 4008-4031. doi:10.1002/elps.200406111 [14] A. R. Timerbaev, “Recent Trends in CE of Inorganic Ions: From Individual to Multiple Elemental Species Analy- sis,” Electrophoresis, Vol. 28, 2007, pp. 3420-3435. doi:10.1002/elps.200600491 [15] A . R. Timerbaev, “Inorganic Species Analysis by CE - An Overview for 2007-2008,” Electrophoresis, Vol. 31, 2010, pp. 192-204. doi:10.1002/elps.200900397 [16] F. Qu and J. Lina, “Separation of Transition Metals in Nonaqueous Media with Capillary Electrophoresis,” Journal of Chromatography A, Vol. 1068, 2005, pp. 169-174. doi:10.1016/j.chroma.2004.10.055 [17] F. Qu, J. Lin and Z. Chen, “Simultaneous Separation of Nine Metal Ions and Ammonium with Nonaqueous Cap- illary Electrophoresis,” Journal of Chromatography A, Vol. 1022, 2004, pp. 217-221. doi:10.1016/j.chroma.2003.09.039 [18] E. Naujalis and A. Padarauskas, “Development of Capil- lary Electrophoresis for the Determination of Metal Ions Using Mixed Partial and Complete Complexation Tech- niques,” Journal of Chromatography A, Vol. 977, 2002, pp. 135-142. doi:10.1016/S0021-9673(02)01350-X [19] J . Gao, X. Sun, W. Yang, H. Fan, C. Li and X. Mao, “Separation and Determination of Six Metal Cations by Capillary Zone Electrophoresis,” Journal of the Chilean Chemical Society, Vol. 53, No. 1, 2008, pp. 1431-1434. doi:10.4067/S0717-97072008000100020 [20] B. H. Li and X. P. Yan, “Rapid Speciation of Iron by On-Line Coupling of Short Column Capillary Electro- phoresis and Inductively Coupled Plasma Mass Spec- trometry with the Collision Cell Technique,” Journal of Separation Science, Vol. 30, 2007, pp. 916-922. doi:10.1002/jssc.200600405 [21] J. E. Sonke and V. J. M. Salters, “Capillary Electrophore- sis-High Resolution Sector Field Inductively Coupled Plasma Mass Spectrometry,” Journal of Chromatography A, Vol. 1159, 2007, pp. 63-74. doi:10.1016/j.chroma.2007.05.055 [22] R. Kautenburger and H. P. Beck, “Complexation Studies with Lanthanides and Humic Acid Analysed by Ultrafil- tration and Capillary Electrophoresis-Inductively Cou- pled Plasma Mass Spectrometry,” Journal of Chroma- tography A, Vol. 59, 2007, pp. 75-80. doi:10.1016/j.chroma.2007.03.092 [23] E. X. Vrouwe, R. Luttge, W. Olthuis and A. van den Berg, “Rapid Inorganic Ion Analysis Using Quantitative Mi- crochip Capillary Electrophoresis,” Journal of Chroma- tography A, Vol. 1102, 2006, pp. 287-293. doi:10.1016/j.chroma.2005.10.064 [24] G. L. Klunder, J. E. Andrews, P. M. Grant, B. D. Andre- sen and R. E. Russo, “Analysis of Fission Products Using Capillary Electrophoresis with On-Line Radioactivity Detection,” Analytical Chemistry, Vol. 69, 1997, pp. 2988-2993. doi:10.1021/ac970042e [25] B. Kuczewski, C. M. Marquardt, A. Seibert, H. Geckeis, J. V. Kratz and N. Trautmann, “Separtion of Plutonium and Neptunium Species by Capillary Electrophoresis- Inductively Coupled Plasma-Mass Spectrometry and Ap- plication to Natural Groundwater Samples,” Analytical Chemistry, Vol. 75, 2003, pp. 6769-6774. doi:10.1021/ac0347213 [26] A. R. Timerbaev, “Metal Ions Analysis by Capillary Electrophoresis: New Possibilities in Separation and De- tection,” Journal of Capillary Electrophoresis, Vol. 1, 1995, pp. 14-23. [27] F. Foret, S. Fanali, A. Nardi and P. Bocek, “Capillary Zone Electrophoresis of Rare Earth Metals with Indirect UV Absorbance Detection,” Electrophoresis, Vol. 11, 1990, pp. 780-783. doi:10.1002/elps.1150110919 [28] Y. Shi and J. S. Fritz, “Separation of Metal Ions by Cap- illary Electrophoresis with A Complexing Electrolyte,” Journal of Chromatography A, Vol. 640, 1993, pp. 473-479. doi:10.1016/0021-9673(93)80217-V [29] A. R. Timerbaev, O. P. Semenova and O. M. Petrukhin, Copyright © 2011 SciRes. AJAC  V. MISHRA ET AL. Copyright © 2011 SciRes. AJAC 55 “Migration Behaviour of Metal Complexes in Capillary Zone Electrophoresis: Interpretation in Terms of Quanti- tative Structure-Mobility Relationships,” Journal of Chromatography A, Vol. 943, 2002, pp. 263-274. doi:10.1016/S0021-9673(01)01462-5 [30] S. Pozdniakova, A. Padarauskas and G. Schwedt, “Si- multaneous Determination of Iron(II) and Iron(III) in Water by Capillary Electrophoresis,” Analytica Chimica Acta, Vol. 351, 1997, pp. 41-48. doi:10.1016/S0003-2670(97)00331-0 [31] B. Y. Deng, C. J. Zeng and W. T. Chan, “Speciation of Iron Using Capillary Electrophoresis Inductively Coupled Plasma Atomic Emission Spectrometry,” Spectroscopy and Spectral Analysis, Vol. 25, 2005, pp. 1868-1871. [32] P. Blatný, F. Kvasnička and E. Kenndler, “Trace Deter- mination of Iron in Water at the µg/l Level by On-line Coupling of Capillary Zone Electrophoresis with UV Detection of the EDTA-Fe(III) Complex,” Journal of Chromatography A, Vol. 757, 1997, pp. 297-302. doi:10.1016/S0021-9673(96)00668-1 [33] B. Baraj, M. Martinez, A. Sastre and M. Aguilar, “Si- multaneous Determination of Cr(III), Fe(III), Cu(II) and Pb(II) as UV-absorbing EDTA Complexes by Capillary Zone Electrophoresis,” Journal of Chromatography A, Vol. 695, 1995, pp. 103-111. doi:10.1016/0021-9673(94)01078-S [34] G. Owens, V. K. Ferguson, M. J. Mclaughlin, I. Singleton, R. J. Reid and F. A. Smith, “Determination of NTA and EDTA and Speciation of Their Metal Complexes in Aqueous Solution by Capillary Electrophoresis,” Envi- ronmental Science & Technology, Vol. 34, 2000, pp. 885-891. doi:10.1021/es990309m [35] S. Schäffer, P. Gared, C. Dezael and D. Richard, “Direct Determination of Iron(II), Iron (III) and Total Iron as UV-absorbing Complexes by Capillary Electrophoresis,” Journal of Chromatography A, Vol. 740, 1996, pp. 151-157. doi:10.1016/0021-9673(96)00121-5 [36] W. Buchberger and S. Mülleder, “Determination of Che- lating Agents and Metal Chelates by Capillary Zone Elec- trophoresis,” Mikrochimica Acta, Vol. 119, 1995, pp. 103-111. doi:10.1007/BF01244859 [37] P. Kuban, P. Kuban and V. Kuban, “Simultaneous Capil- lary Electrophoretic Separation of Small Anions and Cations after Complexation with Ehylenediamine- tetraacetic Acid,” Journal of Chromatography A, Vol. 836, 1999, pp. 75-80. doi:10.1016/S0021-9673(98)00980-7 [38] M. Xavier, P. R. Nair, K. V. Lohithakshan, S. G. Marathe and H. C. Jain, “Determiantion of Uranium in the Pres- ence of Iron and Plutonium by Ti(III) Reduction and Biamperometric Titration,” Journal of Radioanalytical and Nuclear Chemistry, Vol. 148, 1991, pp. 251-256. doi:10.1007/BF02060358 [39] I. Ali, V. K. Gupta and H. Y. Aboul-Enein, “Metal Ion Speciation and Capillary Electrophoresis: Application in the New Millennium,” Electrophoresis, Vol. 26, 2005, pp. 3988-4002. doi:10.1002/elps.200500216 [40] B. Baraj, A. Sastre, A. Merkoci and M. Martinez, “De- termination of Chloride Complex of Au(III) by Capillary Zone Electrophoresis with Direct UV Detection,” Journal of Chromatography A, Vol. 718, 1995, pp. 227-232. doi:10.1016/0021-9673(95)00655-9 [41] B. Baraj, A. Sastre, M. Martinez and K. Spahiu, “Simul- taneous Determination of Chloride Complexes of Pt(IV) and Pd(II) by Capillary Zone Electrophoresis with Direct UV Absorbance Detection,” Analytica Chimica Acta, Vol. 319, 1996, pp. 191-197. doi:10.1016/0003-2670(95)00472-6 [42] C. Hennig, K. Servaes, P. Nockemann, K. V. Hecke, L. V. Meervelt, J. Wouters, L. Fluyt, C. Görller-Walrand and R. V. Deun, “Species Distribution and Coordination of Uranyl Chloro Complexes in Acetonitrile,” Inorganic Chemistry, Vol. 47, 2008, pp. 2987-2993. doi:10.1021/ic7014435 [43] C. Hennig, J. Tutschku, A. Rossberg, G. Bernhard and A. C. Scheinost, “Comparative EXAFS Investigation of Ura- nium(VI) and –(IV) Aquo Chloro Complexes in Solution Using a Newly Developed Spectroelectrochemical Cell,” Inorganic Chemistry, Vol. 44, 2005, pp. 6655-6661. doi:10.1021/ic048422n [44] N. J. Welham, K. A. Malatt and S. Vukcevic, “The Effect of Solution Speciation on Iron-Sulphur-Arsenic-Chloride Systems at 298K,” Hydrometallurgy, Vol. 57, 2000, pp. 209-223. doi:10.1016/S0304-386X(00)00121-3 [45] W. Liu, B. Etschmann, J. Brugger, L. Spiccia, G. Foran and B. McInnes, “UV-Vis Spectrophotometric and XAFS Studies of Ferric Chloride Complexes in Hyper-Saline LiCl Solutions at 25-90˚C,” Chemical Geology, Vol. 231, 2006, pp. 326-349. doi:10.1016/j.chemgeo.2006.02.005 [46] W. Walkowlak, D. Bhattacharyya and R. B. Grieves, “Selective Foam Fractionation of Chloride Complexes of Zinc(II), Cadmium(II), Mercury(II) and Gold(III),” Ana- lytical Chemistry, Vol. 48, 1976, pp. 975-979. doi:10.1021/ac60371a036 [47] J. Bjerrum, “Determiantion of Small Stability Constants, A Spectrophotmetric Study of Copper(II) Chloride Com- plexes in Hydrochloric Acid,” Acta Chemica Scandi- navica - Series A, Vol. 41, 1987, pp. 328-334. doi:10.3891/acta.chem.scand.41a-0328 [48] H. Engelhardt, W. Beck and T. Schmitt, “Capillary Elec- trophoresis,” Friedrich Vieweg & Sohn Verlagsgesell- schaft mbH, Braunschweig/Wiesbaden, 1996. [49] DAE-Interlaboratory Comparison Experiment (ILCE) for Trace Metal Assay of Uranium, Phase-II Experimets: Development of Certified U3O8 Reference Materials, Document, BARC, India, February 2002.
|