Open Journal of Polymer Chemistry, 2013, 3, 104-112
Published Online November 2013 (http://www.scirp.org/journal/ojpchem)
http://dx.doi.org/10.4236/ojpchem.2013.34018
Open Access OJPChem
Synthesis of Bifunctional Poly(Vinyl Phosphonic
Acid-co-glycidyl Metacrylate-co-divinyl Benzene)
Cation-Exchange Resin and Its Indium Adsorption
Properties from Indium Tin Oxide Solution
Chi Won Hwang, Chang Soo Lee, Taek Sung Hwang*
Department of Applied Chemistry and Biological Engineering, Chungnam National University,
Daejeon, Korea
Email: *tshwang@cnu.ac.kr
Received August 10, 2013; revised September 10, 2013; accepted September 18, 2013
Copyright © 2013 Chi Won Hwang et al. This is an open access article distributed under the Creative Commons Attribution License,
which permits unrestricted use, distribution, and reproduction in any medium, provided the original work is properly cited.
ABSTRACT
Poly(vinyl phosphonic acid-co-glycidyl methacrylate-co -divinyl benzene) (PVGD) and PVGD containing an iminodi-
acetic acid group (IPVGD), which has indium ion selectivity, were synthesized by suspension polymerization, and their
indium adsorption properties were investigated. The synthesized PVGD and IPVGD resins were characterized using
Fourier transform infrared (FT-IR) spectroscopy, scanning electron microscopy (SEM), energy-dispersive X-ray spec-
troscopy (EDS) and mercury porosimetry. The cation-exchange capacity, the water uptake and the indium adsorption
properties were investigated. The cation-exchange capacities of PVGD and IPVGD were 1.2 - 4.5 meq/g and 2.5 - 6.4
meq/g, respectively. The water uptakes were decreased with increasing contents of divinyl benzene (DVB). The water
uptake values were 25% - 40% and 20% - 35%, respectively. The optimum adsorption of indium from a pure indium
solution and an artificial indium tin oxide (ITO) solution by the PVGD and IPVGD ion-exchange resins were 2.3 and
3.5 meq/g, respectively. The indium adsorption capacities of IPVGD were higher than those of PVGD. The indium ion
adsorption selectivity in the artificial ITO solution by PVGD and IPVGD was excellent, and other ions were adsorbed
only slightly.
Keywords: Poly(Vinyl Phosphonic Acid-co-glycidyl Methacrylate-co-divinyl Benzene); PVGD Containing an
Iminodiacetic Acid Group; Bifunctional Cation Exchanger; Indium Tin Oxide; Indium Adsorption
1. Introduction
Rare metals with conductivity and transparency, such as
indium, are essential for the production of display panels,
such as LCD, OLED and PDP. China possesses most of
the rare metals and recently weaponized these resources.
Therefore, a secure supply of rare metals, which are nec-
essary to the semiconductor industry and the munitions
industry, is urgently needed. Intensive research on in-
dium recovery technologies and material development
have been conducted in developed countries (USA, Japan)
to secure these resources from seawater and ITO etching
waste fluid [1-4].
However, the amount of indium in seawater is very
low. It is important to develop an adsorption and separa-
tion material with high selectivity. To separate indium
from ITO waste fluid which is produced during the dis-
play etching process called “urban mining,” the devel-
opment of a selective adsorption and separation material
for the recovery of indium from the etching waste fluid
in highly acidic conditions is required [5-7].
Ion exchange resins are widely used for the recovery
of indium from seawater due to the simplicity of the ex-
change process and the regeneration ability of the resin.
However, the development of a highly selective ion ex-
changer is needed because the concentration of indium in
seawater is low [8-12].
The chemical extraction method, which uses nitric
acid or a combination of nitric acid and hydrochloric acid,
the electro-dialysis method, and the ion exchange method
are used for the recovery of indium from ITO etching
*Corresponding author.
C. W. HWANG ET AL. 105
fluid [2,4]. Chemical extraction using acids has high ef-
ficiency, but it is difficult to separate indium and tin be-
cause both of these elements are simultaneously extra-
cted from seawater due to the difficulty involved in con-
trolling the pH. The electrodialysis method has high se-
lectivity, but it suffers from contamination of the mem-
brane, which is a fundamental part of the electrodealysis
method, due to the high acidity of the ITO etching waste
fluid, which causes a decrease in selectivity. The ion ex-
change method can improve the weaknesses of other me-
thods; however, it is necessary to develop a highly selec-
tive adsorption material for the recovery of traces of in-
dium from dilute solutions.
The most widely used ion exchange resins have phos-
phate groups for the selective adsorption of indium.
However, the development of a novel resin is necessary
because these resins have low mechanical stability and
low adsorption capability.
We synthesized a bifunctional poly(VPA-co-GMA-
co-DVB) cation exchanger with a high ion exchange
capacity, good mechanical strength, and easy function-
alization capability of selective indium adsorption groups
for the selective absorption and separation of indium. We
investigated its structure, ion exchange capacity, water
uptake, and the optimal conditions for the synthesis of
the resin and the adsorption of indium via adsorption
tests using artificial ITO solutions. In this paper, it was
experimental with “February. 4. 2013. Chungnam Na-
tional University, 79 Daehangno, Yuseong-gu, Daejeon
305-764, Republic of Korea”.
2. Experimental
2.1. Materials
Vinyl phosphonic acid (VPA, 90%), glycidyl metacrylate
(GMA, 99%) and divinyl benzene (DVB, 50%) as the
crosslinking agent were obtained from the Sigma-Aldrich
Co. (New York, USA). Benzoyl peroxide (BPO, 75%)
(used as an initiator) and poly(vinyl alcohol) (PVA)
(used as a stabilizer) were purchased from Lancaster
(Morecambe, England) and Junsei, respectively. 1-(2-
Pyridylazo)-2-naphtol (PAN), acetonitrile (used as a
diluent), and ethylene diamine tetracetic acid (EDTA)
(used as an indicator and as a titrant) were purchased
from the Sigma-Aldrich Co. (New York, USA) and Sam-
chun Co. (Seoul, Korea), respectively.
2.2. Synthesis of the Bifunctional
Poly(VPA-co-GMA-co-DVB)
Cation-Exchangers
The highly selective bifunctional poly(VPA-co-GMA-
co-DVB) cation exchangers were synthesized by suspen-
sion polymerization [10,11-13]. Table 1 and Figure 1
show the synthesis conditions, the polymerization sche-
me and the functionalization of the poly(VPA-co-GMA-
co-DVB) cation exchangers with iminodiacetic acid, re-
spectively. The polymerization was conducted in a 1000
mL four-neck round-bottom flask equipped with a me-
chanical stirrer (IKA® RW20 digital, IKA company,
Osaka, Japan), a condenser, a nitrogen inlet, a ther-
mometer and a dropping funnel. VPA, GMA and DVB
were dissolved in acetonitrile (ACN) and PVA at 70˚C.
The solution was placed under continuous, strong agita-
tion until all of the monomers and 2,2’-Azobis isobutyro
nitile (AIBN), which was used as an initiator, were com-
pletely dissolved. The polymerization was performed in
airtight equipment at 70˚C and maintained with stirring
(400 rpm) for 24 hours. The bifunctional poly(VPA-co-
GMA-co-DVB) resins were separated by vacuum suction
and washed using distilled water until a pH of 7 was
achieved. The poly(VPA-co-GMA-co-DVB) resins were
dried in a vacuum oven for 24 hours at 50˚C. The yield
of the copolymer resins was determined using Equation
(1):
Synthetic yield % 100
dm
WW (1)
where Wd is the weight of clean and dry polymer beads
(g) and Wm is the initial weight of the monomer (g).
2.3. Functionalization Reaction of
Poly(VPA-co-GMA-co-DVB) Resins by
Iminodiacetic Acid
The bifunctionalized poly(VPA-co-GMA-DVB) cation
Table 1. Synthesis conditions of poly(VPA-co-GM A-co-DVB) cation exchange resins.
Monomer
Batch
NO. GMA VPA DVB
AIBN
(Wt%)
Medium ACN
(g)
Temp.
(˚C)
Duration
(h)
Conversion
(%)
PVGD-1 100 0 0 4 23 70 24 83
PVGD-2 70 10 20 4 23 70 24 95
PVGD-3 60 20 20 4 23 70 24 89
PVGD-4 50 30 20 4 23 70 24 85
PVGD-5 40 40 20 4 23 70 24 70
PVGD-6 30 50 20 4 23 70 24 62
Copyright © 2013 SciRes. OJPChem
C. W. HWANG ET AL.
106
Figure 1. A schematic mechanism of PVGD and IPVGD cation-exchange resin.
exchangers were functionalized using iminodiacetic acid.
Table 2 shows the functionalization conditions. The re-
action for functionalizing the poly(VPA-co-GMA-co-
DVB) cation exchangers was conducted in a 500 mL
four-neck round-bottom flask equipped with a mechani-
cal stirrer (IKA® RW20 digital, IKA company, Osaka,
Japan), a condenser, a nitrogen inlet, a thermometer and
a dropping funnel. The poly(VPA-co-GMA-co-DVB)
copolymer was placed in the reactor with 300 mL of
DMF. The functionalization was performed at 120˚C for
24 hours with stirring (400 rpm). After introducing the
IDA groups in the GMA of the copolymer, the remaining
unreacted epoxide groups were hydrolyzed with a dilute
HCl solution for 2 hr at 80˚C. Subsequently, the poly
(VPA-co-GMA-co-DVB) cation exchangers with IDA
groups were washed with methanol and then dried at
50˚C in a vacuum oven.
2.4. Characterization of Poly(Vinyl Phosphonic
Acid-co-metacrylic Acid)
The structures of the poly(VPA-co-GMA-co-DVB) res-
ins and the bifunctional poly(VPA-co-GMA-co-DVB)
cation exchangers were characterized using a FT-IR
spectrometer (IR Prestige-21, Shimadzu, Kyoto, Japan).
The KBr pellets, which contained 1 mg of the sample and
150 mg of KBr, were prepared on a press using a 60 - 70
kN of compression force for 10 minutes under vacuum.
The FT-IR spectra were obtained over a wavenumber
range of 4000 - 600 cm1, the resolution was 4 cm1, and
20 scans were recorded.
The morphologies of the poly(VPA-co-GMA-co-DVB)
cation exchangers were analyzed using a scanning elec-
tron microscope (SEM), and the elemental analyses of
these exchangers were conducted using energy dispersive
X-ray spectroscopy (EDS, JSM-7000F, JEOL, Akishima,
Japan). Incident electron-beam energies from 0.5 to 30
keV were used. In all cases, the beam was at a normal
incidence to the sample surface, and the measurement
time was 100 s. All of the surfaces of the samples were
covered with osmium using the ion sputtering method.
The acidic resistance of the PVGD and IPVGD cation
exchange resins was investigated using the weight mea-
surement method. One gram of resin and a 5% HCl stan-
dard solution (30 ml) were placed in a 50 ml Erlenmeyer
flask. The flask was placed in a shaking water bath at
50˚C. The resin was removed from the flask after 60
minutes, washed with distilled water and dried in a heat-
ing oven at 50˚C. The durability was calculated using
Equation (2):
Durability %100%
wdd
WWW (2)
where Ww and Wd are the weights of the sample before
and after treatment with acid, respectively.
The crush strength of the PVGD and IPVGD cation
exchange resins before and after acid treatment were
Open Access OJPChem
C. W. HWANG ET AL. 107
Table 2. Functionalization conditionsf poly(VPA-co-GMA-co-DVB). o
Batch No. PVGD
(g)
IDA
(g)
DMF
(g)
Temp.
(˚C)
Time Conversion
(hr) (%)
IPVGD-1 20 20 300 120 24 80
IPVGD-2 20 20 300 120 24 91
IPVGD-3 20 20 300 120 24 88
IPVGD-4 20 20 300 120 24 83
IPVGD-5 20 20 300 120 24 68
IPVGD-6 20 20 300 120 24 60
sted with a universal testing machine (UTM). The
2.5. Water Uptake and Cation Exchange
A 1 g, ple was immersed in DI water for 24 hr.
te
specimens were prepared according to the ASTM stan-
dard. All specimens were measured 5 times.
Capacity
dried sam
The sample was removed from the DI water and wiped
with absorbent paper to remove excess water adhered to
the surface. The sample was then weighed on a balance.
The water uptake was calculated using Equation (3)
[14,15]:


Water uptake %100
wdd
WWW  (3)
where Ww and Wd are the weights of the samp
e the ion-exchange ca-
pa
le in wet
and dry conditions, respectively.
Titration was used to determin
city (IEC) of the cation exchange resins. The sample
was equilibrated in 100 mL of a 0.1 N NaOH solution at
room temperature for 24 hr before it was removed, and
then 20 mL of the NaOH solution was titrated with a 0.1
mol/L HCl solution, which contained a drop of phenol-
phthalein solution (0.1% in ethanol) as a pH indicator.
The experimental IEC was calculated according to Equa-
tion (4):

 
NaOHNaOHHCl HCl
5
d
q gVCVCW
(4)
where Vand V are the volume of the NaOH so
2.6. Indium Adsorption Property
of indium from
Table 3. Chemical composition of artificial ITO waste wa-
IEC me
NaOH HCl
tion and the consumed volume of the HCl solution, re-
spectively. CNaOH and CHCl are the concentrations of
NaOH and HCl, respectively.
lu-
Experiments examining the adsorption
pure and artificial ITO solutions (see Table 3) were con-
ducted under ambient conditions using the batch tech-
nique. The experiments examining the adsorption onto
the bifunctional poly(VPA-co-GMA-co-DVB) cation
exchange resins were performed at pH 4. The pH values
ter.
Salt Metalic
Mw Mass wt% g/L
NaCl () 35% ~ 37%
In-In(Cl)3*4H2O 293.24 114.82 0.3910.2472
Sn-Tindrate(II) chloride dihy225.60 118.74 0.5260.0168
Si-Na2O3Si 122.06 28.08 0.2300.0034
Al-AlCl *6( O)
3H2241.43 26.98 0.1110.0017
Ca-CaCl *2H2O
2128.99 40.07 0.3100.0004
Fe-Ferric pyrophosphate 745.21 55.84 0.0740.0020
wega o01
HCl or NaOH standard solution. Twenty-five milli-
mple
w
ere adjusted with a nligible mountf a 0. or 0.1
M
grams of the bifunctional poly(VPA-co-GMA-co-DVB)
cation exchange resins were immersed in a 50-mL in-
dium solution, and the cation exchange resins were
mixed with an indium solution in a shaker, which was
operated at 200 rpm for 24 hr to reach equilibrium.
The indium adsorption property was determined using
the EDTA titration method. A certain amount of sa
as immersed in a 100 mg/L indium solution, and then
40 mL was taken from the indium solution. 1-(2-Pyridy-
lazo)-2-naphtol (PAN) was used as an indicator. The
amount of adsorbed indium was calculated using Equa-
tion (5):


Amount of adsorbed indium mmol g
2.5
In inETDA EDTAresin
CV C VW (5)
where Cin and Vin are the molar concentratio
volume of the initial indium solution, respectively. C
VPA-co-GMA-co-DVB) micro-
indium were dipped into a solu-
n and the
EDTA
and VETDA are the molar concentration and the consumed
volume of the EDTA solution, respectively.
2.7. Durability Test
The bifunctional poly(
beads that had adsorbed
tion of 0.1 mol/L HCl with stirring for 4 hr at 25˚C to
Copyright © 2013 SciRes. OJPChem
C. W. HWANG ET AL.
108
desorb indium (III) ions. The solution was then filtered
and washed with water. The obtained bifunctional poly
(VPA-co-GMA-co-DVB) microbeads were used in the
adsorption experiment. This entire process was repeated
for 10 cycles to ascertain the reusability of the bifunc-
tional poly(VPA-co -GMA-co -DVB) microbeads.
3. Results and Discussion
3.1. Preparation of PVGD an
Cation-Exchange Resinsd IPVGD
VPA-co-
GMA ifunctional poly(VPA-
spectra for confirming the
ion of poly(vinyl phosphonic
Figure 2 shows the conversions of the poly(
-co-DVB) resins and the b
co-GMA-co-DVB) cation exchanger. The conversions
were calculated from Equation (1), where the initial
weights of the monomers revealed the weights before the
synthesis of the poly(VPA-co-GMA-co-DVB) resins in
the cases of both synthesis and functionalization. The
conversion was increased slightly to increase the GMA
molar ratio, and the maximum conversion was 93%. The
use of divinyl benzene (DVB) as a crosslinking agent did
not affect the conversion. However, the conversions of
the bifunctional poly(VPA-co-GMA-co-DVB) cation ex-
changer ranged between 85% and 93%, and the values
increased with increasing GMA molar ratio.
3.2. Structure Analysis
Figure 3 shows the FT-IR
structure and functionalizat
acid-co-glycidyl methacrylate-co-divinyl benzene) (PVGD)
and poly(vinyl phosphonic acid-co-glycidyl methacry-
late-co-divinyl benzene) containing iminodiacetic acid
group (IPVGD) cation exchange resins. As shown in
Figure 3(a) (PVGD spectrum), the strong broad band at
approximately 3500 cm1 was attributed to OH vibrations.
The bands resulting from methylene C-H stretching vi-
brations were observed at approximately 2941 cm1. The
strong band at 1194 cm1 was ascribed to the stretching
vibrations of P=O, and the absorption band at 965 cm1
was ascribed to the P-OH stretching band. In addition, a
strong band at 1720 cm1 resulted from C=O stretching
vibrations in GMA, and the other band at 450 - 1650
cm1 was due to stretching vibrations in the vinyl groups
of DVB. These results confirmed which PVGD cation
exchange resins were synthesized. Figure 3(b) shows the
FT IR spectrum of poly(vinyl phosphonic acid-co-gly-
cidyl methacrylate-co-divinyl benzene) containing imi-
nodiacetic acid group (IPVGD) cation exchange resins.
The strong band at 1660 cm1 was attributed to COOH
vibrations, and the intensity of the broad band at ap-
proximately 3450 cm1, which was attributed to OH, was
increased. This result confirmed which IPVGD cation
exchange resin was synthesized [16].
100
5 101520
0
20
40
60
80
PVGD
IPVGD
Conversion (%)
GMA (Wt%)
Degree of iminodiacetic acidat i on (%)
Figure 2. The effect of the GMA content on the conversion.
4000 3500 3000 2500 2000 1500 1000500
(a)
(b)
Transmittance (%)
Wa ve number Cm-1
Figure 3. FT-IR spectra of PVGD and IPVGD cation-ex-
change resin: (a) PVGD and (b) IPVGD.
D
Cation-Exchange Resins
gical evalua-
tionsons of the PVGD and
d IPVGD resins. The
ph
3.3. SEM-EDS of PVGD and IPVG
Figure 4 and Table 4 show the morpholo
and the elemental compositi
bifunctional IPVGD cation exchange resins determined
using SEM-EDS analyses. The surfaces of the resins
were smoothly spheres, and their average particle sizes
were approximately 50 μm. Figure 4 shows SEM photo-
graphs of the resins. The morphologies of the resins be-
fore and after functionalization were not observed to be
different in PVGD and IPVGD.
Table 4 shows the proportions of carbon, oxygen and
phosphorous in the PVGD an
osphorus oxygen contents were determined to be
1.00%, 1.96%, 2.68% and 3.76%, respectively, in the
PVGD resins. Their contents were increased by increas-
ing the VPA monomer ratio. Meanwhile, the oxygen
compositions for IPVGD resins were higher than that of
PVGD. Their values were 1.00%, 1.96%, 2.68% and
3.76%, respectively. These results confirmed which
Open Access OJPChem
C. W. HWANG ET AL.
Copyright © 2013 SciRes. OJPChem
109
PVGD
IPVGD
Figure 4. SEM photographs of PVGD and IPVGD resins.
Table 4. Chemical composition of
y EDS analysis. PVGD and IPVGD resins
b
Batch No Carbon(wt%) Oxygen(wt%) Phosphorus(wt%)
PVGD-1 54.84 35.37 9.79
PVGD-2 70.11 25.56 4.17
PVGD-3 66.79 27.35 5.71
PVGD-4 64.26 26.96 8.77
PVGD-5 63.08 28.74 7.04
IPVGD-1 73.20 23.39 3.41
IPVGD-2 68.52 25.30 6.18
IPVGD-3 66.32 25.61 8.07
IPVGD-4 63.03 26.97 10.00
IPVGD-5 61.20 29.40 9.40
bil IPVation exe resins were synthe-
zed using iminodiacetic acid.
Exchange Capacity
of PVGD and IPVGD Cation Exchange
Figu -
ter uthe PVGD and IPVGD resins. The water
increasing DVB contents. The
water uptakes of the IPVGD resins were higher than
PV
re per-
formed at pH 4. The cation-exchange resin was placed in
uptake was decreased with
those of PVGD because the hydrophilicity of the resins
increased due to the carboxyl group. The crosslinking
ratios were also determined to affect the water uptake of
the hydrophilic polymers. The water uptake was also
dependent on the amount of crosslinking agent. The wa-
ter uptake values decreased to a minimum of 75% as a
result of the increased crosslinking density of the resins.
The IEC provides an indication of the acid group con-
tent in the PVGD and IPVGD resins. The experimental
IEC values are given in Figure 6. This result confirmed
that the IEC values decreased. The IEC values of the
GD and IPVGD resins were 2.5 - 5.6 meq/g and 2.7 -
6.4 meq/g, respectively. In addition, the values for the
IPVGD resins were higher than those of the PVGD resins
because of the increase of the hydrophilicity due to the
introduction of the COOH groups. This result led to the
conclusion that the IPVG resins were acceptable adsorb-
ents for indium from ITO and the dilute solutions.
3.5. Indium Adsorption Properties
Adsorption isotherm experiments to examine the adsorp-
tion of indium on the cation-exchange resin we
functionaGD cchang
si
3.4. Water Uptake and Ion-
Resins
re 5 shows the effect of divinyl benzene on the wa
ptake of
C. W. HWANG ET AL.
110
0
20
40
60
80
0.00 0.10 0.200.30 0.40 0.50
V
PA conte nt
Wat er upt ak e ( % )
PVGD
IPVGD
Figure 5. The effect of DVB mole ratio on the water uptake.
Figure 6. The effect of DVB mole ratio on the ion-exchange
capacity.
contact with the solution in a shaker operating at 200 r
for the micro-bead [17-20]:
pm
nat 25˚C for 4 hr to reach equilibrium. The Langmuir ad
Freundlich equations were applied to the adsorption
quilibriae

=1
eeLm em
CqKq Cq (5)
1
eF
n
e
qKC (6)
where Ce is the equilibrium concentration (mmol/L), qe is
the adsorption capacity at equilibrium (m
qm is the maximum amount of solute exchanged per gram
of micro-beads (mmol/g resin). KL
mol/g resin) and
and KF are the Lang-
muir constant and the Freundlich constant related to the
adsorption capacity, respectively, and n is a constant to
be determined.
Figure 7 shows the experimental adsorption isotherms
of In3+ on the cation-exchange resin. Figures 8(a) and (b)
are the linear plots of the Freundlich and Langmuir mod-
els obtained from the experimental data in Figure 7. All
constants derived from Figure 7 are listed in Table 3.
Finally, the Langmuir and Freundlich models calculated
from the data in Table 5 are also illustrated in Figure 7.
The Langmuir constants, such as KL and qm, were ob-
tained using the linear plot of ee
Cq vs. Ce from Equa-
0
0.2
0.4
0.6
0.8
e sin)
0123456
C
e
(mmol/L)
q
e
(mmol/g r
IPVGD2IPVGD3 IPVGD4
IPVGD5 IPVGD6
Figure 7. Adsorption isotherms of In3+ onto the cation-ex-
change resin by (a) Freundlich and (b) Langmuir model.
(a)
(b)
Figure 8. Isotherm analyses of the adsorption of In3+ onto
the cation-exchange resin by (a) Freundlich and (b) Lang-
muir model.
tion (5), and the Freundlicnstants, such as KF and n,
in Figure 7, the experimental data corre-
onded better to the Langmuir model. A basic assump-
at specific, homogeneous sites in the adsorbent; thus, it is
h co
were determined with the plot of logqe vs. logCe from
Equation (6).
As shown
sp
tion of the Langmuir model is that the adsorption occurs
Open Access OJPChem
C. W. HWANG ET AL. 111
Table 5. Isotherm constants for the adsorption of In3+ onto
the cation-exchange resin.
Langmuir model Freundlich model
Sample
code KL qm R2 KF n R2
IPVGD2 6.647 0.359 0.997 0.518 4.390 0.856
IPVGD3
IPVGD4
5.767
5.404
0.409
0.486
0.993 0.564 4.146 0.829
IPVGD5
IPVGD6
4.36
5. 0.
0.991
0.
0.584
0.5
0.
4.103
4.
0.876
4
0.
9 0.539 0.994
130 614 996
16 3.255 0.87
436 047 881
ctoo sn,ree
F crli oe-
naeadogt -
gn. teuh
m lmy. -
re, the adsorption behavior of In3+ on the IPVGD
istance
ows the result for
he PVGD and IPVGD resins.
VGD and IPVGD resins were
of the maximum sorption capacities according to
es was obtained from Equation
he maximum sorption capacity of
onfined a mnolayer of adorptio wheas th
reundlich modelonsides equibriumn a h teroge
eous surfce, whre the sorptin enery is nohomo
eneous for all adsorptio sitesThus, he Frndlic
odel can be appied to ulti-laer adsorptionThere
fo
cation-exchange resin is considered to be the adsorption
of a monolayer.
The maximum value of qm, the maximum amount of
solute exchanged per gram of poly(GMA-co-PEGDA)
microbeads, was attained at a 90% molar ratio of GMA,
and the value was 0.614 mmol/g resin.
3.6. Acidic Res
The indium adsorbents endured in the strong acid solu-
tion because the pH of the ITO etching solution was low.
Thus, this experiment measured the acid resistance of the
PVGD and IPVGD resins. Figure 9 sh
the acidic resistance for t
The weight losses of the P
minimal. According to this result, the PVGD and IPVGD
resins were very excellent in the low pH solution. In
general, the acidic resistance was influenced by the de-
gree of crosslinking of the resins. The degree of
crosslinking of the PVGD and IPVGD resins increased
with increasing DVB content in the resins. When the
degree of crosslinking was increased, the skeletal struc-
ture of the resins increased the rigidity. Thus, the me-
chanical strength was higher than that before crosslink-
ing.
3.7. Durability
The durability was also investigated. The maximum
sorption capacity changes of indium versus the number
of reuses are provided in Figure 10 for up to 10 reuses.
Each
the number of reuse tim
(6). It is observed that t
indium onto PVGD and IPVGD decreased only slightly
with an increasing number of reuse times, which indi-
cates that the prepared microbeads have a good reusabil-
ity.
70
80
90
100
12345678910
0
10
20
30
40
50
60
Weight Loss (%)
PVGD
Time (hr)
IPVGD
Figure 9. Acidic resistance of PVGD and IPVGD resins
against 5% HCl.
12345678910
0
50
100
150
200
350
400
450
250
300
Amount of IN +3 (mmol/g)
PVGD
Cycle No
IPVGD
Figure 10. The effect of cycleization number on the durabil-
ity onto PVGD and IPVGD resins for 30 minutes.
4. Conclusion
PVGD and IPVGD, which have indium ion selectivities,
MA-co-
anger ranged between 85% and 93%,
creased with increasing GMA molar
were synthesized by suspension polymerization and the
indium adsorption properties were investigated. The
conversions of the bifunctional poly(VPA-co-G
ir
DVB) cation exch
and the values in
ratio. The synthesized PVGD and IPVGD resins were
characterized using Fourier transform infrared (FTIR)
spectroscopy, scanning electron microscopy (SEM), and
energy-dispersive X-ray spectroscopy (EDS). According
to the FTIR result, it was confirmed that the IPVGD
cation exchange resin was synthesized. The surfaces of
the resins were wrinkled spheres, and their average parti-
cle sizes were approximately 50 μm. However, the mor-
phology of resins before and after functionalization did
not show a difference between PVGD from IPVGD. The
contents were increased by increasing the VPA monomer
ratio. The water uptakes of IPVGD resins were higher
than those of PVGD because the hydrophilicity of the
resins increased due to the carboxyl group. The IEC val-
Copyright © 2013 SciRes. OJPChem
C. W. HWANG ET AL.
Open Access OJPChem
112
ant number (2013008092))
05
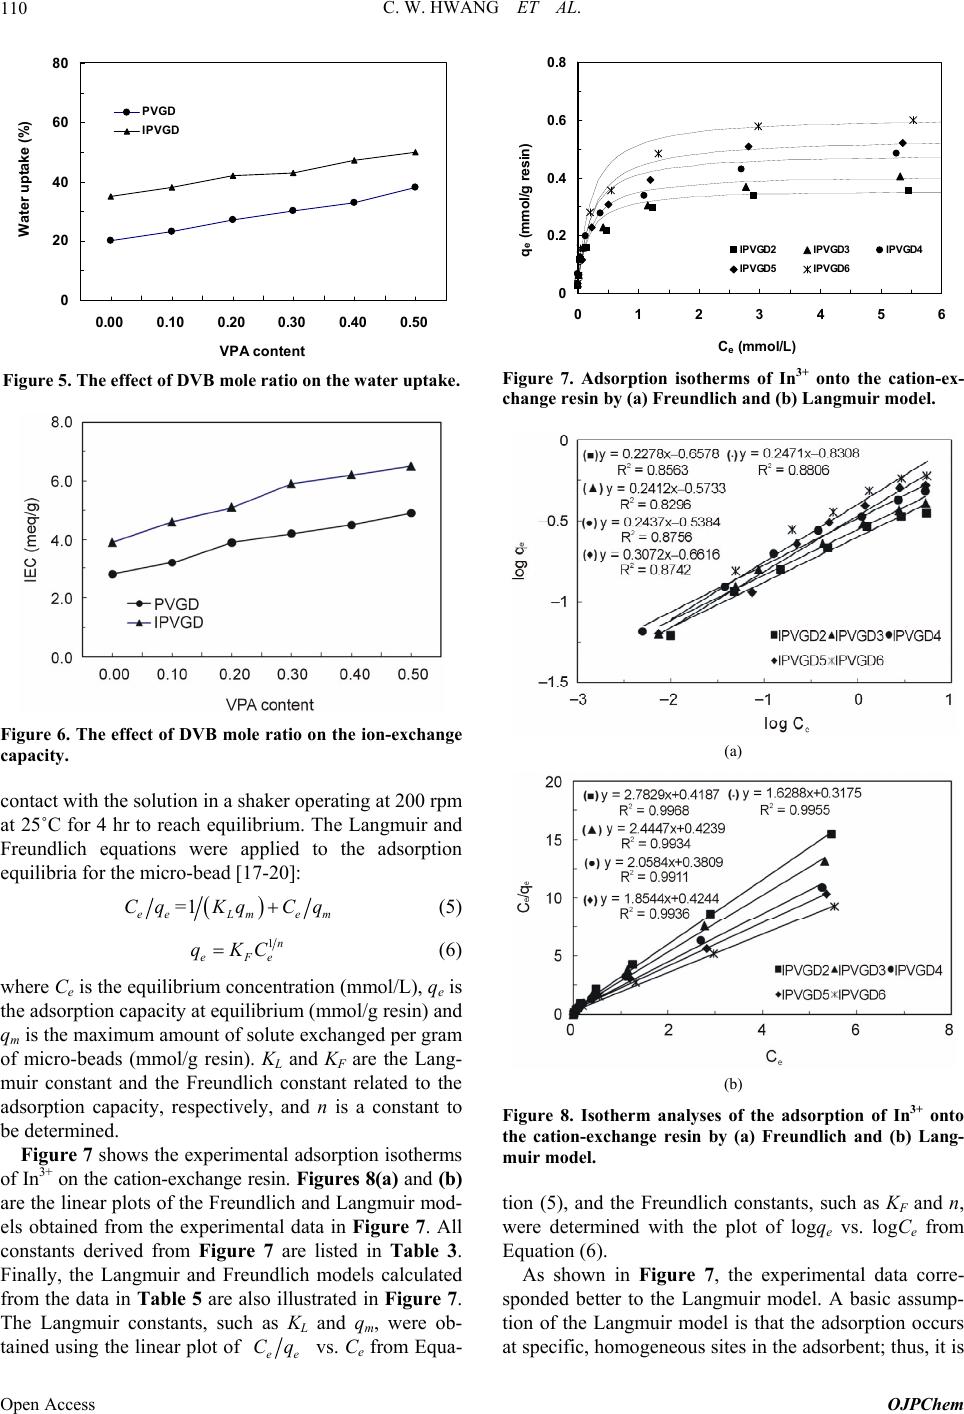
ues increased as the DVB concentration decreased,
which was accompanied by a consequential increase in
the GMA concentration. When the degree of crosslinking
was increased, the skeletal structure of the resins in-
creased in rigidity.
5. Acknowledgements
This research was supported by the Pioneer Research
Center Program through the National Research Founda-
tion of Korea funded by the Ministry of Science, ICT &
Future Planning (gr
REFERENCES
[1] S. Virolainene, D. Ibana and E. Paatero, “Recovery of
Indium from Indium Tin Oxide by Solvent Extraction,”
Hydrometallurgy, Vol. 107, No. 1, 2011, pp. 56-61.
http://dx.doi.org/10.1016/j.hydromet.2011.01.0
[2] T. Kato, S. IgIshiwatari, M. Fu-
rukawa and H Concentr
arashi, Y. Ishiwatari,Y.
. Yamaguchi, “Separation anda-
tion of Indium from a Liquid Crystal Display via Homo-
geneous Liquid-Liquid Extraction,” Hydrometallurgy,
Vol. 137, 2013, pp. 148-155.
http://dx.doi.org/10.1016/j.hydromet.2013.06.004
[3] H. Hasegawa, I. M. M. Rahman, Y. Egawa and H. Sawai,
“Chelant-Induced Reclamation of Indium from the Spent
Liquid Crystal Display Panels with the Aid of Microwave
Irradiation,” Journal of Hazardous Materials, Vol. 254-
255, 2013, pp. 10-17.
[4] J. Ruan, Y. Guo and Q. Qiao, “Recovery of Indium from
Scrap TFT-LCDs by Solvent Extaction,” Procedia Envi-
ronmental Sciences, Vol. 16, 2012, pp. 545-551.
[5] H. Minamisawa, K. Murashima, M. Minamisawa, N. Arai
and T. Okutani, “Determination of Indium by Graphite
Furnace Atomic Absorption Spectrometry after Copreci-
pitation with Chitosan,” Anaytical Sciences, Vol. 19, No.
3, 2003, pp. 401-404.
http://dx.doi.org/10.2116/analsci.19.401
[6] M. Tuzen and M. Soylak, “A Solid Phase Extraction Pro-
cedure for Indium Prior to Its Graphite Furnace Atomic
Absorption Spectrometric Determination,” Journal of Ha-
zardous Materials, Vol. 129, No. 1, 2006, pp. 179-185.
http://dx.doi.org/10.1016/j.jhazmat.2005.08.031
[7] I. M. M. Kenawy, M. A. H. Hafez and S. A. Elw
ry of
aness,
“Preconcentration and Separation by Electrodeposition of
Indium from Its Different Solution Complexes,” Bulletin
de la Société Chimique de France, Vol. 5, 1991, pp. 677-
683.
[8] H. Liu, C. Wu, Y. Lin and C. Chiang, “Recove In-
dium from Etching Wastewater Using Supercritical Car-
bon Dioxide Extraction,” Journal of Hazardous Materials,
Vol. 172, No. 2-3, 2009, pp. 744-748.
http://dx.doi.org/10.1016/j.jhazmat.2009.07.098
[9] W. Chou and Y. Huang, “Electrochemical Removal of
.
muth,
ca Acta Part B,
Indium Ions from Aqueous Solution Using Iron Elec-
trodes,” Vol. 172, No. 1, 2009, pp. 46-53
[10] O. Acar and A. R. Türker, “Determination of Bis
Indium and Lead in Spiked Sea Water by Electrothermal
Atomic Absorption Spectrometry Using Tungsten Con-
taining Chemical Modifiers,” Spectrochimi
Vol. 55, No. 10, 2000, pp. 1635-1641.
http://dx.doi.org/10.1016/S0584-8547(00)00258-5
[11] N. Kabay, S. Sarp, M. Yuksel, Ö. Arar and M. Bryjak,
“Removal of Boron from Seawater by Selective Ion Ex-
change Resins,” Reactive & Functional Polymers
2007, pp. 1643-1650.
, Vol. 67,
http://dx.doi.org/10.1016/j.reactfunctpolym.2007.07.033
[12] M. Tuzen and M. Soylak, “A Solid Phase Extraction Pro-
cedure for Indium Prior to Its Graphite Furnace Atomic
Absorption Spectrometr
zardous Materials, Vol. 129, No. 1, 2006, pp. 179-185.
ic Determination,” Journal of Ha-
http://dx.doi.org/10.1016/j.jhazmat.2005.08.031
[13] F. M. B. Coutinho, D. L. Carvalho, M. L. L. T. Aponte
and C. C. R. Barbosa, “Pellicular Ion Exchange Resins
Based on Divinylbenzene and 2-Vinylpyridine,” Polymer
Vol. 42, No. 1, 2001, pp. 43-48.
,
http://dx.doi.org/10.1016/S0032-3861(00)00343-8
[14] K. S. Shin, E. M. Choi and T. S. Hwang, “Preparation and
Characterization of Ion-Exchange Membrane Using Sty/
HEA/LMA Terpolymer via Post-S
tion, Vol. 263, No. 1, 2010, pp. 151-158.
ulfonation,” Desalina-
http://dx.doi.org/10.1016/j.desal.2010.06.052
[15] Z. Wang, H. Ni, M. Zhang, C. Zhao and H. Na, “Prepara-
tion and Characterization of Sulfonated Poly(arlyene ether
ketone sulfone)s for Ion Exchange Membr
nation, Vol. 242, No. 1-3, 2009, pp. 236-244
anes,” Desali-
http://dx.doi.org/10.1016/j.desal.2008.05.003
[16] R. M. Silverstein, F. X. Webster and D. J. Kiemle, “Spec-
trometric Identification of Organic Compounds,” John
Wiley & Sons, Inc., New York, 2005.
[17] W. Lin, L. T. Biegler and A. M. Jacobson, “Modeling and
Optimization of a Seeded Suspension Polymerization
Process,” Chemical Engineering Science, Vol. 65, No. 15,
2010, pp. 4350-4362.
http://dx.doi.org/10.1016/j.ces.2010.03.052
[18] K. Jia, B. Pan, Q. Zhang, W. Zhang, P. Jiang, C. Hong, B.
Pan and Q. Zhang, “Adsorption of Pb2+, Zn2+, and Cd2+
from Waters by Amorp
nal of Colloid and Interface Science, Vol.
hous Titanium Phosphate,” Jour-
318, No. 2,
2008, pp. 160-166.
http://dx.doi.org/10.1016/j.jcis.2007.10.043
[19] C. A. P. Almeida, A. dos Santos, S. Jaerger, N. A. De-
bacher and N. P. Hankins, “Mineral Waste from Coal
Mining for Removal
Solutions,” Desalination, Vol. 264, No. 3, 20
of Astrazon Red Dye from Aqueous
10, pp. 181-
187. http://dx.doi.org/10.1016/j.desal.2010.09.023
[20] B. Mandal and N. Ghosh, “Extraction Chromatographic
Method of Preconcentration and Separation of Lead (II)
with High Molecular Mass Liquid Cation Exchanger,”
Desalination, Vol. 250, No. 2, 2010, pp. 506-514.
http://dx.doi.org/10.1016/j.desal.2009.06.050