 International Journal of Analytical Mass Spectrometry and Chromatography, 2013, 1, 11-21 http://dx.doi.org/10.4236/ijamsc.2013.11003 Published Online September 2013 (http://www.scirp.org/journal/ijamsc) Tea Identification through Surface-Assisted Laser Desorption/Ionization Mass Spectrometry Wen-Tsen Chen, Huan-Tsung Chang* Department of Chemistry, National Taiwan University, Taipei, Taiwan Email: *changht@ntu.edu.tw Received July 7, 2013; revised August 9, 2013; accepted September 4, 2013 Copyright © 2013 Wen-Tsen Chen, Huan-Tsung Chang. This is an open access article distributed under the Creative Commons At- tribution License, which permits unrestricted use, distribution, and reproduction in any medium, provided the original work is prop- erly cited. ABSTRACT We have applied surface-assisted laser desorption/ionization mass spectrometry (SALDI-MS) using titanium dioxide nanoparticles (TiO2 NPs) as the matrix and captopril (CAP) as internal standard for the determination of the concentra- tions of theanine and four catechins—catechin, (_)-epigallocatechin (EGC), (_)-epicatechin gallate (ECG), and (_)-epi- gallocatechin gallate (EGCG). Under the optimal conditions (240 nM TiO2 NPs and 10 μM CAP), this SALDI-MS ap- proach provides linearity of 0.3 – 80 (r = 0.990), 1.2 – 100 (r = 0.987), 4 – 120 (r = 0.995), 6 – 120 (r = 0.983), and 2 – 120 μM (r = 0.991) for theanine, catechin, EGC, ECG, and EGCG, respectively. The limits of detection (LODs; S/N = 3) for theanine, catechin, EGC, ECG, and EGCG provided by this SALDI-MS approach are 0.1, 0.35, 1.0, 1.45, and 0.5 μM, respectively. This approach provides spot-to-spot and batch-to-batch variations of less than 10% and 13%, respec- tively, for the analysis of tea samples. With advantages of simplicity, accuracy, precision, and great reproducibility, we have applied the SALDI-MS approach for the analysis of tea samples, with identified peaks for theanine, catechin, EGC, ECG, and EGCG. Tea samples from Taiwan and four other areas have various SALDI-MS profiles, showing their po- tential for differentiation of tea samples from different sources. Our result also shows that tea samples harvested in dif- ferent seasons and counties in Taiwan provide significantly different MS profiles. The amounts of theanine and EGC in the Oolong tea from Lishan are much higher than those in the other tea samples. Keywords: Tea Samples; TiO2 NPs; SALDI-MS; Catechins; Theanine; Captopril 1. Introduction Matrix-assisted laser desorption/ionization mass spec- trometry (MALDI-MS) is a powerful tool for biochemi- cal analysis, in which analytes undergo soft and efficient desorption/ionization with a minimum degree of frag- mentation as a result of rapid energy transfer from UV-absorbing matrixes [1-3]. Although MALDI-MS has been successfully used for the analyses of variety of molecules, especially peptides and proteins, it has sig- nificant limitation on the analysis of small molecules, due to the interferences of matrix background ions in the low molecular weight region (<500 Da) [4,5]. Inhomo- geneous co-crystallization of analytes with traditional organic matrixes such as 2,5-dihydroxybenzoic acid (DHB) usually causes high spot-to-spot and sample-to- sample variations. To overcome problems of “sweet spots”, surface-assisted laser desorption/ionization mass spectrometry (SALDI-MS) has been demonstrated [6-8]. Several nanomaterials, including Au [9-11], Ag [12], carbon nanotubes [13], SiO2 [14], TiO2 [15], HgTe nanostructures [16-18], and Fe3O4 [19], have been em- ployed in SALDI-MS. These NPs absorb energy from laser irradiation and then transfer it to the analytes to induce desorption and ionization. Tea is one of the most popular beverages in the world, which contains great amounts of flavanols, flavonoids, polyphenols, and catechins [20,21]. The major tea cate- chins known to possess biological (antioxidant) activity are (+)-catechin, (−)-epicatechin (EC), (−)-epigallocate- chin (EGC), (−)-epigallocatechin gallate (EGCG), and (−)- epicatechin gallate (ECG). In addition to catechins, tea contains great amounts of amino acids, caffeine, and ascorbic acid. Their amounts usually vary depending on species, season, climate, horticultural conditions, and the degree of fermentation during the manufacturing process [22]. Several analytical methods have been applied to determine important tea components, including nuclear magnetic resonance (NMR) [23], high performance thin *Corresponding author. C opyright © 2013 SciRes. IJAMSC 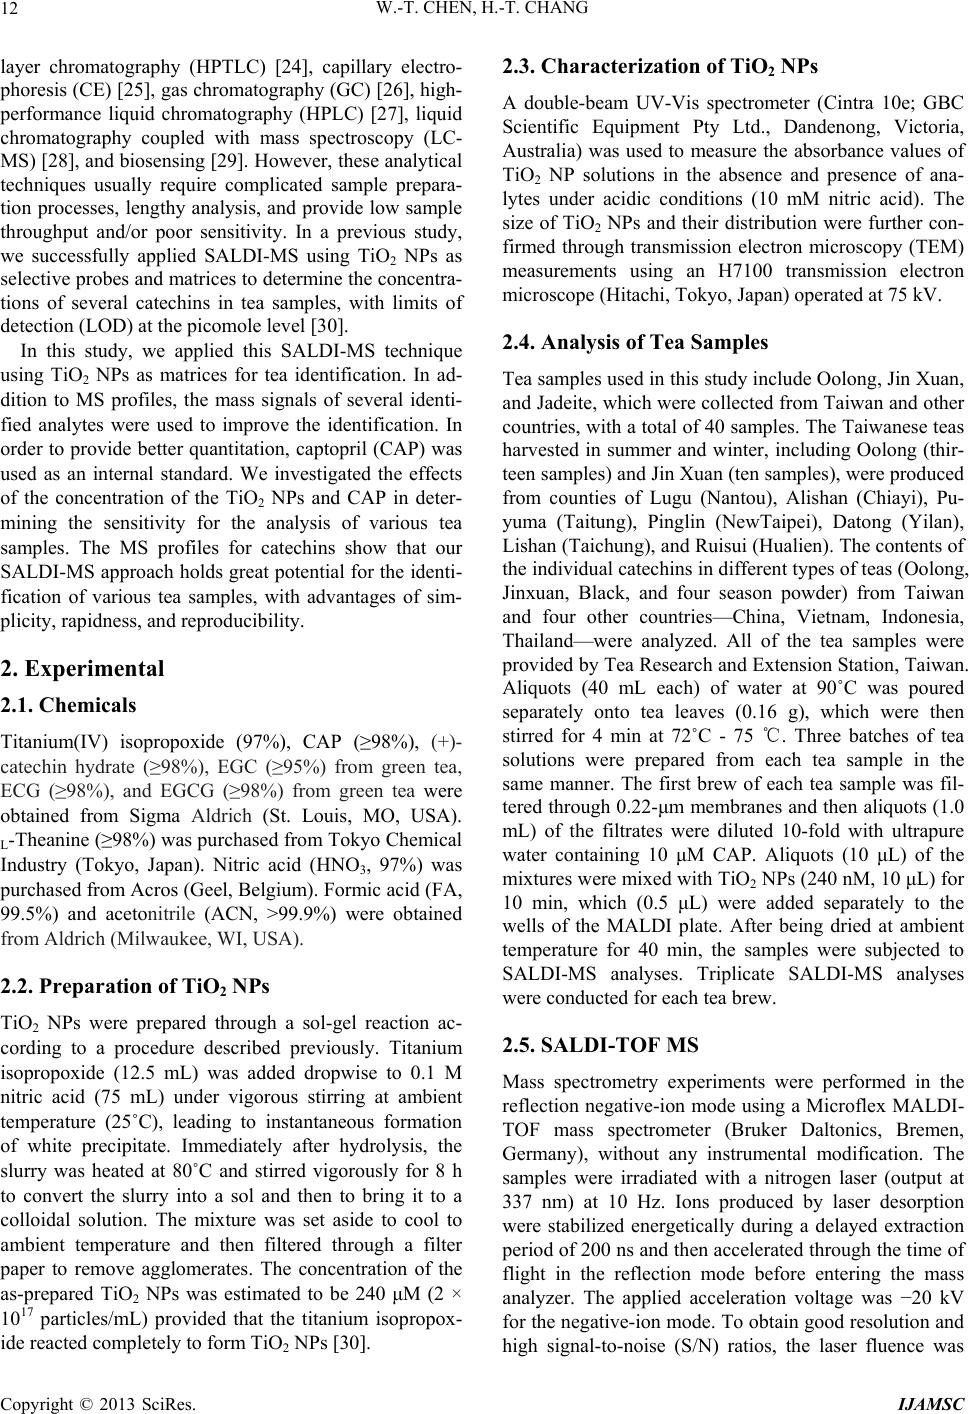 W.-T. CHEN, H.-T. CHANG 12 layer chromatography (HPTLC) [24], capillary electro- phoresis (CE) [25], gas chromatography (GC) [26], high- performance liquid chromatography (HPLC) [27], liquid chromatography coupled with mass spectroscopy (LC- MS) [28], and biosensing [29]. However, these analytical techniques usually require complicated sample prepara- tion processes, lengthy analysis, and provide low sample throughput and/or poor sensitivity. In a previous study, we successfully applied SALDI-MS using TiO2 NPs as selective probes and matrices to determine the concentra- tions of several catechins in tea samples, with limits of detection (LOD) at the picomole level [30]. In this study, we applied this SALDI-MS technique using TiO2 NPs as matrices for tea identification. In ad- dition to MS profiles, the mass signals of several identi- fied analytes were used to improve the identification. In order to provide better quantitation, captopril (CAP) was used as an internal standard. We investigated the effects of the concentration of the TiO2 NPs and CAP in deter- mining the sensitivity for the analysis of various tea samples. The MS profiles for catechins show that our SALDI-MS approach holds great potential for the identi- fication of various tea samples, with advantages of sim- plicity, rapidness, and reproducibility. 2. Experimental 2.1. Chemicals Titanium(IV) isopropoxide (97%), CAP (≥98%), (+)- catechin hydrate (≥98%), EGC (≥95%) from green tea, ECG (≥98%), and EGCG (≥98%) from green tea were obtained from Sigma Aldrich (St. Louis, MO, USA). L-Theanine (≥98%) was purchased from Tokyo Chemical Industry (Tokyo, Japan). Nitric acid (HNO3, 97%) was purchased from Acros (Geel, Belgium). Formic acid (FA, 99.5%) and acetonitrile (ACN, >99.9%) were obtained from Aldrich (Milwaukee, WI, USA). 2.2. Preparation of TiO2 NPs TiO2 NPs were prepared through a sol-gel reaction ac- cording to a procedure described previously. Titanium isopropoxide (12.5 mL) was added dropwise to 0.1 M nitric acid (75 mL) under vigorous stirring at ambient temperature (25˚C), leading to instantaneous formation of white precipitate. Immediately after hydrolysis, the slurry was heated at 80˚C and stirred vigorously for 8 h to convert the slurry into a sol and then to bring it to a colloidal solution. The mixture was set aside to cool to ambient temperature and then filtered through a filter paper to remove agglomerates. The concentration of the as-prepared TiO2 NPs was estimated to be 240 μM (2 × 10¹⁷ particles/mL) provided that the titanium isopropox- ide reacted completely to form TiO2 NPs [30]. 2.3. Characterization of TiO2 NPs A double-beam UV-Vis spectrometer (Cintra 10e; GBC Scientific Equipment Pty Ltd., Dandenong, Victoria, Australia) was used to measure the absorbance values of TiO2 NP solutions in the absence and presence of ana- lytes under acidic conditions (10 mM nitric acid). The size of TiO2 NPs and their distribution were further con- firmed through transmission electron microscopy (TEM) measurements using an H7100 transmission electron microscope (Hitachi, Tokyo, Japan) operated at 75 kV. 2.4. Analysis of Tea Samples Tea samples used in this study include Oolong, Jin Xuan, and Jadeite, which were collected from Taiwan and other countries, with a total of 40 samples. The Taiwanese teas harvested in summer and winter, including Oolong (thir- teen samples) and Jin Xuan (ten samples), were produced from counties of Lugu (Nantou), Alishan (Chiayi), Pu- yuma (Taitung), Pinglin (NewTaipei), Datong (Yilan), Lishan (Taichung), and Ruisui (Hualien). The contents of the individual catechins in different types of teas (Oolong, Jinxuan, Black, and four season powder) from Taiwan and four other countries—China, Vietnam, Indonesia, Thailand—were analyzed. All of the tea samples were provided by Tea Research and Extension Station, Taiwan. Aliquots (40 mL each) of water at 90˚C was poured separately onto tea leaves (0.16 g), which were then stirred for 4 min at 72˚C - 75 ℃. Three batches of tea solutions were prepared from each tea sample in the same manner. The first brew of each tea sample was fil- tered through 0.22-μm membranes and then aliquots (1.0 mL) of the filtrates were diluted 10-fold with ultrapure water containing 10 μM CAP. Aliquots (10 μL) of the mixtures were mixed with TiO2 NPs (240 nM, 10 μL) for 10 min, which (0.5 μL) were added separately to the wells of the MALDI plate. After being dried at ambient temperature for 40 min, the samples were subjected to SALDI-MS analyses. Triplicate SALDI-MS analyses were conducted for each tea brew. 2.5. SALDI-TOF MS Mass spectrometry experiments were performed in the reflection negative-ion mode using a Microflex MALDI- TOF mass spectrometer (Bruker Daltonics, Bremen, Germany), without any instrumental modification. The samples were irradiated with a nitrogen laser (output at 337 nm) at 10 Hz. Ions produced by laser desorption were stabilized energetically during a delayed extraction period of 200 ns and then accelerated through the time of flight in the reflection mode before entering the mass analyzer. The applied acceleration voltage was −20 kV for the negative-ion mode. To obtain good resolution and high signal-to-noise (S/N) ratios, the laser fluence was Copyright © 2013 SciRes. IJAMSC 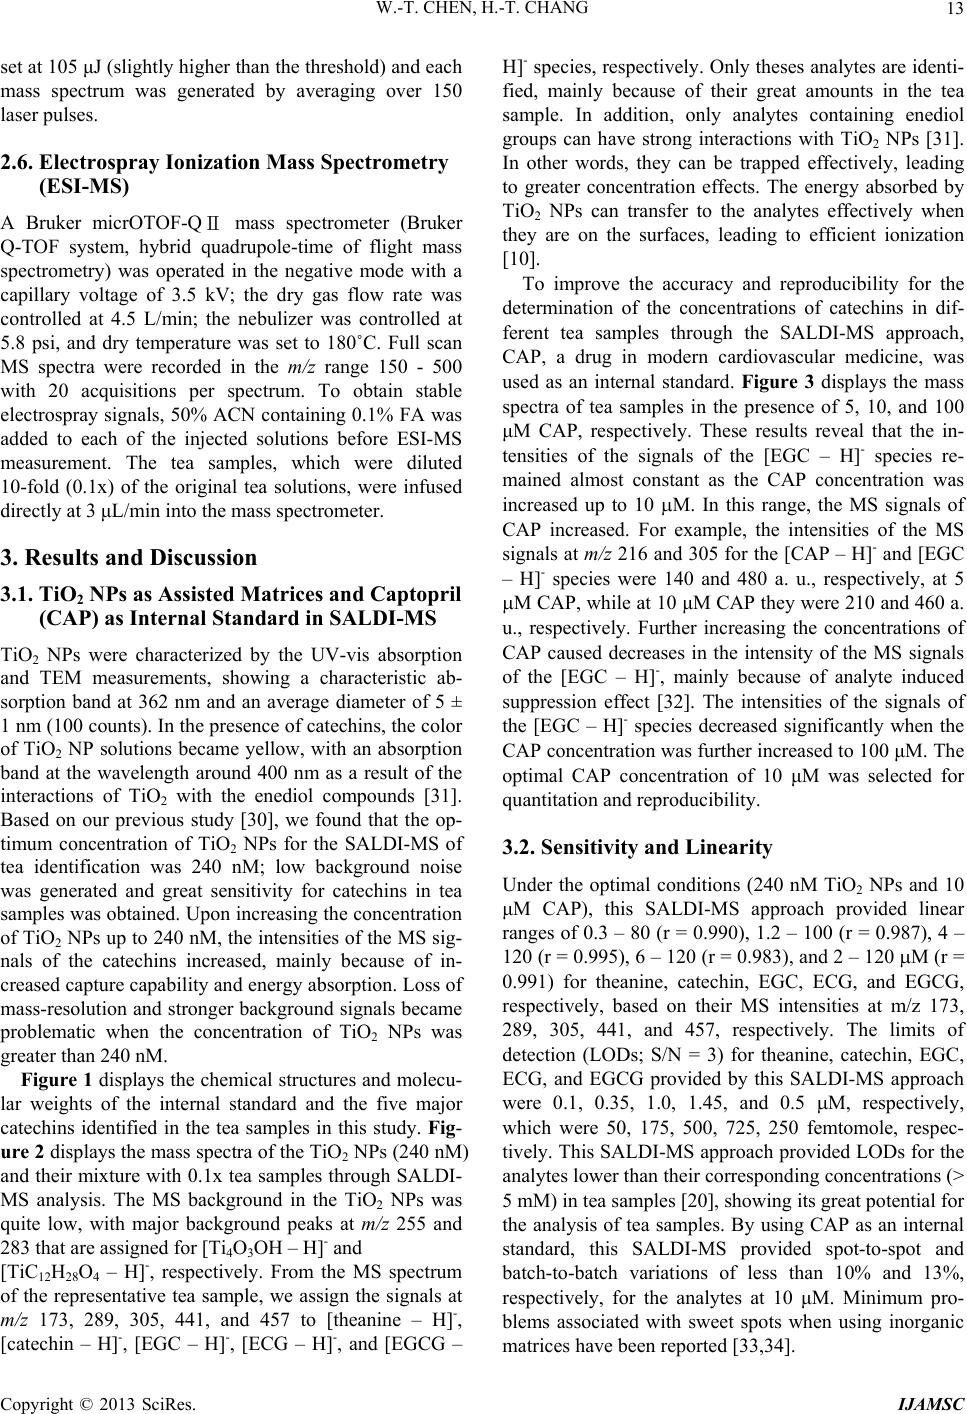 W.-T. CHEN, H.-T. CHANG 13 set at 105 μJ (slightly higher than the threshold) and each mass spectrum was generated by averaging over 150 laser pulses. 2.6. Electrospray Ionization Mass Spectrometry (ESI-MS) A Bruker micrOTOF-QⅡ mass spectrometer (Bruker Q-TOF system, hybrid quadrupole-time of flight mass spectrometry) was operated in the negative mode with a capillary voltage of 3.5 kV; the dry gas flow rate was controlled at 4.5 L/min; the nebulizer was controlled at 5.8 psi, and dry temperature was set to 180˚C. Full scan MS spectra were recorded in the m/z range 150 - 500 with 20 acquisitions per spectrum. To obtain stable electrospray signals, 50% ACN containing 0.1% FA was added to each of the injected solutions before ESI-MS measurement. The tea samples, which were diluted 10-fold (0.1x) of the original tea solutions, were infused directly at 3 μL/min into the mass spectrometer. 3. Results and Discussion 3.1. TiO2 NPs as Assisted Matrices and Captopril (CAP) as Internal Standard in SALDI-MS TiO2 NPs were characterized by the UV-vis absorption and TEM measurements, showing a characteristic ab- sorption band at 362 nm and an average diameter of 5 ± 1 nm (100 counts). In the presence of catechins, the color of TiO2 NP solutions became yellow, with an absorption band at the wavelength around 400 nm as a result of the interactions of TiO2 with the enediol compounds [31]. Based on our previous study [30], we found that the op- timum concentration of TiO2 NPs for the SALDI-MS of tea identification was 240 nM; low background noise was generated and great sensitivity for catechins in tea samples was obtained. Upon increasing the concentration of TiO2 NPs up to 240 nM, the intensities of the MS sig- nals of the catechins increased, mainly because of in- creased capture capability and energy absorption. Loss of mass-resolution and stronger background signals became problematic when the concentration of TiO2 NPs was greater than 240 nM. Figure 1 displays the chemical structures and molecu- lar weights of the internal standard and the five major catechins identified in the tea samples in this study. Fig- ure 2 displays the mass spectra of the TiO2 NPs (240 nM) and their mixture with 0.1x tea samples through SALDI- MS analysis. The MS background in the TiO2 NPs was quite low, with major background peaks at m/z 255 and 283 that are assigned for [Ti4O3OH – H]- and [TiC12H28O4 – H]-, respectively. From the MS spectrum of the representative tea sample, we assign the signals at m/z 173, 289, 305, 441, and 457 to [theanine – H]-, [catechin – H]-, [EGC – H]-, [ECG – H]-, and [EGCG – H]- species, respectively. Only theses analytes are identi- fied, mainly because of their great amounts in the tea sample. In addition, only analytes containing enediol groups can have strong interactions with TiO2 NPs [31]. In other words, they can be trapped effectively, leading to greater concentration effects. The energy absorbed by TiO2 NPs can transfer to the analytes effectively when they are on the surfaces, leading to efficient ionization [10]. To improve the accuracy and reproducibility for the determination of the concentrations of catechins in dif- ferent tea samples through the SALDI-MS approach, CAP, a drug in modern cardiovascular medicine, was used as an internal standard. Figure 3 displays the mass spectra of tea samples in the presence of 5, 10, and 100 μM CAP, respectively. These results reveal that the in- tensities of the signals of the [EGC – H]- species re- mained almost constant as the CAP concentration was increased up to 10 M. In this range, the MS signals of CAP increased. For example, the intensities of the MS signals at m/z 216 and 305 for the [CAP – H]- and [EGC – H]- species were 140 and 480 a. u., respectively, at 5 M CAP, while at 10 μM CAP they were 210 and 460 a. u., respectively. Further increasing the concentrations of CAP caused decreases in the intensity of the MS signals of the [EGC – H]-, mainly because of analyte induced suppression effect [32]. The intensities of the signals of the [EGC – H]- species decreased significantly when the CAP concentration was further increased to 100 μM. The optimal CAP concentration of 10 μM was selected for quantitation and reproducibility. 3.2. Sensitivity and Linearity Under the optimal conditions (240 nM TiO2 NPs and 10 μM CAP), this SALDI-MS approach provided linear ranges of 0.3 – 80 (r = 0.990), 1.2 – 100 (r = 0.987), 4 – 120 (r = 0.995), 6 – 120 (r = 0.983), and 2 – 120 M (r = 0.991) for theanine, catechin, EGC, ECG, and EGCG, respectively, based on their MS intensities at m/z 173, 289, 305, 441, and 457, respectively. The limits of detection (LODs; S/N = 3) for theanine, catechin, EGC, ECG, and EGCG provided by this SALDI-MS approach were 0.1, 0.35, 1.0, 1.45, and 0.5 M, respectively, which were 50, 175, 500, 725, 250 femtomole, respec- tively. This SALDI-MS approach provided LODs for the analytes lower than their corresponding concentrations (> 5 mM) in tea samples [20], showing its great potential for the analysis of tea samples. By using CAP as an internal standard, this SALDI-MS provided spot-to-spot and batch-to-batch variations of less than 10% and 13%, respectively, for the analytes at 10 μM. Minimum pro- blems associated with sweet spots when using inorganic matrices have been reported [33,34]. Copyright © 2013 SciRes. IJAMSC 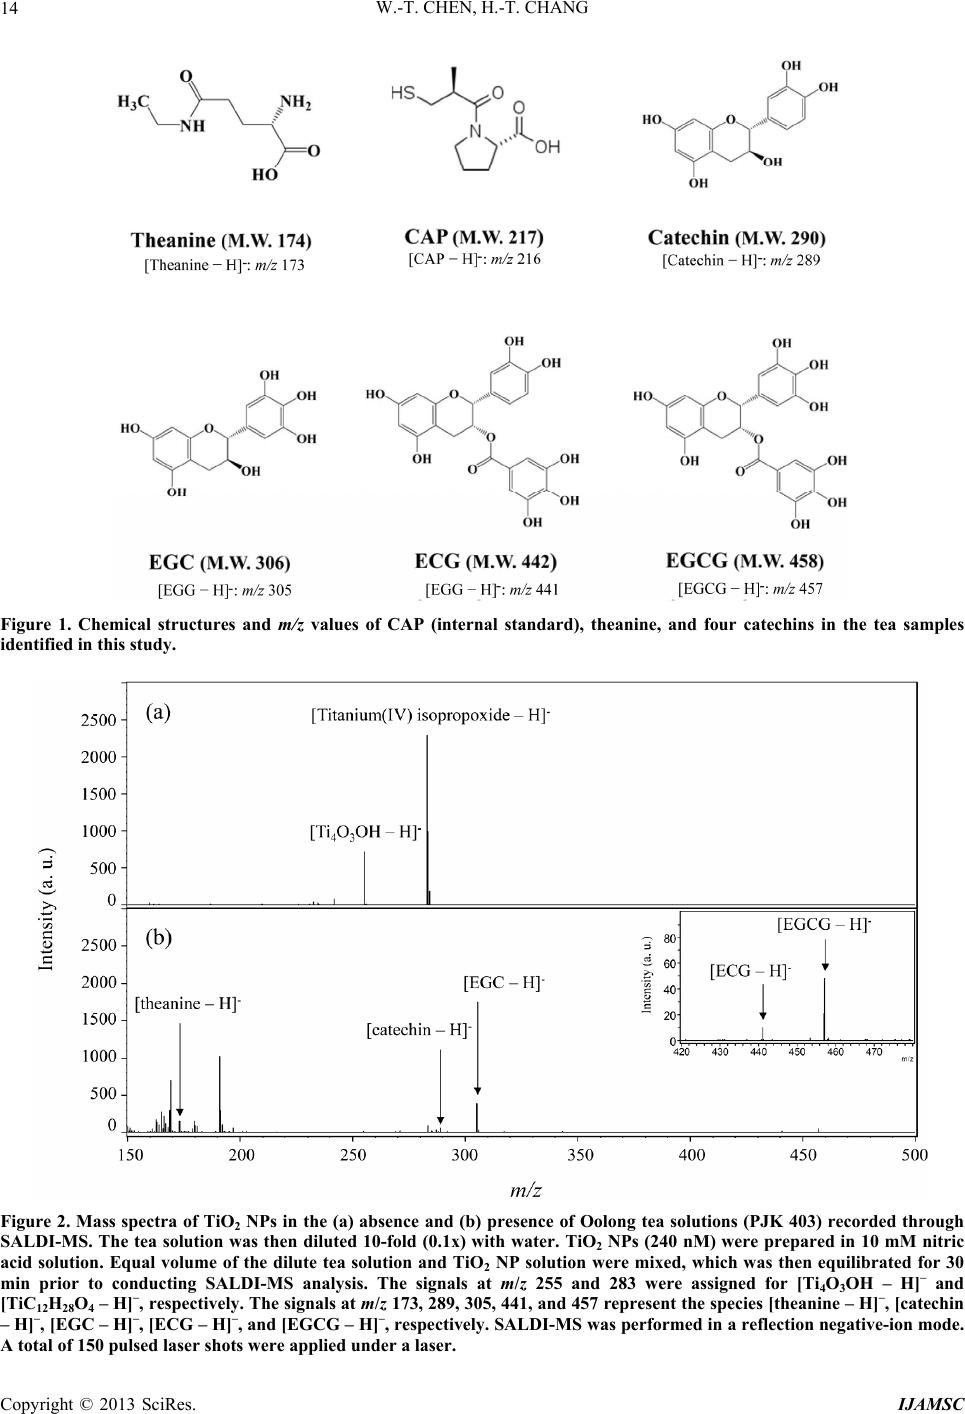 W.-T. CHEN, H.-T. CHANG Copyright © 2013 SciRes. IJAMSC 14 Figure 1. Chemical structures and m/z values of CAP (internal standard), theanine, and four catechins in the tea samples identified in this study. Figure 2. Mass spectra of TiO2 NPs in the (a) absence and (b) presence of Oolong tea solutions (PJK 403) recorded through SALDI-MS. The tea solution was then diluted 10-fold (0.1x) with water. TiO2 NPs (240 nM) were prepared in 10 mM nitric acid solution. Equal volume of the dilute tea solution and TiO2 NP solution were mixed, which was then equilibrated for 30 min prior to conducting SALDI-MS analysis. The signals at m/z 255 and 283 were assigned for [Ti4O3OH – H]– and [TiC12H28O4 – H]–, respectively. The signals at m/z 173, 289, 305, 441, and 457 represent the species [theanine – H]–, [catechin – H]–, [EGC – H]–, [ECG – H]–, and [EGCG – H]–, respectively. SALDI-MS was performed in a reflection negative-ion mode. A total of 150 pulsed laser shots were applied under a laser. 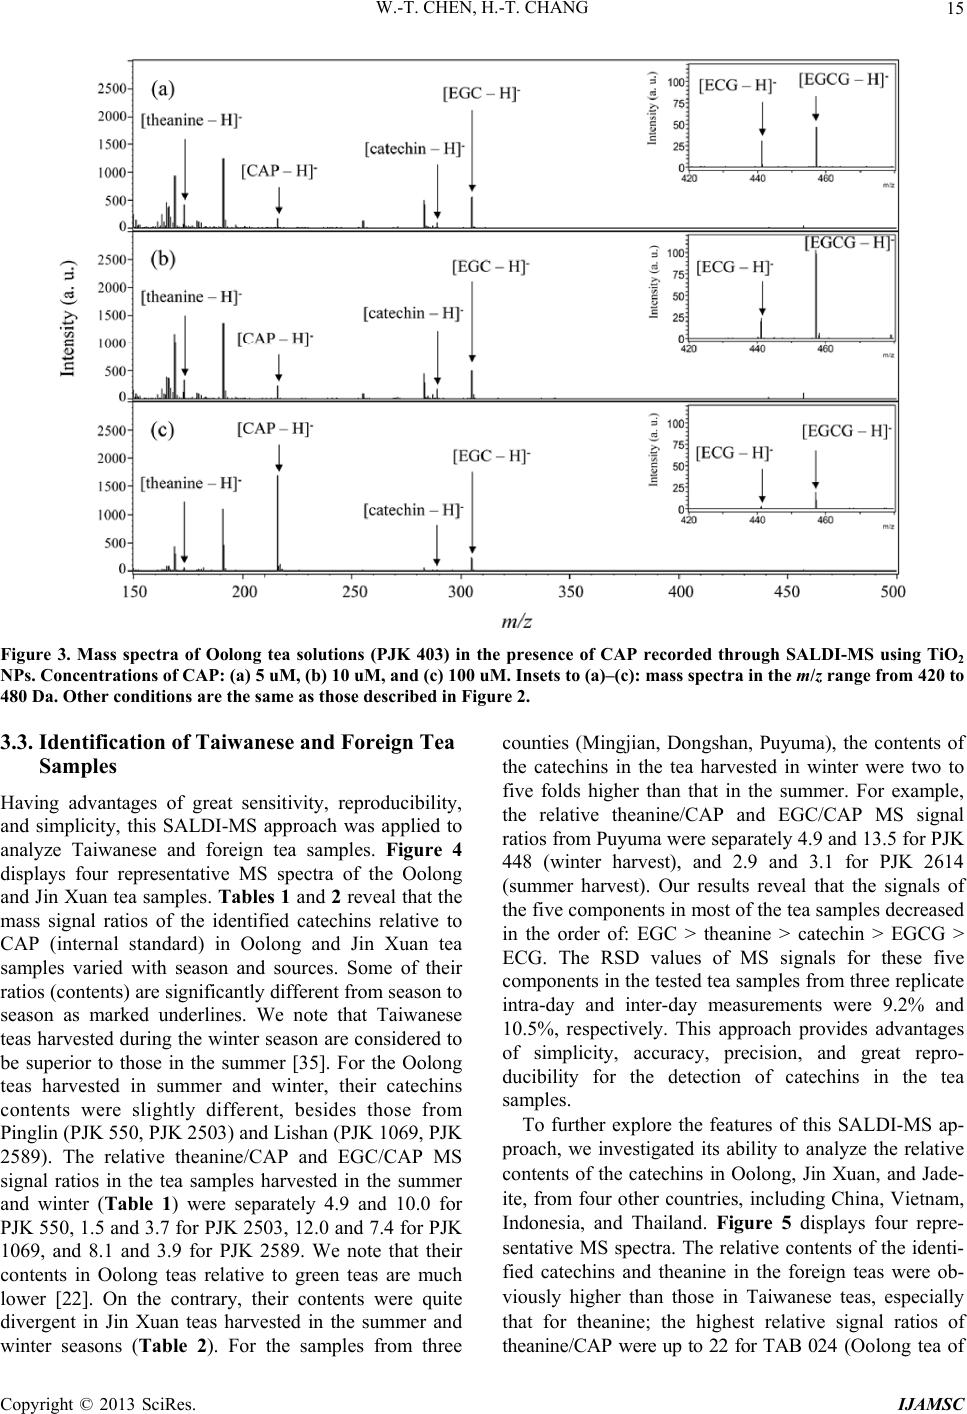 W.-T. CHEN, H.-T. CHANG 15 Figure 3. Mass spectra of Oolong tea solutions (PJK 403) in the presence of CAP recorded through SALDI-MS using TiO2 NPs. Concentrations of CAP: (a) 5 uM, (b) 10 uM, and (c) 100 uM. Insets to (a)–(c): mass spectra in the m/z range from 420 to 480 Da. Other conditions are the same as those described in Figure 2. 3.3. Identification of Taiwanese and Foreign Tea Samples Having advantages of great sensitivity, reproducibility, and simplicity, this SALDI-MS approach was applied to analyze Taiwanese and foreign tea samples. Figure 4 displays four representative MS spectra of the Oolong and Jin Xuan tea samples. Tables 1 and 2 reveal that the mass signal ratios of the identified catechins relative to CAP (internal standard) in Oolong and Jin Xuan tea samples varied with season and sources. Some of their ratios (contents) are significantly different from season to season as marked underlines. We note that Taiwanese teas harvested during the winter season are considered to be superior to those in the summer [35]. For the Oolong teas harvested in summer and winter, their catechins contents were slightly different, besides those from Pinglin (PJK 550, PJK 2503) and Lishan (PJK 1069, PJK 2589). The relative theanine/CAP and EGC/CAP MS signal ratios in the tea samples harvested in the summer and winter (Table 1) were separately 4.9 and 10.0 for PJK 550, 1.5 and 3.7 for PJK 2503, 12.0 and 7.4 for PJK 1069, and 8.1 and 3.9 for PJK 2589. We note that their contents in Oolong teas relative to green teas are much lower [22]. On the contrary, their contents were quite divergent in Jin Xuan teas harvested in the summer and winter seasons (Table 2). For the samples from three counties (Mingjian, Dongshan, Puyuma), the contents of the catechins in the tea harvested in winter were two to five folds higher than that in the summer. For example, the relative theanine/CAP and EGC/CAP MS signal ratios from Puyuma were separately 4.9 and 13.5 for PJK 448 (winter harvest), and 2.9 and 3.1 for PJK 2614 (summer harvest). Our results reveal that the signals of the five components in most of the tea samples decreased in the order of: EGC > theanine > catechin > EGCG > ECG. The RSD values of MS signals for these five components in the tested tea samples from three replicate intra-day and inter-day measurements were 9.2% and 10.5%, respectively. This approach provides advantages of simplicity, accuracy, precision, and great repro- ducibility for the detection of catechins in the tea samples. To further explore the features of this SALDI-MS ap- proach, we investigated its ability to analyze the relative contents of the catechins in Oolong, Jin Xuan, and Jade- ite, from four other countries, including China, Vietnam, Indonesia, and Thailand. Figure 5 displays four repre- sentative MS spectra. The relative contents of the identi- fied catechins and theanine in the foreign teas were ob- viously higher than those in Taiwanese teas, especially that for theanine; the highest relative signal ratios of theanine/CAP were up to 22 for TAB 024 (Oolong tea of Copyright © 2013 SciRes. IJAMSC 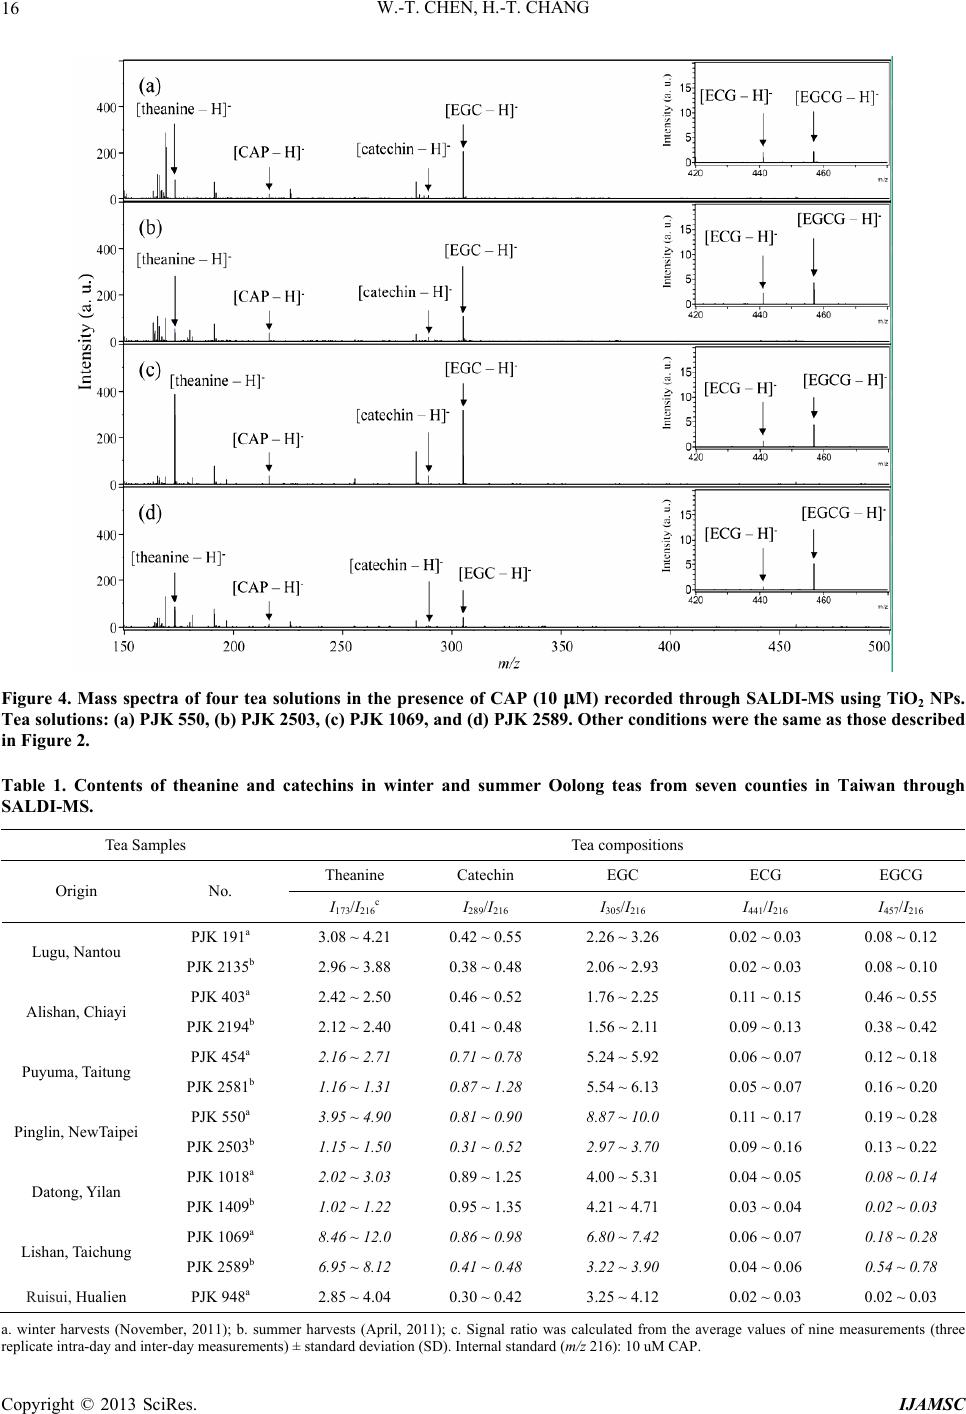 W.-T. CHEN, H.-T. CHANG 16 Figure 4. Mass spectra of four tea solutions in the presence of CAP (10 μM) recorded through SALDI-MS using TiO2 NPs. Tea solutions: (a) PJK 550, (b) PJK 2503, (c) PJK 1069, and (d) PJK 2589. Other conditions were the same as those described in Figure 2. Table 1. Contents of theanine and catechins in winter and summer Oolong teas from seven counties in Taiwan through SALDI-MS. Tea Samples Tea compositions Theanine Catechin EGC ECG EGCG Origin No. I173/I216c I289/I216 I305/I216 I441/I216 I457/I216 PJK 191a 3.08 ~ 4.21 0.42 ~ 0.55 2.26 ~ 3.26 0.02 ~ 0.03 0.08 ~ 0.12 Lugu, Nantou PJK 2135b 2.96 ~ 3.88 0.38 ~ 0.48 2.06 ~ 2.93 0.02 ~ 0.03 0.08 ~ 0.10 PJK 403a 2.42 ~ 2.50 0.46 ~ 0.52 1.76 ~ 2.25 0.11 ~ 0.15 0.46 ~ 0.55 Alishan, Chiayi PJK 2194b 2.12 ~ 2.40 0.41 ~ 0.48 1.56 ~ 2.11 0.09 ~ 0.13 0.38 ~ 0.42 PJK 454a 2.16 ~ 2.71 0.71 ~ 0.78 5.24 ~ 5.92 0.06 ~ 0.07 0.12 ~ 0.18 Puyuma, Taitung PJK 2581b 1.16 ~ 1.31 0.87 ~ 1.28 5.54 ~ 6.13 0.05 ~ 0.07 0.16 ~ 0.20 PJK 550a 3.95 ~ 4.90 0.81 ~ 0.90 8.87 ~ 10.0 0.11 ~ 0.17 0.19 ~ 0.28 Pinglin, NewTaipei PJK 2503b 1.15 ~ 1.50 0.31 ~ 0.52 2.97 ~ 3.70 0.09 ~ 0.16 0.13 ~ 0.22 PJK 1018a 2.02 ~ 3.03 0.89 ~ 1.25 4.00 ~ 5.31 0.04 ~ 0.05 0.08 ~ 0.14 Datong, Yilan PJK 1409b 1.02 ~ 1.22 0.95 ~ 1.35 4.21 ~ 4.71 0.03 ~ 0.04 0.02 ~ 0.03 PJK 1069a 8.46 ~ 12.0 0.86 ~ 0.98 6.80 ~ 7.42 0.06 ~ 0.07 0.18 ~ 0.28 Lishan, Taichung PJK 2589b 6.95 ~ 8.12 0.41 ~ 0.48 3.22 ~ 3.90 0.04 ~ 0.06 0.54 ~ 0.78 Ruisui, Hualien PJK 948a 2.85 ~ 4.04 0.30 ~ 0.42 3.25 ~ 4.12 0.02 ~ 0.03 0.02 ~ 0.03 a. winter harvests (November, 2011); b. summer harvests (April, 2011); c. Signal ratio was calculated from the average values of nine measurements (three replicate intra-day and inter-day measurements) ± standard deviation (SD). Internal standard (m/z 216): 10 uM CAP. Copyright © 2013 SciRes. IJAMSC 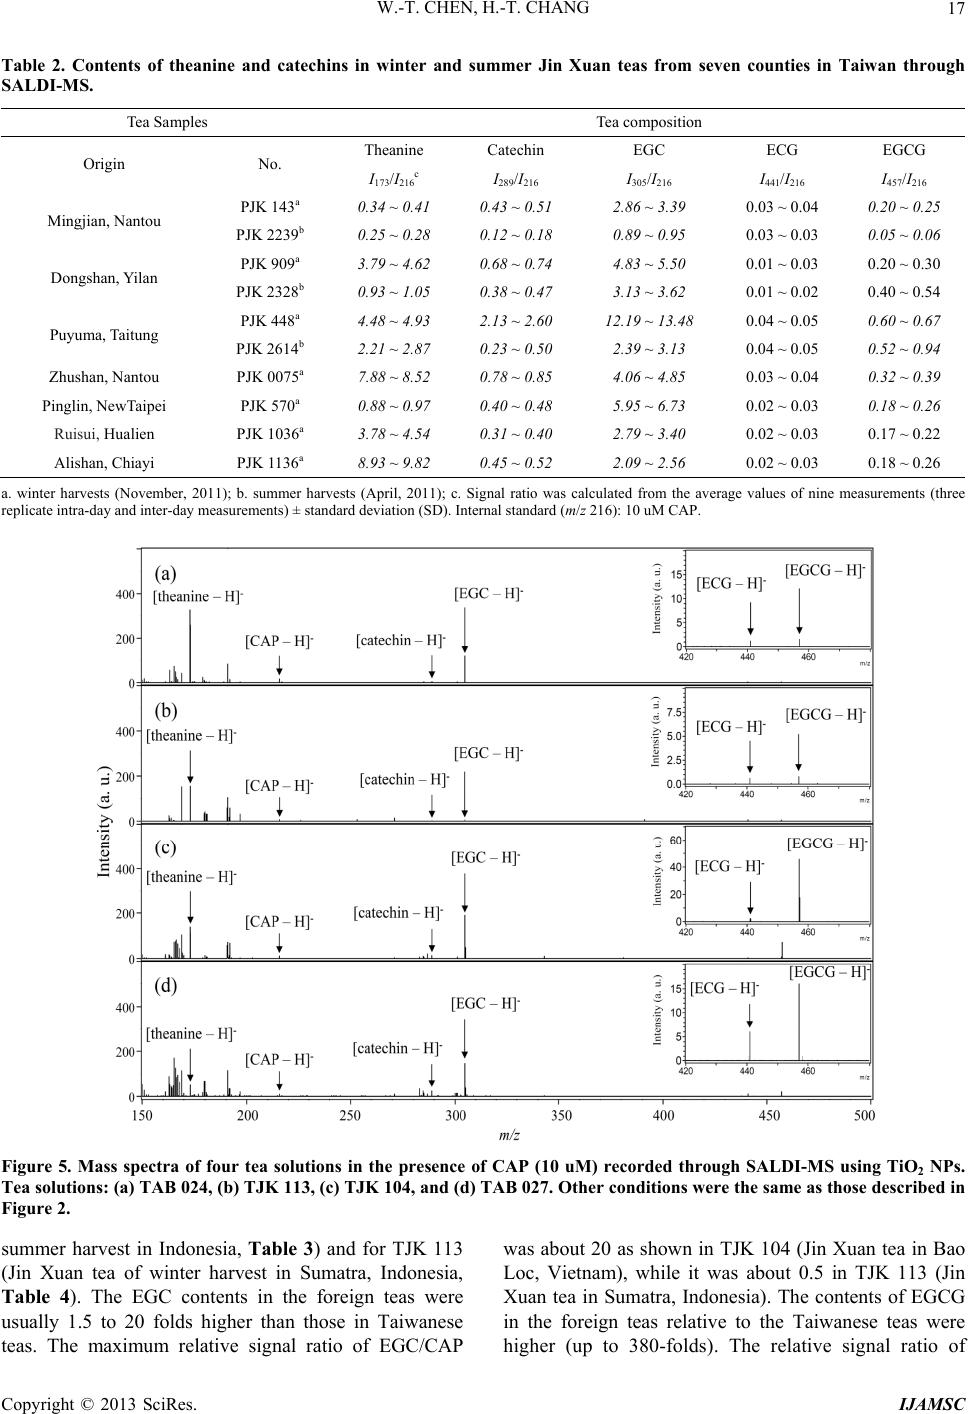 W.-T. CHEN, H.-T. CHANG 17 Table 2. Contents of theanine and catechins in winter and summer Jin Xuan teas from seven counties in Taiwan through SALDI-MS. Tea Samples Tea composition Theanine Catechin EGC ECG EGCG Origin No. I173/I216c I289/I216 I305/I216 I441/I216 I457/I216 PJK 143a 0.34 ~ 0.41 0.43 ~ 0.51 2.86 ~ 3.39 0.03 ~ 0.04 0.20 ~ 0.25 Mingjian, Nantou PJK 2239b 0.25 ~ 0.28 0.12 ~ 0.18 0.89 ~ 0.95 0.03 ~ 0.03 0.05 ~ 0. 0 6 PJK 909a 3.79 ~ 4.62 0.68 ~ 0.74 4.83 ~ 5.50 0.01 ~ 0.03 0.20 ~ 0.30 Dongshan, Yilan PJK 2328b 0.93 ~ 1.05 0.38 ~ 0.47 3.13 ~ 3.62 0.01 ~ 0.02 0.40 ~ 0.54 PJK 448a 4.48 ~ 4.93 2.13 ~ 2.60 12.19 ~ 13.48 0.04 ~ 0.05 0.60 ~ 0.67 Puyuma, Taitung PJK 2614b 2.21 ~ 2.87 0.23 ~ 0.50 2.39 ~ 3.13 0.04 ~ 0.05 0.52 ~ 0. 9 4 Zhushan, Nantou PJK 0075a 7.88 ~ 8.52 0.78 ~ 0.85 4.06 ~ 4.85 0.03 ~ 0.04 0.32 ~ 0.39 Pinglin, NewTaipei PJK 570a 0.88 ~ 0.97 0.40 ~ 0.48 5.95 ~ 6.73 0.02 ~ 0.03 0.18 ~ 0.26 Ruisui, Hualien PJK 1036a 3.78 ~ 4.54 0.31 ~ 0.40 2.79 ~ 3.40 0.02 ~ 0.03 0.17 ~ 0.22 Alishan, Chiayi PJK 1136a 8.93 ~ 9.82 0.45 ~ 0.52 2.09 ~ 2.56 0.02 ~ 0.03 0.18 ~ 0.26 a. winter harvests (November, 2011); b. summer harvests (April, 2011); c. Signal ratio was calculated from the average values of nine measurements (three replicate intra-day and inter-day measurements) ± standard deviation (SD). Internal standard (m/z 216): 10 uM CAP. Figure 5. Mass spectra of four tea solutions in the presence of CAP (10 uM) recorded through SALDI-MS using TiO2 NPs. Tea solutions: (a) TAB 024, (b) TJK 113, (c) TJK 104, and (d) TAB 027. Other conditions were the same as those described in Figure 2. summer harvest in Indonesia, Table 3) and for TJK 113 (Jin Xuan tea of winter harvest in Sumatra, Indonesia, Table 4). The EGC contents in the foreign teas were usually 1.5 to 20 folds higher than those in Taiwanese teas. The maximum relative signal ratio of EGC/CAP was about 20 as shown in TJK 104 (Jin Xuan tea in Bao Loc, Vietnam), while it was about 0.5 in TJK 113 (Jin Xuan tea in Sumatra, Indonesia). The contents of EGCG in the foreign teas relative to the Taiwanese teas were higher (up to 380-folds). The relative signal ratio of Copyright © 2013 SciRes. IJAMSC 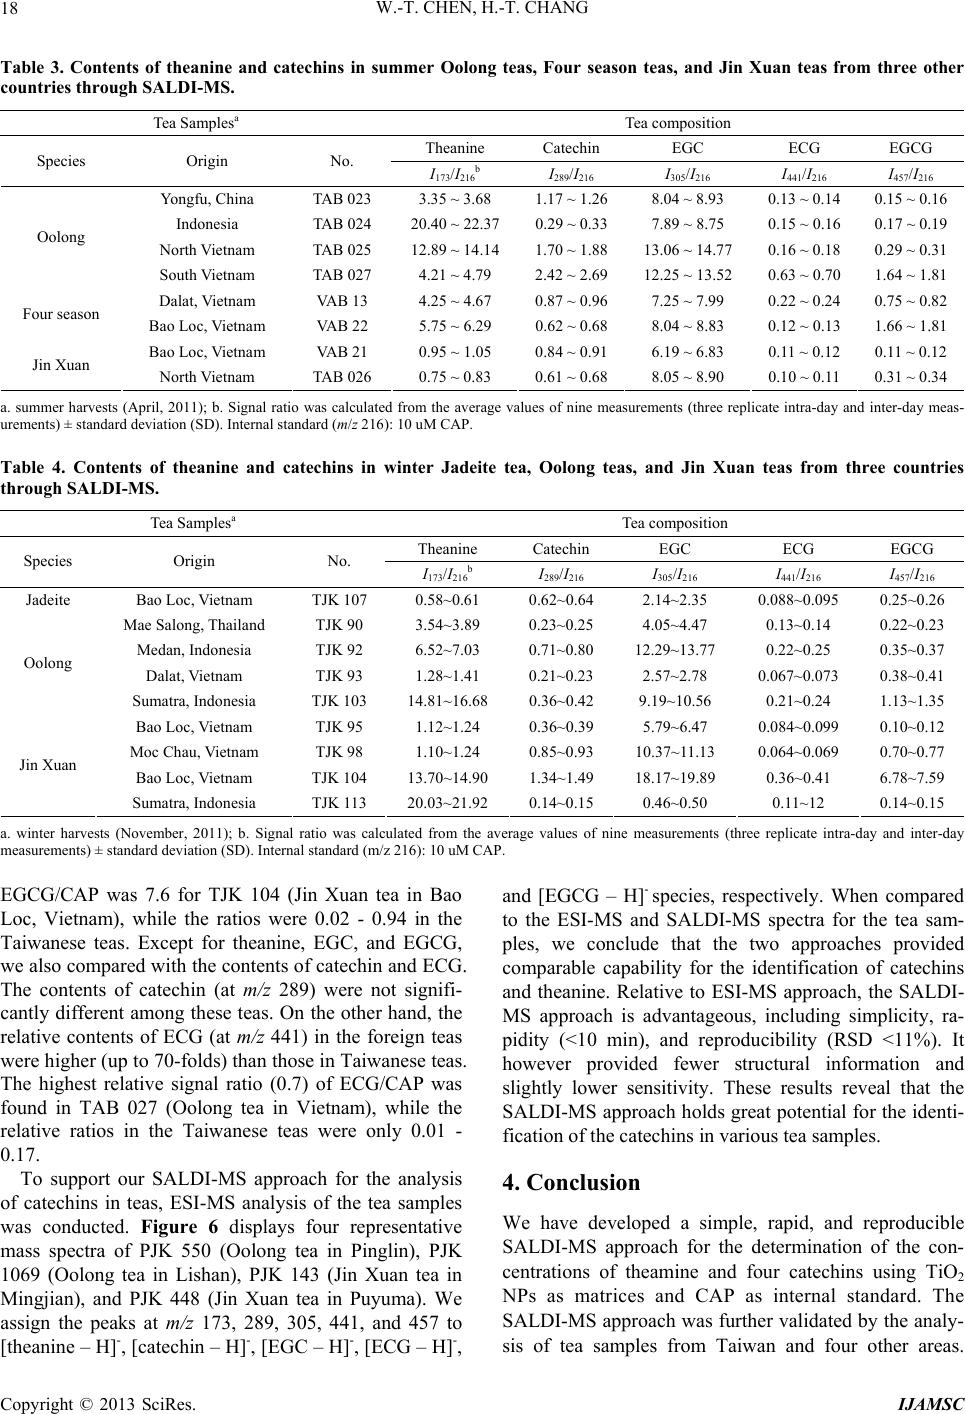 W.-T. CHEN, H.-T. CHANG 18 Table 3. Contents of theanine and catechins in summer Oolong teas, Four season teas, and Jin Xuan teas from three other countries through SALDI-MS. Tea Samplesa Tea composition Theanine Catechin EGC ECG EGCG Species Origin No. I173/I216b I289/I216 I305/I216 I441/I216 I457/I216 Yongfu, China TAB 023 3.35 ~ 3.68 1.17 ~ 1.26 8.04 ~ 8.93 0.13 ~ 0.14 0.15 ~ 0.16 Indonesia TAB 024 20.40 ~ 22.37 0.29 ~ 0.33 7.89 ~ 8.75 0.15 ~ 0.16 0.17 ~ 0.19 North Vietnam TAB 025 12.89 ~ 14.14 1.70 ~ 1.88 13.06 ~ 14.77 0.16 ~ 0.18 0.29 ~ 0.31 Oolong South Vietnam TAB 027 4.21 ~ 4.79 2.42 ~ 2.69 12.25 ~ 13.52 0.63 ~ 0.70 1.64 ~ 1.81 Dalat, Vietnam VAB 13 4.25 ~ 4.67 0.87 ~ 0.96 7.25 ~ 7.99 0.22 ~ 0.24 0.75 ~ 0.82 Four season Bao Loc, Vietnam VAB 22 5.75 ~ 6.29 0.62 ~ 0.68 8.04 ~ 8.83 0.12 ~ 0.13 1.66 ~ 1.81 Bao Loc, Vietnam VAB 21 0.95 ~ 1.05 0.84 ~ 0.91 6.19 ~ 6.83 0.11 ~ 0.12 0.11 ~ 0.12 Jin Xuan North Vietnam TAB 026 0.75 ~ 0.83 0.61 ~ 0.68 8.05 ~ 8.90 0.10 ~ 0.11 0.31 ~ 0.34 a. summer harvests (April, 2011); b. Signal ratio was calculated from the average values of nine measurements (three replicate intra-day and inter-day meas- urements) ± standard deviation (SD). Internal standard (m/z 216): 10 uM CAP. Table 4. Contents of theanine and catechins in winter Jadeite tea, Oolong teas, and Jin Xuan teas from three countries through SALDI-MS. Tea Samplesa Tea composition Theanine Catechin EGC ECG EGCG Species Origin No. I173/I216b I289/I216 I305/I216 I441/I216 I457/I216 Jadeite Bao Loc, Vietnam TJK 107 0.58~0.61 0.62~0.64 2.14~2.35 0.088~0.095 0.25~0.26 Mae Salong, Thailand TJK 90 3.54~3.89 0.23~0.25 4.05~4.47 0.13~0.14 0.22~0.23 Medan, Indonesia TJK 92 6.52~7.03 0.71~0.80 12.29~13.77 0.22~0.25 0.35~0.37 Dalat, Vietnam TJK 93 1.28~1.41 0.21~0.23 2.57~2.78 0.067~0.073 0.38~0.41 Oolong Sumatra, Indonesia TJK 103 14.81~16.68 0.36~0.42 9.19~10.56 0.21~0.24 1.13~1.35 Bao Loc, Vietnam TJK 95 1.12~1.24 0.36~0.39 5.79~6.47 0.084~0.099 0.10~0.12 Moc Chau, Vietnam TJK 98 1.10~1.24 0.85~0.93 10.37~11.13 0.064~0.069 0.70~0.77 Bao Loc, Vietnam TJK 104 13.70~14.90 1.34~1.49 18.17~19.89 0.36~0.41 6.78~7.59 Jin Xuan Sumatra, Indonesia TJK 113 20.03~21.92 0.14~0.15 0.46~0.50 0.11~12 0.14~0.15 a. winter harvests (November, 2011); b. Signal ratio was calculated from the average values of nine measurements (three replicate intra-day and inter-day measurements) ± standard deviation (SD). Internal standard (m/z 216): 10 uM CAP. EGCG/CAP was 7.6 for TJK 104 (Jin Xuan tea in Bao Loc, Vietnam), while the ratios were 0.02 - 0.94 in the Taiwanese teas. Except for theanine, EGC, and EGCG, we also compared with the contents of catechin and ECG. The contents of catechin (at m/z 289) were not signifi- cantly different among these teas. On the other hand, the relative contents of ECG (at m/z 441) in the foreign teas were higher (up to 70-folds) than those in Taiwanese teas. The highest relative signal ratio (0.7) of ECG/CAP was found in TAB 027 (Oolong tea in Vietnam), while the relative ratios in the Taiwanese teas were only 0.01 - 0.17. To support our SALDI-MS approach for the analysis of catechins in teas, ESI-MS analysis of the tea samples was conducted. Figure 6 displays four representative mass spectra of PJK 550 (Oolong tea in Pinglin), PJK 1069 (Oolong tea in Lishan), PJK 143 (Jin Xuan tea in Mingjian), and PJK 448 (Jin Xuan tea in Puyuma). We assign the peaks at m/z 173, 289, 305, 441, and 457 to [theanine – H]-, [catechin – H]-, [EGC – H]-, [ECG – H]-, and [EGCG – H]- species, respectively. When compared to the ESI-MS and SALDI-MS spectra for the tea sam- ples, we conclude that the two approaches provided comparable capability for the identification of catechins and theanine. Relative to ESI-MS approach, the SALDI- MS approach is advantageous, including simplicity, ra- pidity (<10 min), and reproducibility (RSD <11%). It however provided fewer structural information and slightly lower sensitivity. These results reveal that the SALDI-MS approach holds great potential for the identi- fication of the catechins in various tea samples. 4. Conclusion We have developed a simple, rapid, and reproducible SALDI-MS approach for the determination of the con- centrations of theamine and four catechins using TiO2 NPs as matrices and CAP as internal standard. The SALDI-MS approach was further validated by the analy- sis of tea samples from Taiwan and four other areas. Copyright © 2013 SciRes. IJAMSC 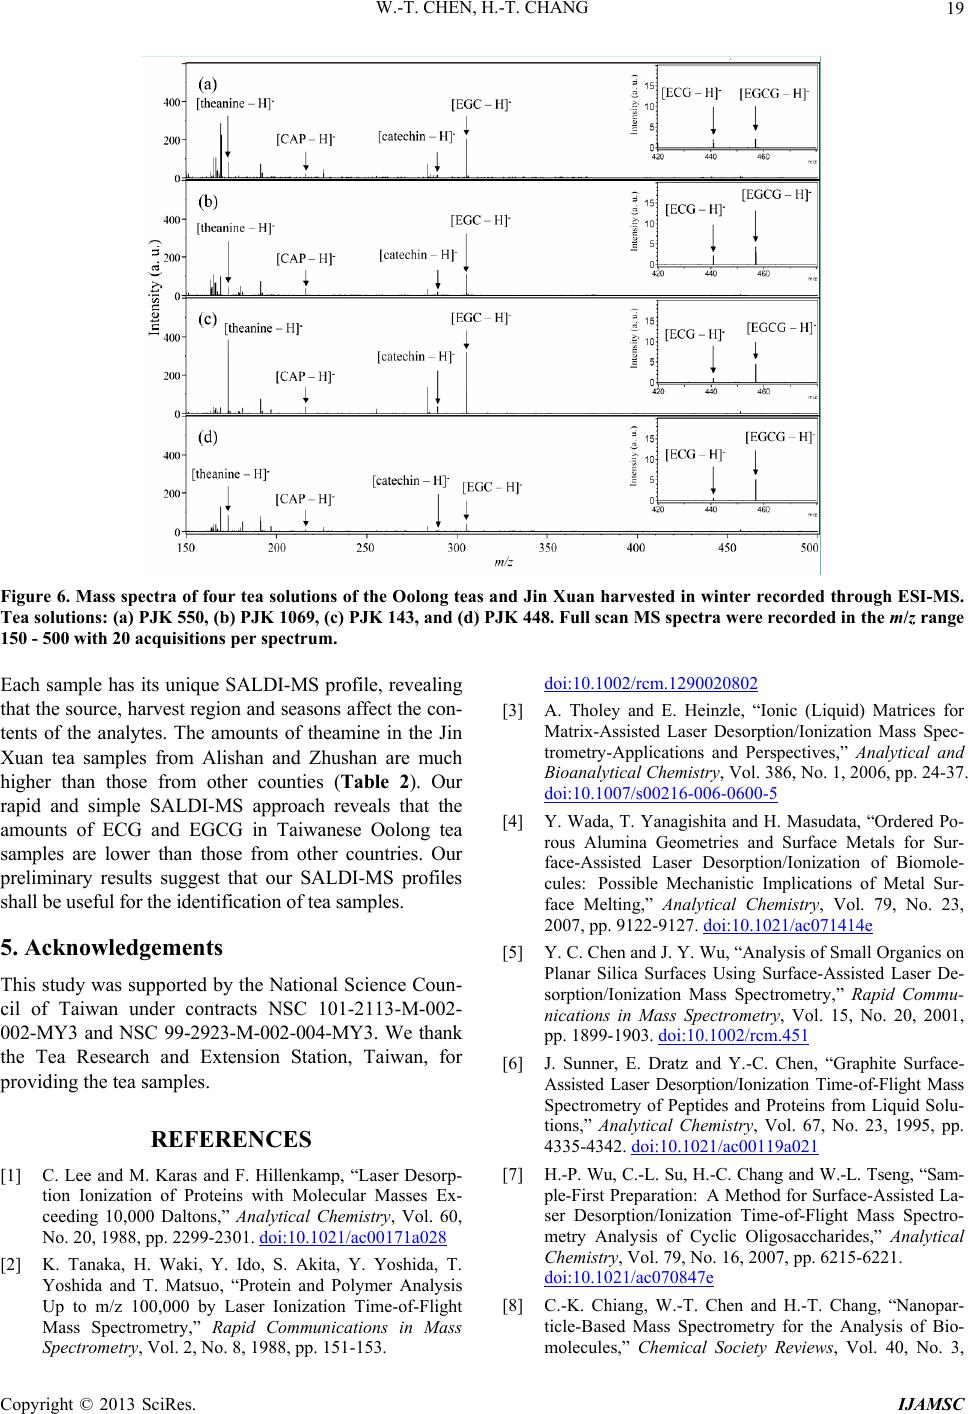 W.-T. CHEN, H.-T. CHANG 19 Figure 6. Mass spectra of four tea solutions of the Oolong teas and Jin Xuan harvested in winter recorded through ESI-MS. Tea solutions: (a) PJK 550, (b) PJK 1069, (c) PJK 143, and (d) PJK 448. Full scan MS spectra were recorded in the m/z range 150 - 500 with 20 acquisitions per spectrum. Each sample has its unique SALDI-MS profile, revealing that the source, harvest region and seasons affect the con- tents of the analytes. The amounts of theamine in the Jin Xuan tea samples from Alishan and Zhushan are much higher than those from other counties (Table 2). Our rapid and simple SALDI-MS approach reveals that the amounts of ECG and EGCG in Taiwanese Oolong tea samples are lower than those from other countries. Our preliminary results suggest that our SALDI-MS profiles shall be useful for the identification of tea samples. 5. Acknowledgements This study was supported by the National Science Coun- cil of Taiwan under contracts NSC 101-2113-M-002- 002-MY3 and NSC 99-2923-M-002-004-MY3. We thank the Tea Research and Extension Station, Taiwan, for providing the tea samples. REFERENCES [1] C. Lee and M. Karas and F. Hillenkamp, “Laser Desorp- tion Ionization of Proteins with Molecular Masses Ex- ceeding 10,000 Daltons,” Analytical Chemistry, Vol. 60, No. 20, 1988, pp. 2299-2301. doi:10.1021/ac00171a028 [2] K. Tanaka, H. Waki, Y. Ido, S. Akita, Y. Yoshida, T. Yoshida and T. Matsuo, “Protein and Polymer Analysis Up to m/z 100,000 by Laser Ionization Time-of-Flight Mass Spectrometry,” Rapid Communications in Mass Spectrometry, Vol. 2, No. 8, 1988, pp. 151-153. doi:10.1002/rcm.1290020802 [3] A. Tholey and E. Heinzle, “Ionic (Liquid) Matrices for Matrix-Assisted Laser Desorption/Ionization Mass Spec- trometry-Applications and Perspectives,” Analytical and Bioanalytical Chemistry, Vol. 386, No. 1, 2006, pp. 24-37. doi:10.1007/s00216-006-0600-5 [4] Y. Wada, T. Yanagishita and H. Masudata, “Ordered Po- rous Alumina Geometries and Surface Metals for Sur- face-Assisted Laser Desorption/Ionization of Biomole- cules: Possible Mechanistic Implications of Metal Sur- face Melting,” Analytical Chemistry, Vol. 79, No. 23, 2007, pp. 9122-9127. doi:10.1021/ac071414e [5] Y. C. Chen and J. Y. Wu, “Analysis of Small Organics on Planar Silica Surfaces Using Surface-Assisted Laser De- sorption/Ionization Mass Spectrometry,” Rapid Commu- nications in Mass Spectrometry, Vol. 15, No. 20, 2001, pp. 1899-1903. doi:10.1002/rcm.451 [6] J. Sunner, E. Dratz and Y.-C. Chen, “Graphite Surface- Assisted Laser Desorption/Ionization Time-of-Flight Mass Spectrometry of Peptides and Proteins from Liquid Solu- tions,” Analytical Chemistry, Vol. 67, No. 23, 1995, pp. 4335-4342. doi:10.1021/ac00119a021 [7] H.-P. Wu, C.-L. Su, H.-C. Chang and W.-L. Tseng, “Sam- ple-First Preparation: A Method for Surface-Assisted La- ser Desorption/Ionization Time-of-Flight Mass Spectro- metry Analysis of Cyclic Oligosaccharides,” Analytical Chemistry, Vol. 79, No. 16, 2007, pp. 6215-6221. doi:10.1021/ac070847e [8] C.-K. Chiang, W.-T. Chen and H.-T. Chang, “Nanopar- ticle-Based Mass Spectrometry for the Analysis of Bio- molecules,” Chemical Society Reviews, Vol. 40, No. 3, Copyright © 2013 SciRes. IJAMSC  W.-T. CHEN, H.-T. CHANG 20 2011, pp. 1269-1281. doi:10.1039/c0cs00050g [9] J. A. McLean, K. A. Stumpo and D. H. Russell, “Size- Selected (2-10 nm) Gold Nanoparticles for Matrix As- sisted Laser Desorption Ionization of Peptides,” Journal of the American Chemical Society, Vol. 127, No. 15, 2005, pp. 5304-5305. doi:10.1021/ja043907w [10] Y.-F. Huang and H.-T. Chang, “Analysis of Adenosine Triphosphate and Glutathione through Gold Nanoparti- cles Assisted Laser Desorption/Ionization Mass Spectro- metry,” Analytical Chemistry, Vol. 79, No. 13, 2007, pp. 4852-4859. doi:10.1021/ac070023x [11] H. Kawasaki, T. Sugitani, T. Watanabe, T. Yonezawa, H. Moriwaki and R. Arakawa, “Layer-by-Layer Self-As- sembled Mutilayer Films of Gold Nanoparticles for Sur- face-Assisted Laser Desorption/Ionization Mass Spectro- metry,” Analytical Chemistry, Vol. 80, No. 19, 2008, pp. 7524-7533. doi:10.1021/ac800789t [12] T.-C. Chiu, L.-C. Chang, C.-K. Chiang and H.-T. Chang, “Determining Estrogens Using Surface-Assisted Laser Desorption/Ionization Mass Spectrometry with Silver Na- noparticles as the Matrix,” Journal of the American Soci- ety for Mass Spectrometry, Vol. 19, No. 9, 2008, pp. 1343-1346. doi:10.1016/j.jasms.2008.06.006 [13] S. F. Ren, L. Zhang, Z. H. Cheng and Y. L. Guo, “Im- mobilized Carbon Nanotubes as Matrix for MALDI- TOF-MS Analysis: Applications to Neutral Small Carbo- hydrates,” Journal of the American Society for Mass Spec- trometry, Vol. 16, No. 3, 2005, pp. 333-339. doi:10.1016/j.jasms.2004.11.017 [14] X. Wen, S. Dagan and V. H. Wysocki, “Small-Molecule Analysis with Silicon-Nanoparticle-Assisted Laser Desor- ption/Ionization Mass Spectrometry,” Analytical Chemis- try, Vol. 79, No. 2, 2007, pp. 434-444. doi:10.1021/ac061154l [15] F. Torta, M. Fusi, C. S. Casari, C. E. Bottani and A. Ba- chi, “Titanium Dioxide Coated MALDI Plate for On Target Analysis of Phosphopeptides,” Journal of Pro- teome Research, Vol. 8, No. 4, 2009, pp. 1932-1942. doi:10.1021/pr8008836 [16] C.-K. Chiang, Z. Yang, Y.-W. Lin, W.-T. Chen, H.-J. Lin and H.-T. Chang, “Detection of Proteins and Protein- Ligand Complexes Using HgTe Nanostructure Matrices in Surface-Assisted Laser Desorption/Ionization Mass Spectrometry,” Analytical Chemistry, Vol. 82, No. 11, 2010, pp. 4543-4550. doi:10.1021/ac100550c [17] W.-T. Chen, C.-K. Chiang, C.-H. Lee and H.-T. Chang, “Using Surface-Assisted Laser Desorption/Ionization Mass Spectrometry to Detect Proteins and Protein-Protein Complexes,” Analytical Chemistry, Vol. 84, No. 4, 2012, pp. 1924-1930. doi:10.1021/ac202883q [18] W.-T. Chen, M.-F. Huang and H.-T. Chang, “Using Sur- face-Assisted Laser Desorption/Ionization Mass Spec- trometry to Detect ss- and ds-Oligodeoxynucleotides,” Journal of the American Society for Mass Spectrometry, Vol. 24, No. 6, 2013, pp. 877-883. doi:10.1007/s13361-013-0595-z [19] W.-Y. Chen and Y.-C. Chen, “Affinity-Based Mass Spec- trometry Using Magnetic Iron Oxide Particles as the Ma- trix and Concentrating Probes for SALDI MS Analysis of Peptides and Proteins,” Analytical and Bioanalytical Che- mistry, Vol. 386, No. 3, 2006, pp. 699-704. doi:10.1007/s00216-006-0427-0 [20] J. J. Dalluge and B. C. Nelson, “Determination of Tea Catechins,” Journal of Chromatography A, Vol. 881, No. 1-2, 2000, pp. 411-424. doi:10.1016/S0021-9673(00)00062-5 [21] R. A. Riemersma, C. A. Rice-Evans, R. M. Tyrrell, M. N. Clifford and M. E. J. Lean, “Tea Flavonoids and Cardio- vascular Health,” Quarterly Journal of Mathematics, Vol. 94, No. 5, 2001, pp. 277-282. doi:10.1093/qjmed/94.5.277 [22] C. Cabrera, R. Gimenez and M. C. Lopez, “Determination of tea components with antioxidant activity,” Journal of Agricultural and Food Chemistry, Vol. 51, No. 15, 2003, pp. 4427-4435. doi:10.1021/jf0300801 [23] H. Schulz, U. H. Engelhardt, A. Wegent, H. Drews and S. Lapczynski, “Application of Near-Infrared Reflectance Spectroscopy to the Simultaneous Prediction of Alkaloids and Phenolic Substances in Green Tea Leaves,” Journal of Agricultural and Food Chemistry, Vol. 47, No. 12, 1999, pp. 5064-5067. doi:10.1021/jf9813743 [24] I. Khan, P. L. Sangwan, S. T. Abdullah, B. D. Gupta, J. K. Dhar, R. Manickavasagar and S. Koul, “Ten Marker Compounds-Based Comparative Study of Green Tea and Guava Leaf by HPTLC Densitometry Methods: Antioxi- dant Activity Profiling,” Journal of Separation Science, Vol. 34, No. 7, 2011, pp. 749-760. doi:10.1002/jssc.201000718 [25] M. Li, J. Zhou, X. Gu, Y. Wang, X. Huang and C. Yan, “Quantitative Capillary Electrophoresis and Its Applica- tion in Analysis of Alkaloids in Tea, Coffee, Coca Cola, and Theophylline Tablets,” Journal of Separation Science, Vol. 32, No. 2, 2009, pp. 267-274. doi:10.1002/jssc.200800529 [26] L.-F. Wang, J.-Y. Lee, J.-O. Chung, J.-H. Baik, S. So and S.-K. Park, “Discrimination of Teas with Different De- grees of Fermentation by SPME-GC Analysis of the Cha- racteristic Volatile flavour Compounds,” Food Chemistry, Vol. 109, No. 1, 2008, pp. 196-206. doi:10.1016/j.foodchem.2007.12.054 [27] A. P. Neilson, R. J. Green, K. V. Wood and M. G. Fer- ruzzi, “High-Throughput Analysis of Catechins and The- aflavins by High Performance Liquid Chromatography with Diode Array Detection,” Journal of Chromatogra- phy A, Vol. 1132, No. 1-2, 2006, pp. 132-140. doi:10.1016/j.chroma.2006.07.059 [28] D. Guillarme, C. Casetta, C. Bicchi and J.-L. Veuthey, “High Throughput Qualitative Analysis of Polyphenols in Tea Samples by Ultra-High Pressure Liquid Chromatog- raphy Coupled to UV and Mass Spectrometry Detectors,” Journal of Chromatography A, Vol. 1217, No. 44, 2010, pp. 6882-6890. doi:10.1016/j.chroma.2010.08.060 [29] K. S. Abhijith, P. V. Sujith Kumar, M. A. Kumar and M. S. Thakur, “Immobilised Tyrosinase-Based Biosensor for the Detection of Tea Polyphenols,” Analytical and Bio- analytical Chemistry, Vol. 389, No. 7-8, 2007, pp. 2227- 2234. doi:10.1007/s00216-007-1604-5 [30] K.-H. Lee, C.-K. Chiang, Z.-H. Lin and H.-T. Chang, Copyright © 2013 SciRes. IJAMSC  W.-T. CHEN, H.-T. CHANG Copyright © 2013 SciRes. IJAMSC 21 “Determining Enediol Compounds in Tea Using Surface- Assisted Laser Desorption/Ionization Mass Spectrometry with Titanium Dioxide Nanoparticle Matrices,” Rapid Communications in Mass Spectrometry, Vol. 21, No. 13, 2007, pp. 2023-2030. doi:10.1002/rcm.3058 [31] T. Rajh, L. X. Chen, K. Lukas, T. Liu, M. C. Thurnauer and D. M. Tiede, “Surface Restructuring of Nanoparticles: An Efficient Route for Ligand-Metal Oxide Crosstalk,” The Journal of Physical Chemistry B, Vol. 106, No. 41, 2002, pp. 10543-10552. doi:10.1021/jp021235v [32] R. Knochenmuss and R. Zenobi, “MALDI Ionization: In- Plume Processes,” Chemical Reviews, Vol. 103, No. 2, 2003, pp. 441-452. doi:10.1021/cr0103773 [33] C.-K. Chiang, Y.-W. Lin, W.-T. Chen and H.-T. Chang, “Accurate Quantitation of Glutathione in Cell Lysates through Surface-Assisted Laser Desorption/Ionization Mass Spectrometry Using Gold Nanoparticles,” Nano- medicine: Nanotechnology, Biology and Medicine, Vol. 6, No. 4, 2010, pp. 530-537. doi:10.1016/j.nano.2010.01.006 [34] W.-T. Chen, C.-K. Chiang, Y.-W. Lin and H.-T. Chang, “Quantification of Captopril in Urine through Surface- Assisted Laser Desorption/Ionization Mass Spectrometry Using 4-Mercaptobenzoic Acid-Capped Gold Nanoparti- cles as an Internal Standard,” Journal of the American Society for Mass Spectrometry, Vol. 21, No. 5, 2010, pp. 864-867. doi:10.1016/j.jasms.2010.01.023 [35] Chinese Culture: Quality of Tea. http://www.traditionalstudies.org/
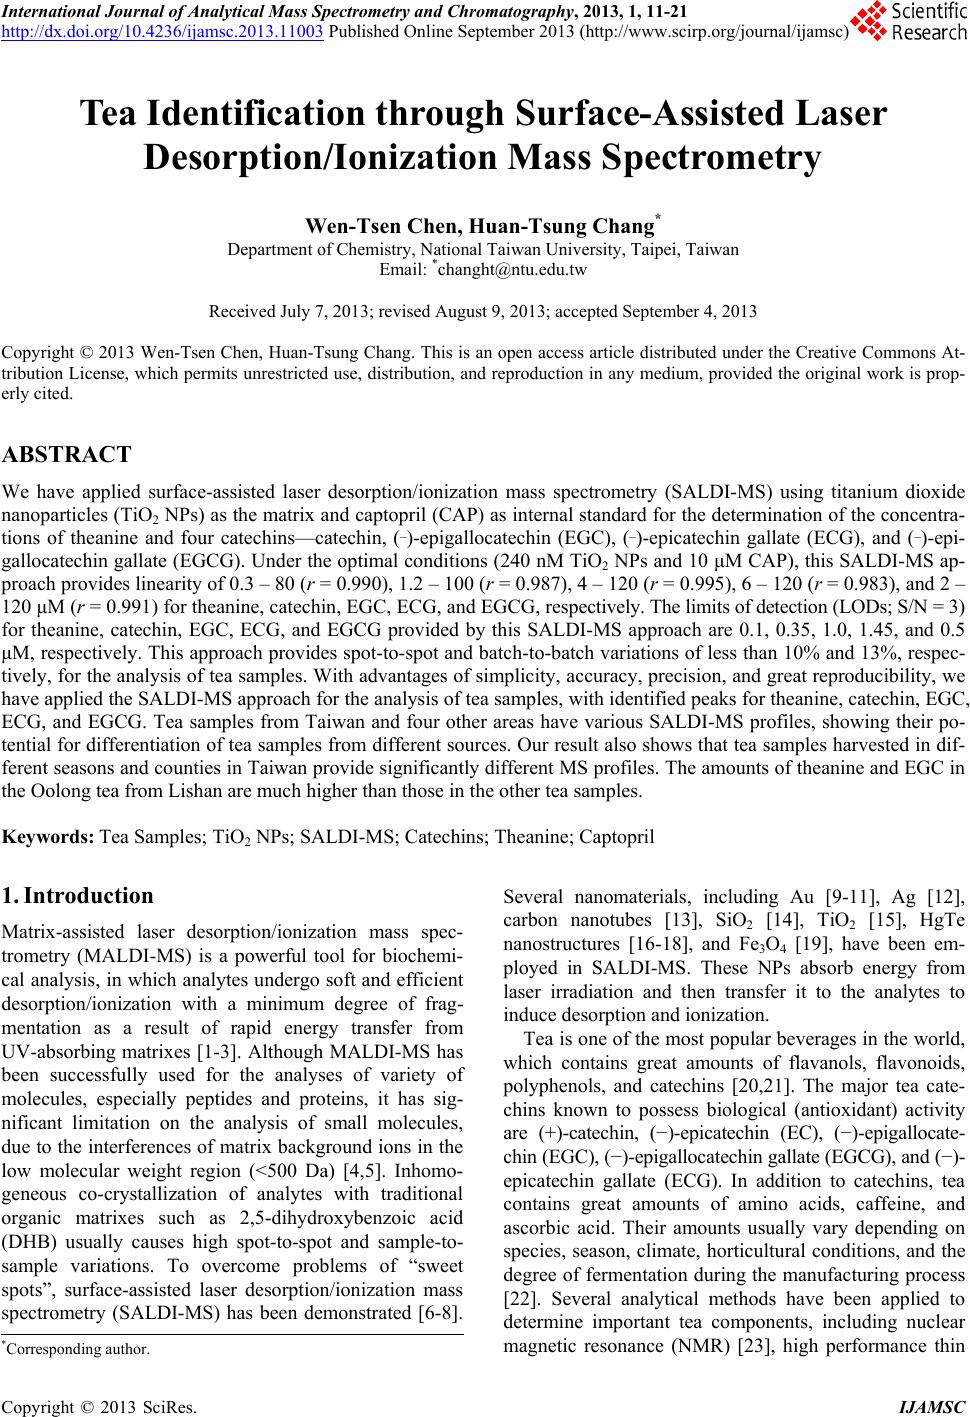
|