H. K. HAGHIGHI ET AL.
138
phase was carried out according to the concentrations of
ions in the aqueous phase.
2.3. Experimental Design of RSM
To determine the optimal combination of extraction
variables for the extraction ions, response surface method
(RSM) was used. Table 2 shows the coded parameters
and their levels, and Table 3 illustrates the coded, ex-
perimental and predicted values. As seen in Table 3,
three factors (i.e. concentrations of three ions) as the in-
putted data were used to model the extraction . The valu es
for the extraction percent of zinc, iron, manganese (%E
Zn, %E Fe and %E Mn), separation factor of zinc-iron
(Sf (Zn-Fe)) and zinc-manganese (Sf (Zn-Mn)) in each
trial were average of duplicates. Based on the experi-
mental data, regression analysis was done and fitted into
the quadratic model as shown in Equation (1).
2
011
1
11
kk
ii iii
ii
kk
ij i
iji
YA AXAX
iXX e
(1)
where Y represents the response, Xi and Xj are variables, k
is the number of independent variables (factors), A0 is
assigned as the constant coefficient, Aii and Aij are inter-
action coefficients of linear, quadratic and the second-
order terms, respectively, and ei stands for th e error. De-
sign-Expert 7.0.1.0 (Trial version, Stat-Ease Inc., Min-
neanopolis, MN, USA) was used for the experimental
design and regression analysis of the experimental data.
The Student’s t-test and Fischer’s F-test were used to
check the statistical significance of the regression co-
efficient, and determine the second-order model equation,
respectively. The lack of fit, the coefficient of determina-
tion (R2) and the F-test value obtained from the analysis
of variance (ANOVA) were applied to evaluate the ade-
quacy of the model.
3. Result and Discussion
If all the aforementioned variables are assumed to be
measurable, the response surface will be expressed as
Equation (2):
123
,,,,X
i
YfXXX (2)
where Y is candidate of responses and the Xi varia b les ar e
called factors. To model using RSM, a total of 18
experimental runs are required. The results inserted to
Design Expert software were used to fit a model to these
results. The equations of models in terms of coded fac-
tors are obtained as Equations (3) to (5) for %E Zn, %E
Mn, Sf (Zn-Fe) and Sf (Zn- Mn), respectively:
For %E Zn:
12
1213 23
%EZn 81.4312.0911.656.14
8.97 12.833.66
3
XX
XXXX
X
3
(3)
The equation of model for iron extraction is not
significant because p-value of model is less than 0.05.
This is due to high extraction percent of iron (III) in any
pH ranges, which reaches above 99%.
For %E Mn:
12
12 13 23
22
13
2
2
%EMn19.3127.0922.7858.09
74.38 78.88 29.75
94.9060.53 43.60
XX
XXXX
XXX
X
(4)
Selective extraction of A ion from B ion can be ex-
pressed by
AB
SfA-B =DD,
where
Aorganic aqueous
D=AB
and
Borganic aqueous
D=BA . The equation of model for
SfZn-Fe is not presented in this study because it is
not significant due to p-value less than 0.05. Neverthe-
less,
Sf Zn-Mn has been modeled using RSM as
Equati onn (5).
1
23
Sf Zn-Mn560.691419.98
387.08 1014.53
X
XX
(5)
The result of analysis of variance (ANOVA) is illus-
trated in Table 4-6.
The results of this table reveal that the prediction
models of the zinc and manganese extraction percent and
separation factor of zinc-manganese are significant since
the p-value is less than 0.05.
The result of Table 4 indicated that the effect of ions
concentration and their in teractions on the zinc ex traction
are not significant. As observed in this table, iron con-
centration has the highest effect on zinc extraction. The
reason for this effect is probably because of selective
extraction of iron (III) ions (i.e., among other species) by
D2EHPA. Table 5 illustrates th e results of Mn ex traction.
The effect of all factors (variables) and their interactions
except zinc concentration are significant on Mn extrac-
tion. As Table 5, manganese concentration has the high-
est effect on manganese extraction. In addition, Table 6
displays that the results of
Sf Zn-Mn
, the zinc and
manganese concentration are only significant factors.
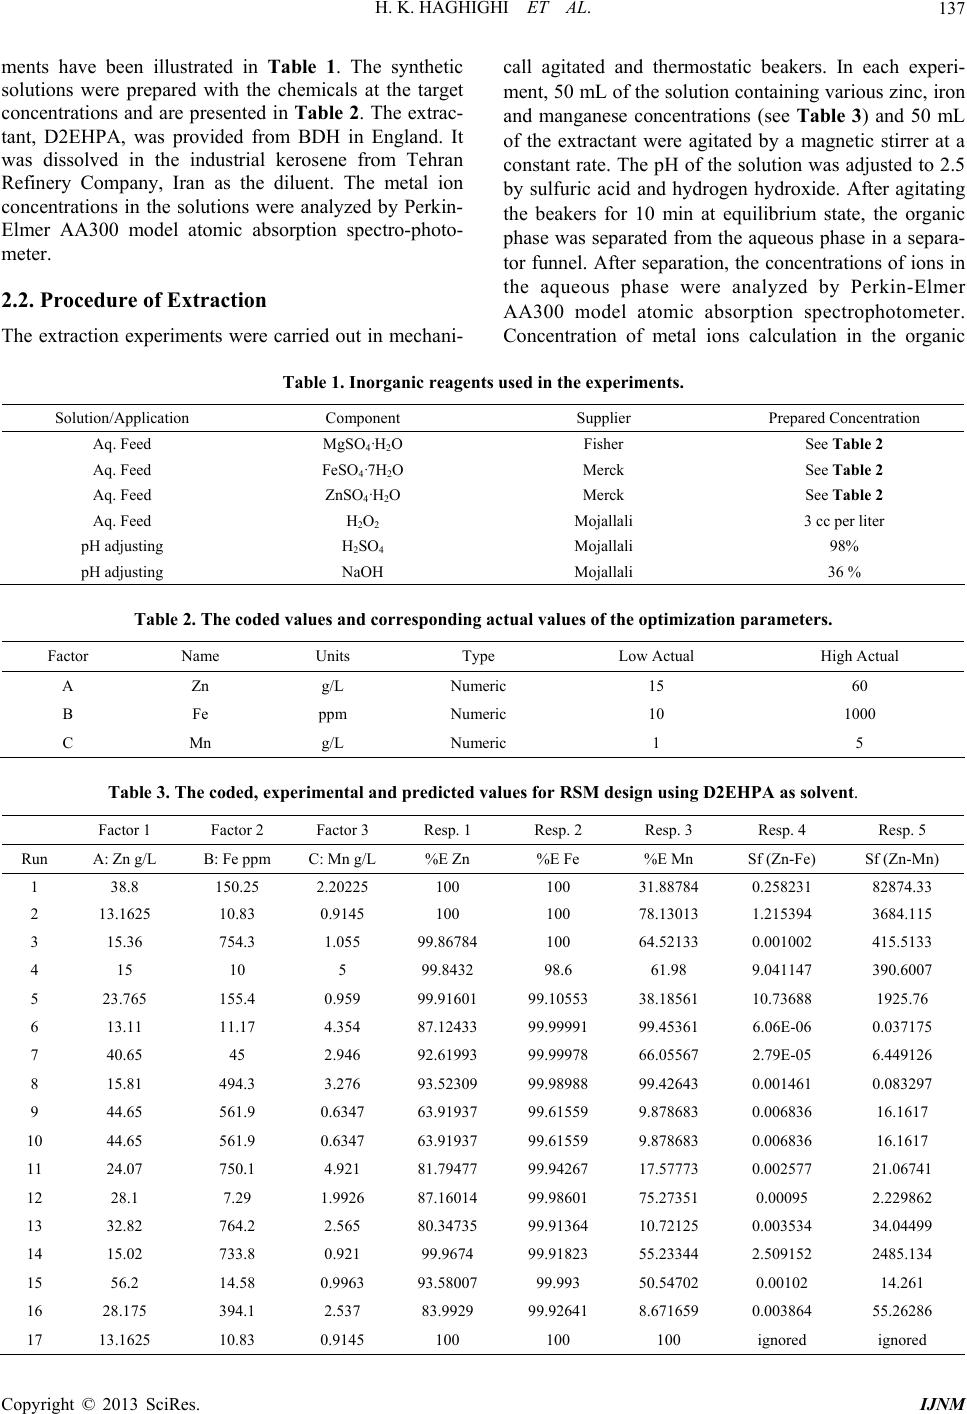
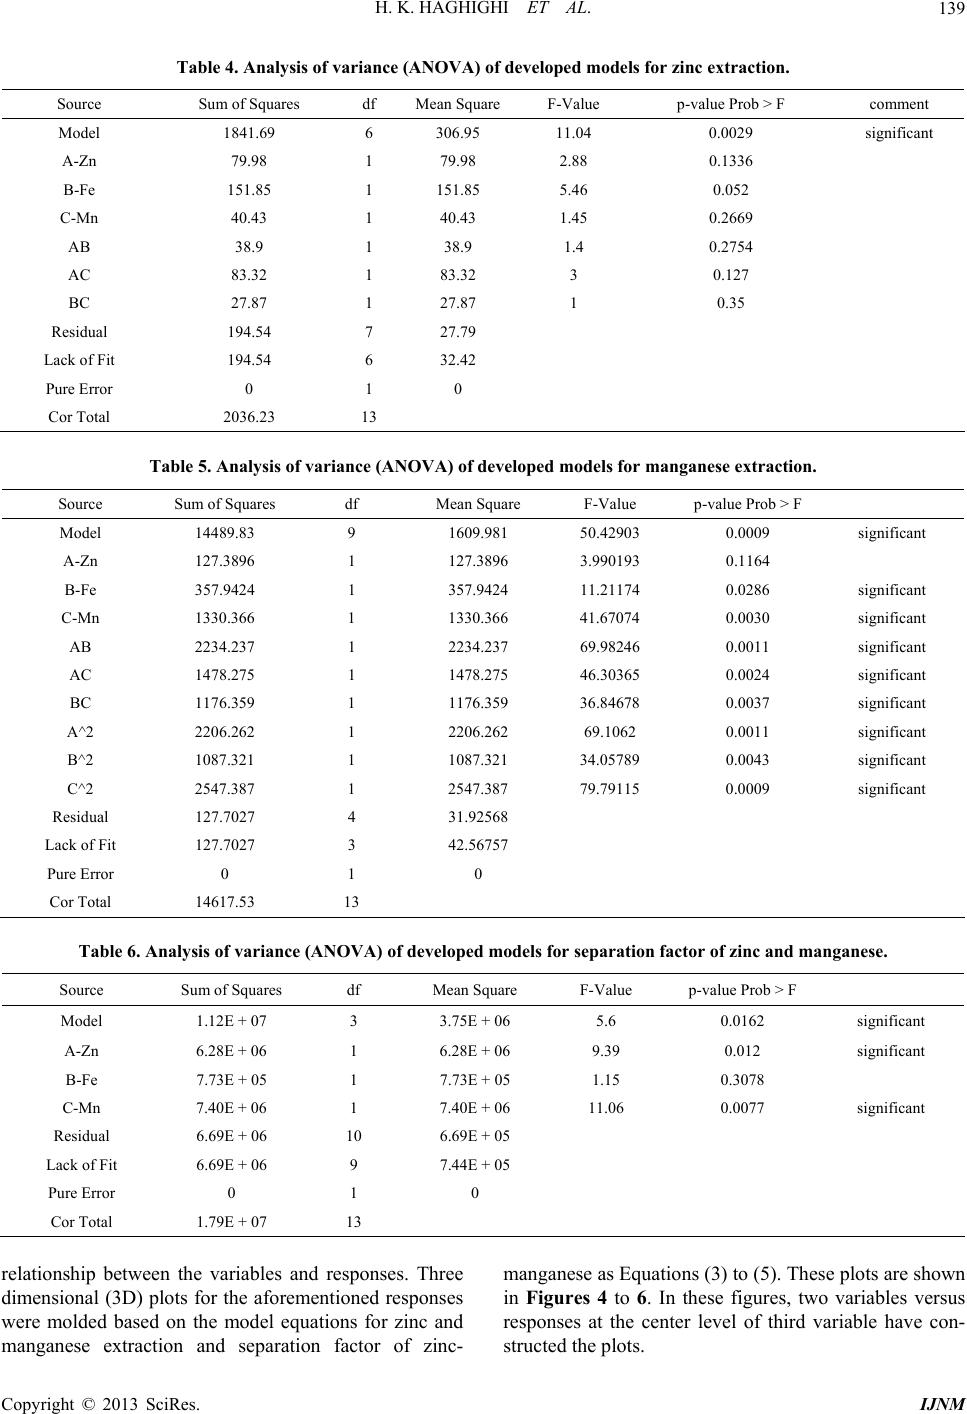
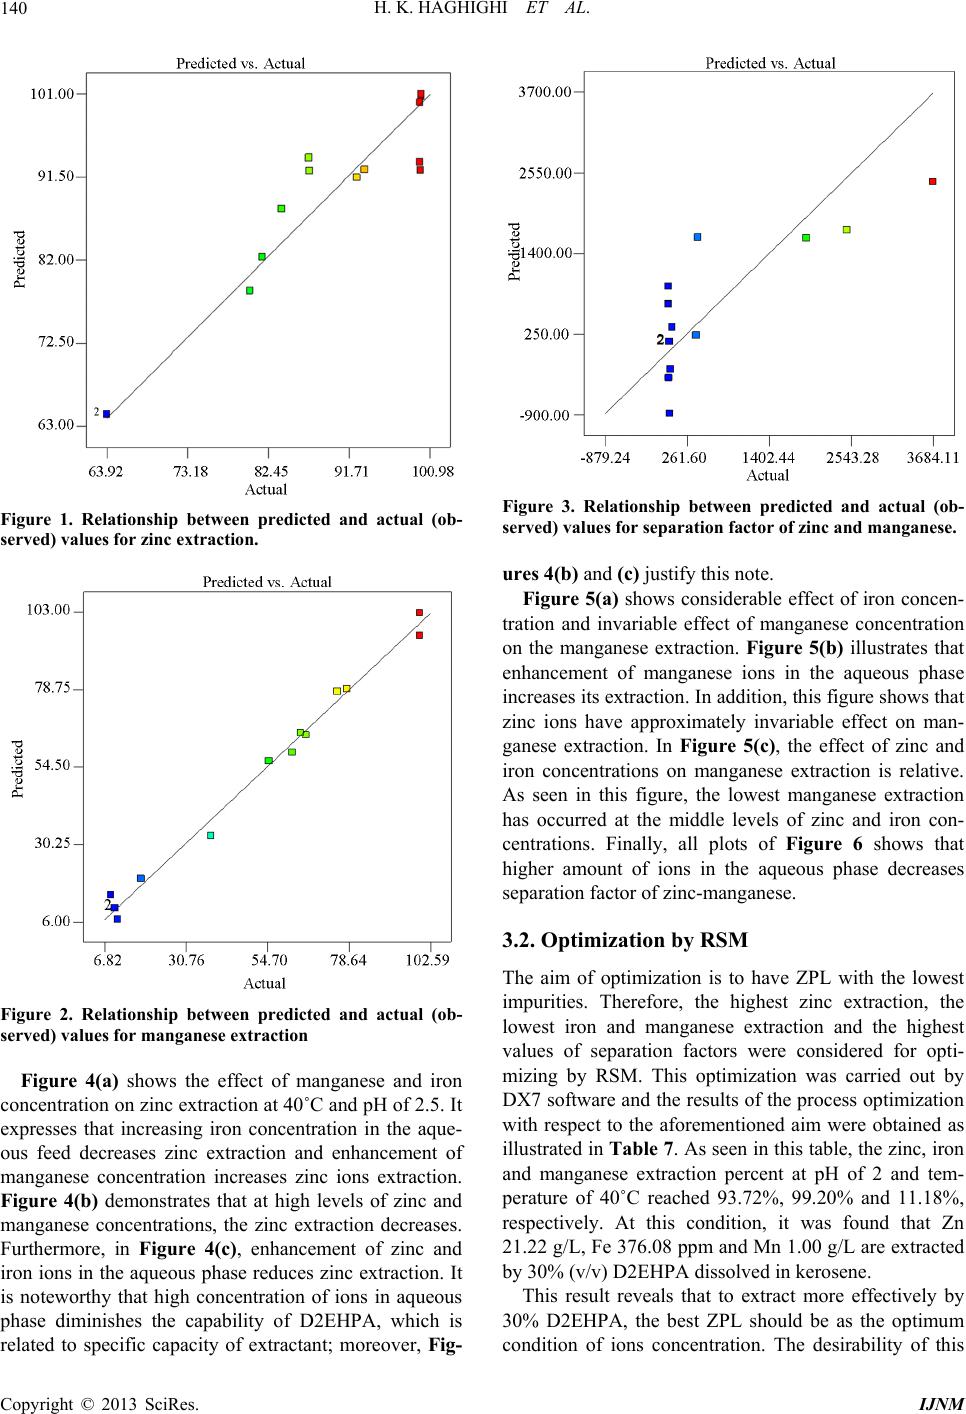
The high value of correlation coefficient (R2) indicates
that the model has been fitted very well. If this is a re-
sponse surface design which is intended to be used for
modeling the design space, then the R-squared values
should be rather high (perhaps above 0.60) (Design Ex-
pert 7 Help). R2 was found to be 0.904 for %E Zn, 0.991
for %E Mn and 0.627 for
SfZn-Mn , as shown in
Figures 1 to 3, which are acceptable statistically.
3.1. 3D Response Surface Plots
The 3D response surface plots simulated by Design-Ex-
pert software are graphical representations in order to
understand the interaction effects of variables and the
Copyright © 2013 SciRes. IJNM