 Food and Nutrition Sciences, 2013, 4, 79-86 http://dx.doi.org/10.4236/fns.2013.49A2011 Published Online September 2013 (http://www.scirp.org/journal/fns) Application of Salt Whey from Egyptian Ras Cheese in Processed Cheese Making Sameh Awad, Nour Elhoda Ahmed, Morsi El Soda Department of Dairy Science and Technology, Faculty of Agriculture, Alexandria University, Alexandria, Egypt. Email: sameh111eg@yahoo.com Received May 14th, 2013; revised June 14th, 2013; accepted June 21st, 2013 Copyright © 2013 Sameh Awad et al. This is an open access article distributed under the Creative Commons Attribution License, which permits unrestricted use, distribution, and reproduction in any medium, provided the original work is properly cited. ABSTRACT The objective of this study was to evaluate characteristics of processed cheese made from salt Ras cheese whey and young Cheddar containing exopolysaccharide producing cultures (EPS) as compared with those in cheese made from EPS-negative cheeses. Processed cheeses were manufactured using young (1 day) or 1-month-old EPS-positive or EPS- negative Cheddar cheese and replacing the added water by Ras cheese whey or ultrafiltrated (UF) whey. Moisture and fat of processed cheese were standardized to 54% and 23%, respectively. Exopolysaccharide-positive processed cheese was softer, less chewy and gummy than the EPS-negative cheeses. The hardness and chewiness were lower in processed cheeses made from 1-month-old Cheddar than in the corresponding cheeses made from 1-day-old Cheddar cheese. Sensory scores for texture of EPS positive processed cheeses were higher than those of the EPS-negative cheeses. Gen- erally, processed cheese made from replacing all added water with whey received higher scores in flavor and overall than did the corresponding cheeses made without whey. The obtained results are showing promise for application of salt whey in processed cheese making. Keywords: Processed Cheese; Exopolysaccharide Producing Cultures; Salt Whey; UF Whey 1. Introduction It is well accepted that discharging of whey from dairy industry as waste creates severe pollution due to its high biological oxygen demand (BOD) (35 - 40 g/l) [1]. An- nually, 110 million metric tons of whey is produced worldwide through cheese manufacture [2]. About 50 percent of Egypt’s total milk production is utilized in commercial cheese. Cheese production in Egypt totaled 480,000 metric tons in 2001 and accounted for 2.9 per- cent of the world total cheese. In the 1990s, the whey production in Egypt increased steadily by about six per- cent annually and the amount produced in 2000 was 1,452,500 metric tons [3]. Whey has been used in the production of single cell protein, alcoholic and non-alcoholic beverage, bakery products, and as an additive in dairy products. Ultrafiltra- tion (UF) is generally used to separate proteins in whey from the permeate containing mostly lactose. Whey pro- tein concentrate is an item of worldwide commerce due to its nutritious composition. Salt whey is produced from Domiati, Ras and Cheddar cheese making. The salt level in whey from Domiati cheese is about 8% - 15% whereas it is only about 2% - 5% in whey from Rasand Cheddar cheese making. Salt whey, unlike sweet whey, cannot be conveniently proc- essed because of its high salinity level [4]. Moreover, it has a high biological oxygen demand and chemical oxy- gen demand, which make its disposal a problem [1]. Most cheese manufacturing facilities in Egypt perform land spreading of salt whey. However, this practice in- creases the chloride levels of soil, and elevates the risk of crop damage. One possible application for salt whey is to use it as an ingredient in processed cheese. Processed cheese is a generic term used to describe 3 separate categories of cheese. These categories are pasteurized processed cheese (PC), pasteurized processed cheese food (PCF), and pasteurized processed cheese spread (PCS) [5]. Accord- ing to the Code of Federal Regulations [5], these 3 cate- gories differ on the basis of the requirements for mini- mum fat content on dry matter basis and the maximum allowed moisture content as well as the quantity and the number of optional ingredients that can be used. A typi- cal processed cheese formulation contains substantial amounts of salt and water, and it might be possible to Copyright © 2013 SciRes. FNS  Application of Salt Whey from Egyptian Ras Cheese in Processed Cheese Making 80 replace the salt and water with salt whey. Salt whey as an ingredient can pose certain concerns when utilized in processed cheese. In addition to salt and water, salt whey contains other solids, including whey proteins and lactose that could potentially alter the qual- ity of processed cheese. Various researchers have studied the influence of incorporation of whey proteins on the functionality of processed cheese [6-9]. Gupta and Reu- ter [6] ultrafiltered whey to produce a concentrate with 20% whey proteins and 5.8% lactose, which was utilized as an ingredient to replace 20% of the solids in a PCF formula. They determined that the addition of approxi- mately 2.2% whey protein in the final PCF with an aver- age moisture content of 45% did not affect the quality of processed cheese. The level of lactose present in proc- essed cheese is critical because an excess amount can result in the formation of crystals. This issue has been addressed by other researchers who determined that lac- tose crystallization in processed cheese depends on the maximum concentration of lactose that is soluble in the water phase of processed cheese [10,11]. The Production of processed cheese is a vital sector in the Egyptian dairy industry. Several brands of processed cheeses are available in the market to meet the growing demand of these products. In Egypt, the processed cheese products are prepared by blending of shredded natural cheeses (mainly mixtures of mature Cheddar cheese and young Ras cheese), as well as other dairy and non-dairy ingredients such as skimmed milk, caseinates, whey pro- tein concentrate and vegetable oils [12,13]. The Egyptian processed cheese standards committee covers two main types of these products, the first is con- cerned about the products based on milk-derived ingre- dients and the second regulates the use of products con- taining vegetable oils [14]. The aim of this work is to use salt whey of Ras cheese in making processed cheese. The use of young (1-day-old) EPS-containing low salt Cheddar cheese in making pro- cessed cheese might allow using a significant amount of salt whey as an ingredient. 2. Materials and Methods 2.1. Cheddar Cheese Making Procedure Raw cow’s milk was obtained from the dairy farm at Alexandria University. Raw cow milk (fat: 32 g·kg−1 and acidity: 0.16% - 0.17% as lactic acid) was pasteurized at 74˚C for 15 s. Four replicates of experimental cheeses for each starter mixture were processed using four computer- controlled cheese making vats (INRA, Poligny, France). Starter cultures (R704, DVS culture, Hansen’s Lab., Denmark, 0.15 g·Kg−1), EPS-producing Streptococcus thermophilus (CHCC 3534) were obtained from Chr. Hansen (Hørsholm 2970, Denmark). CaCl2 (0.12 g·Kg−1) were added individually to milk at 32˚C. The inoculated milk was held for 60 min at 32˚C and suitable amount of 2% rennet solution (Chymax-II 500: Chr. Hansen’s Lab., Denmark) was added to each vat to coagulate milk in 30 min. The coagulum was cut into cubes (~2 cm) and the curds were allowed to rest in the whey for 5 - 10 min. The curds were cooked to 39˚C over 30 min and held at this temperature for 30 more minutes. The whey was drained when its pH reached 6.0. After whey drainage, the curd was cheddared and then milled when the pH reached 5.4. The curd was salted at low level (0.8%), hooped in blocks, pressed overnight at 2.5 kg/cm2. The low salted fresh cheese was used in making processed cheese. 2.2. Processed Cheese Making Six treatments of processed cheeses were made using fresh Cheddar cheese containing EPS producing culture and other six treatments were made using Cheddar cheese containing non EPS producing culture. Moisture and fat were standardized to 54% and 23% respectively for all cheeses. The emulsifier (disodium phosphate de- hydrate) was added at 30 g·kg−1 cheese. A direct steam injection cheese cooker was used for processed cheese manufacture. Steam injection at 4.2 kg/cm2 was used and ingredients were heat treated at 82˚C for 3 min. Processed cheeses were packaged and stored at 4˚C until analyses. 2.3. Cheese Composition Analysis Total protein was measured by microKjeldahl [15], and fat content by Gerber method [15]. A Corning flat sur- face combination electrode was used to measure the pH on the well-mixed ground cheese samples. The moisture content was determined using the moisture analyzer (Mettler Toledo Model HR73). Salt content was deter- mined using chloride meter (Jenway, England, UK). 2.4. Texture Profile Analysis (TPA) A two-bite compression test was performed using the Texture Analyzer. Samples for texture profile analysis (TPA) were obtained from the middle of the whole cheese block rather than from the surface to avoid sur- face effects. A two-bite penetration test was performed using the Texture Analyser (TA1000, CNS-Farnell, Eng- land) with the TA 17 probe (30˚ and 25 mm diameter) and operated at a crosshead speed of 1 mm·s−1 and pene- tration distance of 10 mm. Hardness, cohesiveness, sprin- giness and chewiness were evaluated in triplicate ac- cording to the definitions given by IDF [16]. 2.5. Sensory Evaluation Twelve panelists graded coded samples of cheese. Sam- Copyright © 2013 SciRes. FNS  Application of Salt Whey from Egyptian Ras Cheese in Processed Cheese Making Copyright © 2013 SciRes. FNS 81 ples were presented in identical containers labeled with a random three digit number. A body and texture score of 35, flavor scores of 45 and color score is 20. 2.6. Statistical Analysis Data reported are the average of three measurements. The SAS statistical analysis software package [17] was used for analysis of variance. Differences were consid- ered significant at P < 0.05. 3. Results and Discussion 3.1. Chemical Composition and pH of Cheddar Cheese The chemical composition of 1 day and 1 month old Cheddar cheese made with EPS producing culture or EPS non producing culture is summarized in Table 1. In agreement with previous findings [18], the EPS-produc- ing culture increased the moisture of Cheddar cheese (P < 0.05), this resulted in a lower fat and protein percent- age. No differences (P > 0.05) were observed in pH or salt among cheeses with same old, while the pH is low in 1 month old cheese compared with 1 day old cheese. The protein and fat levels in all cheeses is moisture dependent, the protein content ranged from 22.2% to 25.7%. 3.2. Texture Profile Analysis of Cheddar Cheese used in Making Processed Cheese The parameters of texture profile analysis (hardness, co- hesiveness, adhesiveness, springiness and chewiness) at 1 and 30 days old of experimental Cheddar cheeses are shown in Table 2. Generally, all these parameters are lower in cheese made with EPS producing culture when compared to cheeses made with non EPS producing cul- ture. Values for these parameters tended to increase gra- dually during the 30 days of ripening at rates that de- pended on the moisture loss. At day one of manufacture, cheese made with non EPS producing culture was sig- nificantly harder than cheese made with EPS producing culture. The hardness increased after 30 days of ripening. The increase of hardness in one month old cheese is re- lated to decreasing moisture which acts as a plasticizer in the protein matrix, thereby making it less elastic and more susceptible to fracture upon compression [19]. In general, EPS producing culture reduces the hardness of cheese which might be due to the increased moisture content. Cohesiveness increased after 30 days of ripening in both cheeses. The springiness is also increased asthe rip- ening period progressed. Chewiness was higher (P < 0.05) in cheese made with non EPS producing culture than in cheese made with EPS producing culture. 3.3. Chemical Composition of Salt Whey and UF Whey The chemical composition of salt and ultra filtrated whey is summarized in Table 3. The moisture content in whey is 90.29%, and it decreased to 62.41% after ultrafiltration. The salt content reduced in ultra filtrated whey from 4.63 to 3.91%. Table 1. Chemical composition and pH of Cheddar cheese used in making processed cheese. Sample pH Acidity% Fat% Moisture% Salt% Protein% One day old Cheddar with Non EPS 5.15a 2.2b 32b 37.7a 0.86b 24.3b One month old Cheddar with Non EPS 5.01b 2.4a 35a 34.4b 0.95a 25.7a One day old Cheddar with EPS 5.12a 2.2b 28d 44.2a 0.90b 22.2c One month old Cheddar with EPS 4.93b 2.5a 30c 40.6b 1.01a 23.9b a,b,c,d means within a column with no common subscript significant differ P < 0.05. Table 2. Texture profile analysis of Cheddar cheese used in making processed cheese. Sample Hardness gf Adhesiveness gfCohesiveness ratioSpringiness mmModulus Guminess N Chewiness mJ One day old Cheddar with Non EPS 240.6c 15.3c 2.42b 5.3c 22.4b 582b 3086c One month old Cheddar with Non EPS 324.2a 21.5a 2.75a 6.7a 38.1a 892a 5973a One day old Cheddar with EPS 142.8d 10.2d 1.81d 5.4c 13.0c 258c 1396d One month old Cheddar with EPS 274.2b 18.6b 2.15c 6.1b 25.4b 590b 3596b a,b,c,d means within a column with no common subscript significant differ P < 0.05.  Application of Salt Whey from Egyptian Ras Cheese in Processed Cheese Making 82 3.4. Processed Cheese Formulations Processed cheese formulations are shown in Tables 4 and 5. Lower amount of Cheddar cheese and non skim- med milk powder (SMP) have been used in making processed cheese when UF salt whey was utilized, while low amount of SMP was used in treatments contain salt whey comparing with control. The results suggested that utilization of salt whey or UF salt whey could reduce the production cost of processed cheese. 3.5. Actual Chemical Composition There were no significant differences (P > 0.05) in che- mical composition and pH among all processed cheeses (Tables 6 and 7). 3.6. Textural Characteristics of Processed Cheese The hardness of processed cheeses is shown in Tables 8 and 9. The blend of UF whey was softer than all pro- Table 3. Chemical composition of Ras cheese salt whey*. Sample Salt% Fat% Moisture% Ras cheese salt whey4.63 ± 0.14 0.8 ± 0.05 90.29 ± 0.8 Ultra filtrated whey 3.91 ± 0.12 3.2 ± 0.05 62.41 ± 0.7 *The average of three replicates. Table 4. Formulations of processed cheese using Cheddar cheese made wi th EP S non pr oducing culture. T1 T2 T3 T4 T5 T6 Ingredient Quantity (Kg) Cheddar cheese 3.6 3.6 3 3.6 3.6 3 Skim milk powder 0.90 0.75 - 0.60 0.35 - Butter oil 1.15 1.15 1.60 1.30 1.15 1.50 Emulsifier 0.30 0.30 0.30 0.30 0.30 0.30 Condensate 1.00 1.00 1.00 1.00 1.00 1.00 Salt whey - 2.10 - - 2.10 UF whey 2.40 - 2.50 Salt 0.14 0.05 0.09 0.18 0.05 0.05 Water 2.90 1.05 1.5 3 1.3 1.5 T1 = processed cheese made using cheddar cheese 1 d old without salt whey (control); T2 = processed cheese made using cheddar cheese 1 d old with salt whey; T3 = processed cheese made using cheddar cheese 1 d old with UF whey; T4 = processed cheese made using cheddar cheese 1 m old without salt whey; T5 = processed cheese made using cheddar cheese 1 m old, with salt whey; T6 = processed cheese made using cheddar cheese 1 m old with UF whey. Table 5. Formulations of processed cheese using Ch eddar cheese made with EP S producing culture. T1 T2 T3 T4 T5 T6 Ingredient Quantity (Kg) Cheddar cheese 4.00 4.00 3.40 4.00 4.00 3.40 Skim milk powder 0.90 0.75 0.00 0.60 0.35 0.00 Butter oil 1.15 1.15 1.60 1.30 1.15 1.50 Emulsifier 0.30 0.30 0.30 0.30 0.30 0.30 Condensate 1.00 1.00 1.00 1.00 1.00 1.00 Salt whey 0.00 2.10 - - 2.10 UF whey 2.40 - 2.50 Salt 0.14 0.05 0.09 0.18 0.05 0.05 Water 2.50 0.65 1.20 2.60 0.95 1.20 T1 = processed cheese made using cheddar cheese 1 d old without salt whey (control); T2 = processed cheese made using cheddar cheese 1 d old with salt whey; T3 = processed cheese made using cheddar cheese 1 d old with UF whey; T4 = processed cheese made using cheddar cheese 1 m old without salt whey; T5 = processed cheese made using cheddar cheese 1 m old, with salt whey; T6 = processed cheese made using cheddar cheese 1 m old with UF whey. Copyright © 2013 SciRes. FNS  Application of Salt Whey from Egyptian Ras Cheese in Processed Cheese Making 83 Table 6. Actual chemical composition of processed cheese made using cheddar cheese containing EPS non producing culture . parameters T1 T2 T3 T4 T5 T6 pH 5.61 ± 0.02 5.63 ± 0.03 5.62 ± 0.01 5.68 ± 0.02 5.64 ± 0.02 5.61 ± 0.01 Fat% 22.3 ± 0.15 22.5 ± 0.2 22.0 ± 0.1 22.5 ± 0.2 21.9 ± 0.2 22.5 ± 0.15 Moisture% 51.45 ± 0.22 51.78 ± 0.17 52.14 ± 0.18 52.37 ± 0.22 52.71 ±0.14 51.88 ± 0.13 Salt% 1.21 ± 0.02 1.11 ± 0.03 1.19 ± 0.02 1.19 ± 0.03 1.10 ± 0.02 1.16 ± 0.02 Protein% 22.12 ± 0.14 21.42 ± 0.17 22.21 ± 0.24 21.53 ± 0.21 22.41 ± 0.18 21.92 ± 0.14 T1 = processed cheese made using cheddar cheese 1 d old without salt whey (control); T2 = processed cheese made using cheddar cheese 1 d old with salt whey; T3 = processed cheese made using cheddar cheese 1 d old with UF whey; T4 = processed cheese made using cheddar cheese 1 m old without salt whey; T5 = processed cheese made using cheddar cheese 1 m old, with salt whey; T6 = processed cheese made using cheddar cheese 1 m old with UF whey. Table 7. Actual chemical composition of processed cheese made using cheddar cheese containing EPS pr oduc ing c ultur e. parameters T1 T2 T3 T4 T5 T6 pH 5.65 ± 0.04 5.67 ± 0.03 5.64 ± 0.04 5.61 ± 0.02 5.62 ± 0.01 5.66 ± 0.04 Fat% 22.5 ± 0.2 22.1 ± 0.3 22.7 ± .02 22.7 ± 0.3 22.6 ± 0.4 21.8 ± 0.4 Moisture% 52.14 ± 0.22 50.98 ± 0.31 51.85 ± 0.14 51.45 ± 0.15 51.87 ± 0.14 52.01 ± 0.19 Salt% 1.14 ± 0.04 1.17 ± 0.03 1.12 ± 0.05 1.15 ± 0.03 1.14 ± 0.06 1.12 ± 0.3 Protein% 22.12 ± 0.12 21.43 ± 0.17 22.22 ± 0.21 21.51 ± 0.17 22.42 ± 0.15 21.91 ± 0.13 T1 = processed cheese made using cheddar cheese 1 d old without salt whey (control); T2 = processed cheese made using cheddar cheese 1 d old with salt whey; T3 = processed cheese made using cheddar cheese 1 d old with UF whey; T4 = processed cheese made using cheddar cheese 1 m old without salt whey; T5 = processed cheese made using cheddar cheese 1 m old, with salt whey; T6 = processed cheese made using cheddar cheese 1 m old with UF whey. Table 8. Texture profile analysis of processed cheese making using Cheddar cheese made with EPS non producing culture and salt whey or ultra-filtrated salt whey. Ingredient T1 T2 T3 T4 T5 T6 Hardness gf 254.5a 215.7b 184.6c 201.5b 168.4d 126.8e Cohesiveness gf 2.18a 1.96b 1.85b 1.65c 1.57c 1.48d Adhesiveness gf 16.7a 15.6b 13.8c 12.4cd 12.1d 11.8e Springiness mm 8.45a 8.32a 7.97b 8.10ab 7.86b 7.74c Gumminess N 554.8a 422.8b 341.5c 332.5c 264.4d 187.7e Chewness mJ 4688.1a 3517.5b 2721.8c 2693.0c 2078.1d 1452.5e a,b,c,d,e means within a row with no common subscript significant differ P < 0.05. T1 = processed cheese made using cheddar cheese 1 d old without salt whey (control); T2 = processed cheese made using cheddar cheese 1 d old with salt whey; T3 = processed cheese made using cheddar cheese 1 d old with UF whey; T4 = processed cheese made using cheddar cheese 1 m old without salt whey; T5 = processed cheese made using cheddar cheese 1 m old, with salt whey; T6 = processed cheese made using cheddar cheese 1 m old with UF whey. cessed cheeses made from ingredient without whey or with salt whey. Although having the same composition, processed cheeses made using EPS-positive Cheddar cheese were softer (P < 0.05) than the corresponding cheese made using the EPS-negative Cheddar. Awad, et al. [20] found that young Cheddar cheese containing EPS was softer than that made with no EPS. This was due, in part, to the higher moisture level in the former cheese. However, because there were no differences in chemical composition and pH among all processed cheeses, the differences in hardness should be related to characteris- tics of the EPC Cheddar cheese. The type, characteristic, and age of the base cheese play a major role in control- ling the textural, viscoelastic, functional, microstructural, and sensorial properties of Processed cheese [21-24]. Major differences in texture and microstructure were seen between EPS-positive and negative reduced fat Cheddar cheeses [20,25]. Exopolysaccharides interfere with protein-protein interactions and act as a lubricant or plasticizer between proteins in Cheddar cheese, resulting in reduced firmness [25,26]. Cheddar cheese made with EPS-producing cultures exhibited a porous structure in Copyright © 2013 SciRes. FNS 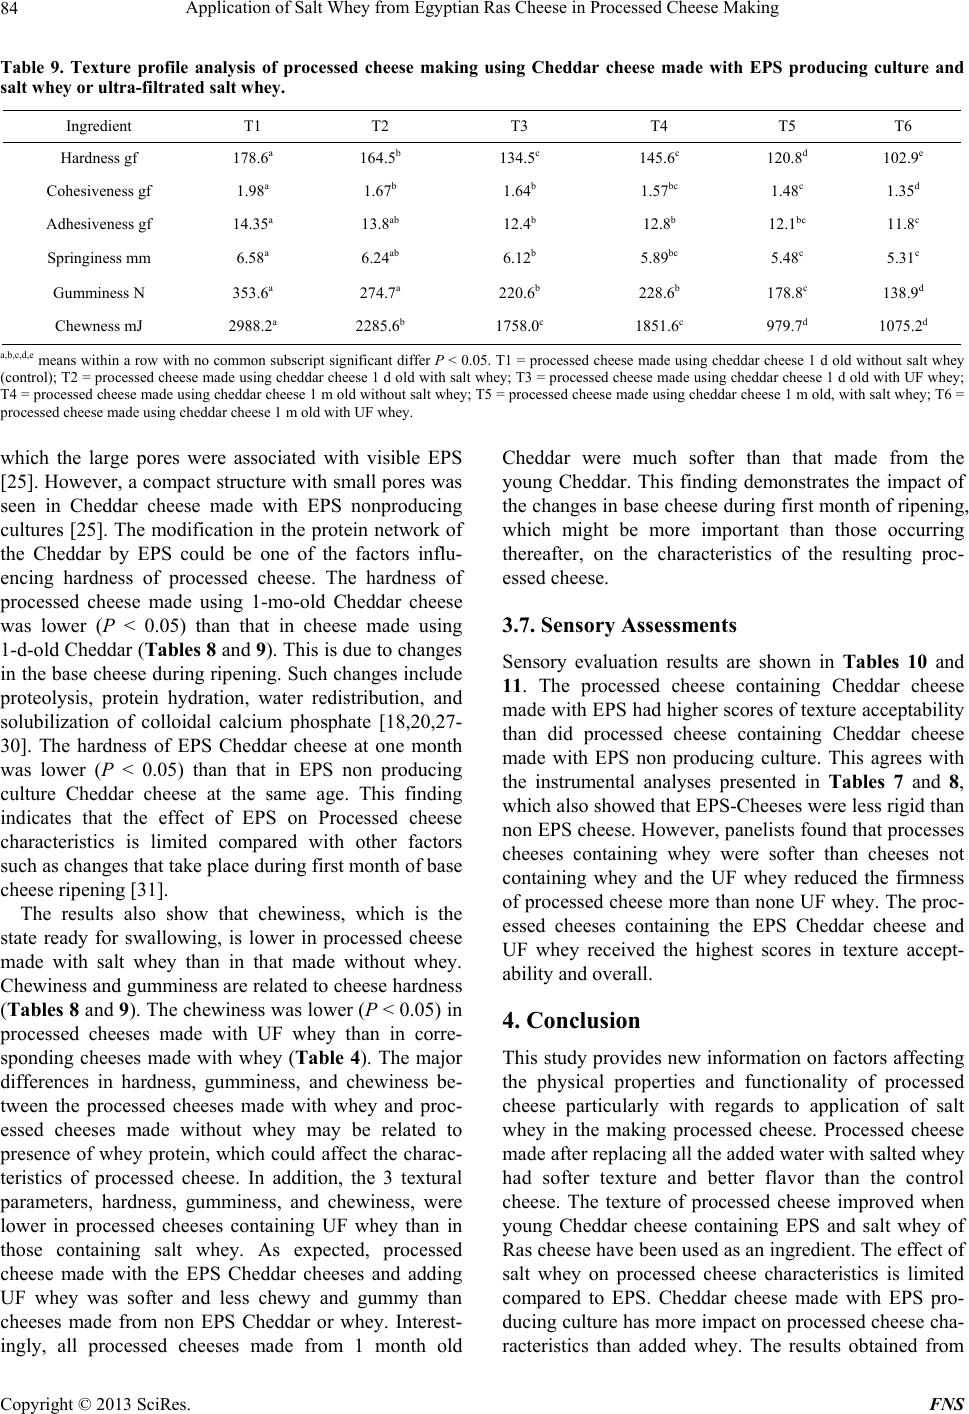 Application of Salt Whey from Egyptian Ras Cheese in Processed Cheese Making 84 Table 9. Texture profile analysis of processed cheese making using Cheddar cheese made with EPS producing culture and salt whey or ultra-filtrated salt whey. Ingredient T1 T2 T3 T4 T5 T6 Hardness gf 178.6a 164.5b 134.5c 145.6c 120.8d 102.9e Cohesiveness gf 1.98a 1.67b 1.64b 1.57bc 1.48c 1.35d Adhesiveness gf 14.35a 13.8ab 12.4b 12.8b 12.1bc 11.8c Springiness mm 6.58a 6.24ab 6.12b 5.89bc 5.48c 5.31c Gumminess N 353.6a 274.7a 220.6b 228.6b 178.8c 138.9d Chewness mJ 2988.2a 2285.6b 1758.0c 1851.6c 979.7d 1075.2d a,b,c,d,e means within a row with no common subscript significant differ P < 0.05. T1 = processed cheese made using cheddar cheese 1 d old without salt whey (control); T2 = processed cheese made using cheddar cheese 1 d old with salt whey; T3 = processed cheese made using cheddar cheese 1 d old with UF whey; T4 = processed cheese made using cheddar cheese 1 m old without salt whey; T5 = processed cheese made using cheddar cheese 1 m old, with salt whey; T6 = processed cheese made using cheddar cheese 1 m old with UF whey. which the large pores were associated with visible EPS [25]. However, a compact structure with small pores was seen in Cheddar cheese made with EPS nonproducing cultures [25]. The modification in the protein network of the Cheddar by EPS could be one of the factors influ- encing hardness of processed cheese. The hardness of processed cheese made using 1-mo-old Cheddar cheese was lower (P < 0.05) than that in cheese made using 1-d-old Cheddar (Table s 8 and 9). This is due to changes in the base cheese during ripening. Such changes include proteolysis, protein hydration, water redistribution, and solubilization of colloidal calcium phosphate [18,20,27- 30]. The hardness of EPS Cheddar cheese at one month was lower (P < 0.05) than that in EPS non producing culture Cheddar cheese at the same age. This finding indicates that the effect of EPS on Processed cheese characteristics is limited compared with other factors such as changes that take place during first month of base cheese ripening [31]. The results also show that chewiness, which is the state ready for swallowing, is lower in processed cheese made with salt whey than in that made without whey. Chewiness and gumminess are related to cheese hardness (Tables 8 and 9). The chewiness was lower (P < 0.05) in processed cheeses made with UF whey than in corre- sponding cheeses made with whey (Table 4). The major differences in hardness, gumminess, and chewiness be- tween the processed cheeses made with whey and proc- essed cheeses made without whey may be related to presence of whey protein, which could affect the charac- teristics of processed cheese. In addition, the 3 textural parameters, hardness, gumminess, and chewiness, were lower in processed cheeses containing UF whey than in those containing salt whey. As expected, processed cheese made with the EPS Cheddar cheeses and adding UF whey was softer and less chewy and gummy than cheeses made from non EPS Cheddar or whey. Interest- ingly, all processed cheeses made from 1 month old Cheddar were much softer than that made from the young Cheddar. This finding demonstrates the impact of the changes in base cheese during first month of ripening, which might be more important than those occurring thereafter, on the characteristics of the resulting proc- essed cheese. 3.7. Sensory Assessments Sensory evaluation results are shown in Tables 10 and 11. The processed cheese containing Cheddar cheese made with EPS had higher scores of texture acceptability than did processed cheese containing Cheddar cheese made with EPS non producing culture. This agrees with the instrumental analyses presented in Tables 7 and 8, which also showed that EPS-Cheeses were less rigid than non EPS cheese. However, panelists found that processes cheeses containing whey were softer than cheeses not containing whey and the UF whey reduced the firmness of processed cheese more than none UF whey. The proc- essed cheeses containing the EPS Cheddar cheese and UF whey received the highest scores in texture accept- ability and overall. 4. Conclusion This study provides new information on factors affecting the physical properties and functionality of processed cheese particularly with regards to application of salt whey in the making processed cheese. Processed cheese made after replacing all the added water with salted whey had softer texture and better flavor than the control cheese. The texture of processed cheese improved when young Cheddar cheese containing EPS and salt whey of Ras cheese have been used as an ingredient. The effect of salt whey on processed cheese characteristics is limited compared to EPS. Cheddar cheese made with EPS pro- ducing culture has more impact on processed cheese cha- racteristics than added whey. The results obtained from Copyright © 2013 SciRes. FNS 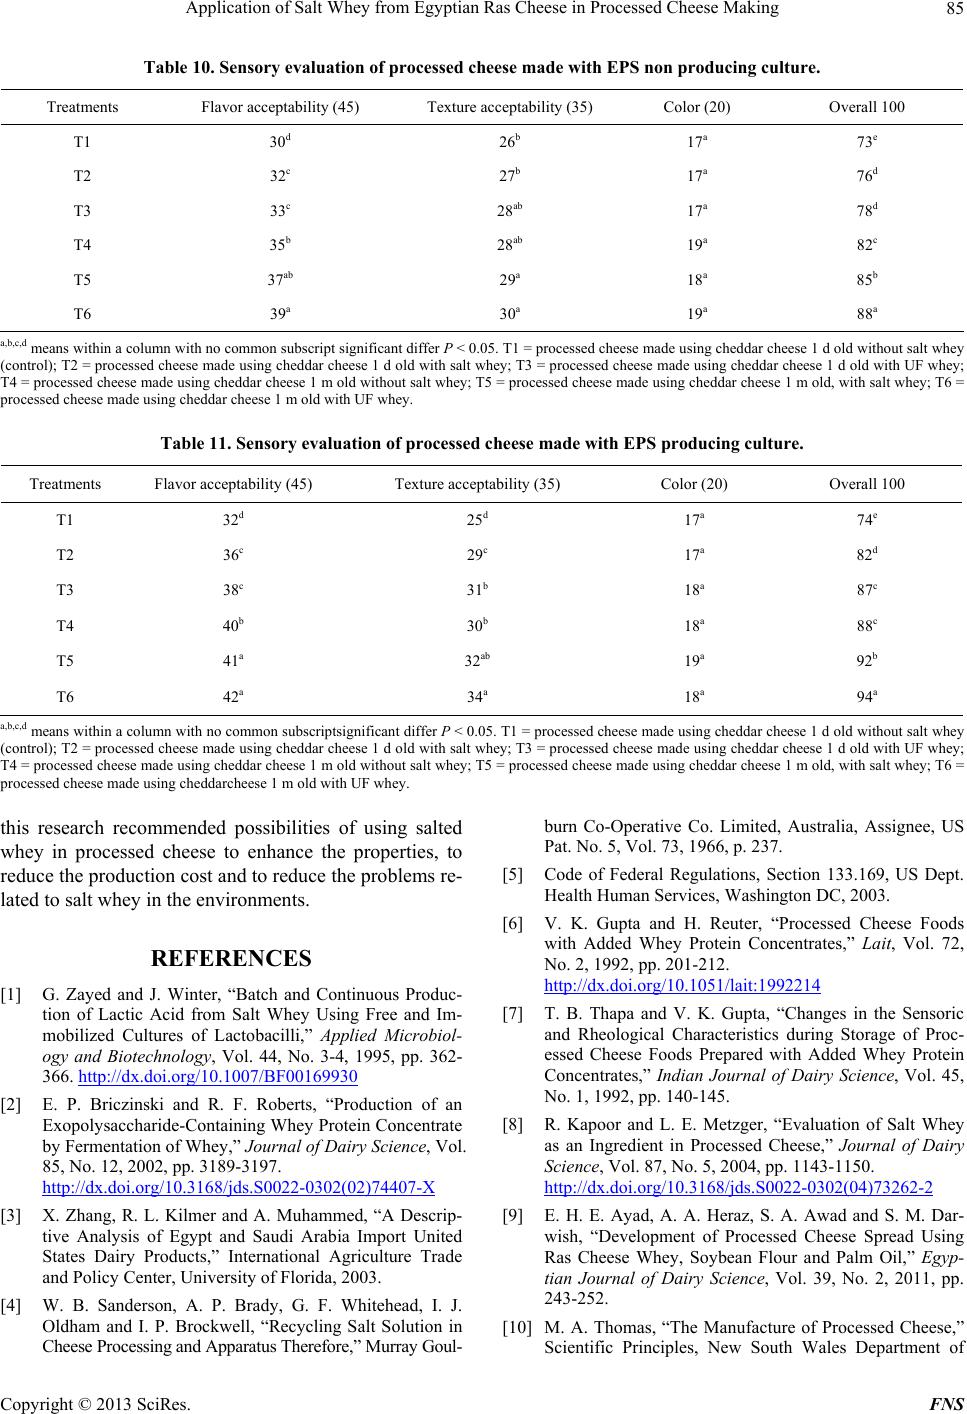 Application of Salt Whey from Egyptian Ras Cheese in Processed Cheese Making 85 Table 10. Sensory evaluation of processed cheese made with EPS non producing culture. Treatments Flavor acceptability (45) Texture acceptability (35) Color (20) Overall 100 T1 30d 26b 17a 73e T2 32c 27b 17a 76d T3 33c 28ab 17a 78d T4 35b 28ab 19a 82c T5 37ab 29a 18a 85b T6 39a 30a 19a 88a a,b,c,d means within a column with no common subscript significant differ P < 0.05. T1 = processed cheese made using cheddar cheese 1 d old without salt whey (control); T2 = processed cheese made using cheddar cheese 1 d old with salt whey; T3 = processed cheese made using cheddar cheese 1 d old with UF whey; T4 = processed cheese made using cheddar cheese 1 m old without salt whey; T5 = processed cheese made using cheddar cheese 1 m old, with salt whey; T6 = processed cheese made using cheddar cheese 1 m old with UF whey. Table 11. Sensory evaluation of processed cheese made with EPS producing cultur e . Treatments Flavor acceptability (45) Texture acceptability (35) Color (20) Overall 100 T1 32d 25d 17a 74e T2 36c 29c 17a 82d T3 38c 31b 18a 87c T4 40b 30b 18a 88c T5 41a 32ab 19a 92b T6 42a 34a 18a 94a a,b,c,d means within a column with no common subscriptsignificant differ P < 0.05. T1 = processed cheese made using cheddar cheese 1 d old without salt whey (control); T2 = processed cheese made using cheddar cheese 1 d old with salt whey; T3 = processed cheese made using cheddar cheese 1 d old with UF whey; T4 = processed cheese made using cheddar cheese 1 m old without salt whey; T5 = processed cheese made using cheddar cheese 1 m old, with salt whey; T6 = processed cheese made using cheddarcheese 1 m old with UF whey. this research recommended possibilities of using salted whey in processed cheese to enhance the properties, to reduce the production cost and to reduce the problems re- lated to salt whey in the environments. REFERENCES [1] G. Zayed and J. Winter, “Batch and Continuous Produc- tion of Lactic Acid from Salt Whey Using Free and Im- mobilized Cultures of Lactobacilli,” Applied Microbiol- ogy and Biotechnology, Vol. 44, No. 3-4, 1995, pp. 362- 366. http://dx.doi.org/10.1007/BF00169930 [2] E. P. Briczinski and R. F. Roberts, “Production of an Exopolysaccharide-Containing Whey Protein Concentrate by Fermentation of Whey,” Journal of Dairy Science, Vol. 85, No. 12, 2002, pp. 3189-3197. http://dx.doi.org/10.3168/jds.S0022-0302(02)74407-X [3] X. Zhang, R. L. Kilmer and A. Muhammed, “A Descrip- tive Analysis of Egypt and Saudi Arabia Import United States Dairy Products,” International Agriculture Trade and Policy Center, University of Florida, 2003. [4] W. B. Sanderson, A. P. Brady, G. F. Whitehead, I. J. Oldham and I. P. Brockwell, “Recycling Salt Solution in Cheese Processing and Apparatus Therefore,” Murray Goul- burn Co-Operative Co. Limited, Australia, Assignee, US Pat. No. 5, Vol. 73, 1966, p. 237. [5] Code of Federal Regulations, Section 133.169, US Dept. Health Human Services, Washington DC, 2003. [6] V. K. Gupta and H. Reuter, “Processed Cheese Foods with Added Whey Protein Concentrates,” Lait, Vol. 72, No. 2, 1992, pp. 201-212. http://dx.doi.org/10.1051/lait:1992214 [7] T. B. Thapa and V. K. Gupta, “Changes in the Sensoric and Rheological Characteristics during Storage of Proc- essed Cheese Foods Prepared with Added Whey Protein Concentrates,” Indian Journal of Dairy Science, Vol. 45, No. 1, 1992, pp. 140-145. [8] R. Kapoor and L. E. Metzger, “Evaluation of Salt Whey as an Ingredient in Processed Cheese,” Journal of Dairy Science, Vol. 87, No. 5, 2004, pp. 1143-1150. http://dx.doi.org/10.3168/jds.S0022-0302(04)73262-2 [9] E. H. E. Ayad, A. A. Heraz, S. A. Awad and S. M. Dar- wish, “Development of Processed Cheese Spread Using Ras Cheese Whey, Soybean Flour and Palm Oil,” Egyp- tian Journal of Dairy Science, Vol. 39, No. 2, 2011, pp. 243-252. [10] M. A. Thomas, “The Manufacture of Processed Cheese,” Scientific Principles, New South Wales Department of Copyright © 2013 SciRes. FNS  Application of Salt Whey from Egyptian Ras Cheese in Processed Cheese Making 86 Agriculture, Richmond, 1973. [11] V. L. Zehren and D. D. Nusbaum, “Processed Cheese,” 2nd Edition, Cheese Reporter Publishing Co. Inc., Madi- son, 2000. [12] M. H. Abd El Salam, S. El Shibny and N. S. Ahmed, “Studies on Processed Cheese in Egypt,” Egyptian Jour- nal of Dairy Science, Vol. 33, No. 1, 2005, p. 129. [13] S. A. Abou-Donia, “Egyptian Pasteurized and Spread Cheeses: An Overview,” Alexandria Journal of Science and Technology, Vol. 3, No. 1, 2006, p. 51. [14] Egyptian Standards, “Processed Cheeses and Spread- able,” ES: 999-1/2002, Ministry of Industry and Techno- logical Development, Egypt, 2002. [15] AOAC, “Official Methods of Analysis,” Association of Official Analytical Chemists, Arlington, 2000. [16] IDF, “Rheological and Fracture Properties of Cheeses,” IDF Standard 268, Brussels, International Dairy Federa- tion, 1991. [17] SAS®, “User’s Guide: Statistics Version,” 8th Edition, SAS Institute, Inc., Cary, 1999. [18] S. Awad, A. N. Hassan and F. Halaweish, “Applications of Exopolysaccharides-Producing Cultures in Reduced- Fat Cheddar Cheese: Composition and Proteolysis,” Jour- nal of Dairy Science, Vol. 88, No. 12, 2005, pp. 4195- 4203. http://dx.doi.org/10.3168/jds.S0022-0302(05)73105-2 [19] P. F. Fox, T. P. Guinee, T. M. Cogan and P. L. H. McSweeney, “Fundamental of Cheese Science,” Cheese Rheology and Texture, Aspen Publisher Inc., Jaithers Burg, 2000, pp. 298-340. [20] S. Awad, A. N. Hassan and K. Muthukumarappan, “Ap- plications of Exopolysaccharides Producing Culture in Reduced Fat Cheddar Cheese Making. Texture and Melt- ing Properties,” Journal of Dairy Science, Vol. 88, No. 12, 2005, pp. 4204-4213. http://dx.doi.org/10.3168/jds.S0022-0302(05)73106-4 [21] E. L. Bowland and E. A. Foegeding, “Small Strain Oscil- latory Shear and Microstructural Analyses of a Model Processed Cheese,” Journal of Dairy Science, Vol. 84, No. 11, 2001, pp. 2372-2380. http://dx.doi.org/10.3168/jds.S0022-0302(01)74686-3 [22] M. R. Acharya and V. V. Mistry, “Effect of Vacuum Condensed or Ultrafiltered Milk on Pasteurized Process Cheese,” Journal of Dairy Science, Vol. 88, No. 9, 2005, pp. 3037-3043. http://dx.doi.org/10.3168/jds.S0022-0302(05)72984-2 [23] S. J. French, K. M. Lee, M. Decastro and W. J. Harper, “Effects of Different Protein Concentrates and Emulsify- ing Salt Conditions on the Characteristics of a Processed Cheese Product,” Milchwissenshaft, Vol. 57, No. 1, 2002, pp. 79-82. [24] T. A. Glenn, C. R. Daubert, B. E. Farkas and L. A. Ste- fanski, “A Statistical Analysis of Creaming Variables Im- pacting Processed Cheese Melt Quality,” Journal of Food Quality, Vol. 26, No. 4, 2003, pp. 299-321. http://dx.doi.org/10.1111/j.1745-4557.2003.tb00247.x [25] A. N. Hassan and S. Awad, “Applications of Exopoly- saccharides Producing Culture in Reduced Fat Cheddar Cheese Making, Cryo-Scanning Electron Microscopy Ob- servations,” Journal of Dairy Science, Vol. 88, No. 12, 2005, pp. 4214-4220. http://dx.doi.org/10.3168/jds.S0022-0302(05)73107-6 [26] A. N. Hassan and J. F. Frank, “Modification of Micro- structure and Texture of Rennet Curd by Using a Cap- sule-Forming Non-Ropy Lactic Culture,” Journal of Dairy Research, Vol. 64, No. 1, 1997, pp. 115-121. http://dx.doi.org/10.1017/S0022029996002002 [27] L. K. Creamer and N. F. Olson, “Rheological Evaluation of Maturing Cheddar Cheese,” Journal of Food Science, Vol. 47, No. 2, 1982, pp. 631-636. [28] J. A. Lucey and P. F. Fox, “Importance of Calcium and Phosphate in Cheese Manufacture: A Review,” Journal of Dairy Science, Vol. 76, No. 6, 1993, pp. 1714-1724. http://dx.doi.org/10.3168/jds.S0022-0302(93)77504-9 [29] D. McMahon, R. L. Fife and C. Oberg, “Water Partition- ing in Mozzarella Cheese and Its Relationship to Cheese Meltability,” Journal of Dairy Science, Vol. 82, No. 7, 1999, pp. 1361-1369. http://dx.doi.org/10.3168/jds.S0022-0302(99)75361-0 [30] J. A. Lucey, M. E. Johnson and D. S. Horne, “Perspec- tives on the Basis of the Rheology and Texture Properties of Cheese,” Journal of Dairy Science, Vol. 86, No. 9, 2003, pp. 2725-2743. http://dx.doi.org/10.3168/jds.S0022-0302(03)73869-7 [31] A. N. Hassan, S. Awad and V. Mistry, “Reduced Fat Process Cheese Made from Young Reduced Fat Cheddar Cheese Manufactured with Exopolysaccharide-Producing Cultures,” Journal of Dairy Science, Vol. 90, No. 8, 2007, pp. 3604-3612. http://dx.doi.org/10.3168/jds.2007-0141 Copyright © 2013 SciRes. FNS
|