Paper Menu >>
Journal Menu >>
 Journal of Geographic Information System, 2011, 3, 50-61 doi:10.436/jgis.2011.31004 Published Online January 2011 (http://www.SciRP.org/journal/jgis) Copyright © 2011 SciRes. JGIS A GIS-Based Multicriteria Decision Analysis Approach for Mapping Accessibility Patterns of Housing Development Sites: A Case Study in Canmore, Alberta Yunliang Meng1, Jacek Malczewski2, Soheil Boroushaki3 1School of Social Work, York University, Toronto, Ontario, Canada 2,3Department of Geography, The University of Western Ontario, London, Ontario, Canada E-mail: yunliang@yorku.ca, jmalczew@uwo.ca, sboroush@uwo.ca Received August 31, 2010; revised September 31, 2010; accepted November 19, 2010 Abstract This paper presents a Geographic Information System (GIS) based multicriteria decision analysis approach for mapping accessibility patterns of housing development sites in Canmore, Alberta. The approach involves integrating two multicriteria decision methods (Analytical Hierarchy Process and Ordered Weighted Aver- aging) in a raster GIS environment, and incorporating the linguistic quantifier concept as a method for ob- taining the order weights. The approach facilitates a wide range of location (decision) strategies to be gener- ated and examined. The aim of the study is to help the housing development authorities in addressing the uncertainty involved in the decision making process, achieving a better understanding of the alternative ac- cessibility patterns. It also assists the authorities in evaluating and prioritizing the potential housing devel- opment sites in terms of accessibility levels. Keywords: Accessibility, AHP-OWA Procedures, GIS, Housing Development 1. Introduction The accessibility to services, facilities and amenities is an essential factor affecting evaluation of potential sites for housing development [1,2]. In many regions, urban plans ensure that individuals have some minimal levels of accessibility to the public sector facilities, such as schools, emergency services, and recreation amenities. At the same time, an essential element of location strat- egy for housing development is to avoid proximity to noxious facilities (e.g., waste disposal sites, gas depots, and chemical factories). It is noted that the results of accessibility evaluation depend on the definition of accessibility [3,4]. In this paper, we adopt a definition proposed by Dalvi, who defines accessibility as “the ease with which any land- -use activity can be reached from a particular location, using a particular transportation system” [5]. The con- cept of accessibility can be operationalized in terms of the average and maximum distance [6-8]. The two methods of measuring accessibility originate from a normative perspective on location analysis, in which the most often used objectives are: 1) to maximize the geo- graphical efficiency (or minimize total travel cost for customers), and 2) to maximize the geographical equity (or to minimize travel cost for the farthest customers). The accessibility to public and private sector facilities has often been analyzed using GIS-based approaches [4, 9-12]. This paper focuses on measuring of accessibility in terms of the spatial distributions of salutary facilities (e.g., the supply facilities such as hospitals, fire stations, and schools) and noxious facilities (e.g., gas tanks and heliport) relative to the locations of demand (the poten- tial housing development sites). The average and maxi- mum distance methods are employed to explore the trade-off between geographical efficiency and equity [6-8]. The average distance method measures the average distance that residents living in a particular neighbour- hood have to travel to be served. The measure is primar- ily concerned with the efficiency of spatial distribution of facilities. The larger is the average distance to a facil- ity, the lower is the accessibility level to the facility. The maximum distance method measures the distance that neighbourhood residents have to reach the farthest facil- ity of interest. This approach attempts to minimize the  Y. L. MENG ET AL. Copyright © 2011 SciRes. JGIS 51 longest travel distance to a facility in a given area. The maximum distance method mainly addresses the issue of equity in accessibility to salutary or noxious facilities. It is also inversely related to the accessibility level to a facility. In the context of housing development, a location may have good access to some salutary facilities (e.g., schools), but not to others (e.g., community centres) or be close to noxious facilities. Therefore, housing devel- opers have to trade off the benefits and costs of having access to different facilities. In this study, the land suit- ability involves evaluation, classification and prioritiza- tion of the potential housing development sites according to their accessibility to various facilities. This type of problems can be tackled using GIS-based Multicriteria Decision Analysis (GIS-MCDA) procedures [13]. GIS- MCDA can be thought of as a process that combines and transforms geographical data regarding accessibility to facilities and value judgments of decision maker(s) to obtain accessibility patterns of potential housing devel- opment sites. Central to GIS-MCDA is the aggregation algorithms or decision rules [13]. In this study, two MCDA decision rules-Analytical Hierarchy Process (AHP) and the Ordered Weighted Averaging (OWA) - are used [14,15]. The main objectives of this paper are: 1) to implement AHP-OWA procedures to map accessibil- ity patterns of housing development sites for determining the land suitability, and 2) to generate several scenarios to explore how the uncertainty in the decision makers’ judgments can affect the MCDA outcomes. This paper is organized as follows. Section 2 gives a review of the literature on the AHP, OWA, and AHP- OWA procedures. Section 3 presents a case study of mapping accessibility patterns in the context of housing development in Canmore, Alberta. Section 4 gives con- clusions regarding the capabilities of the GIS-MCDA approach and findings. 2. AHP and OWA 2.1. AHP Over the last decade or so, a number of MCDA decision rules have been implemented in the GIS environment, including Weighted Linear Combination (WLC) [16], ideal point methods [17], concordance analysis [18], and AHP [19]. AHP was originally developed in order to generate a simple way to help people make complex de- cisions. Later, the power and simplicity of AHP has led to a widespread acceptance and usage of the method [19-21]. The first step in AHP is to decompose a particular problem into a hierarchy that consists of all essential elements of the problem. In developing a hierarchy, the top level is the ultimate goal of the decision analysis. The hierarchy then descends from the general goal to the more specific elements of the problem (e.g., objectives, attributes, and alternatives). In this study, a simple four-level hierarchical structure is developed (see Sub- section 3.3). The second step is to generate objective and attribute weights using pairwise comparison procedure. The pair- wise comparison method employs an underlying scale with odd values from 1 to 9 to rate the relative prefer- ences for two elements of the hierarchy. If there is a need, then intermediate values (2, 4, 6, 8) between two adja- cent intensities can be used. The pairwise comparison matrix has the following form: A = [apq]n×n, where apq is the pairwise comparison rating for attribute p and attrib- ute q. The matrix A is reciprocal; that is aqp = apq -1, and all its diagonal elements, apq = 1, for p = q. Given this re- ciprocal property, only n(n-1)/2 actual pairwise com- parisons are needed for an n×n matrix. Once the pairwise comparison matrix is obtained, the preferences are sum- marized so that each element of the hierarchical structure can be assigned a relative importance. This can be achieved by computing a set of weights, wj = [w1, w2, …, wn], where j = 1, 2…n. The computation of the weights involves two steps: 1) the entries in the matrix A are normalized (that is, each element of the matrix is divided by the sum total of its column), and 2) the average value of the normalized weights is computed by dividing the sum of entries in each row of the normalized matrix by the number of elements in that row. Last step of AHP is to obtain the overall priority score for each alternative. The overall priority score, Ri of the ith alternative is calculated in Equation (1). 1 n ijij j R wx = = (1) where wj is the aggregated composite weights of objec- tives and attribute weights. The weights are calculated by the multiplications of the matrices of relative weights at each level of hierarchy. xij is the standardized attribute value for i-th alternative. 2.2. OWA Although AHP is widely used, one of the major issues of AHP is its inability to address the uncertainty in the de- cision maker’s judgments [22]. To overcome the short- comings of the AHP, OWA is used to integrate AHP to determine the best alternative. OWA is a class of multic- riteria aggregation operators [15]. It provides an exten- sion and generalization for two fundamental classes of decision rules in GIS: the Boolean overlay operations  Y. L. MENG ET AL. Copyright © 2011 SciRes. JGIS 52 and WLC procedures. OWA involves a new concept: order weights (vj, j = 1, 2, …, n) which is different from attribute weights (wj, j = 1, 2, …, n). The attribute weight wj is assigned to j-th attribute map for all locations to indicate the relative importance of the attribute accord- ing to the decision maker’s preferences (see Subsection 2.1). The order weights are associated with the attribute values on the location by location basis. They are as- signed to the i-th location’s attribute value in decreasing order without considering from which attribute map the value comes. The critical element of the OWA procedure is the method for obtaining the order weights. There are sev- eral methods for obtaining the order weights [23]. This study uses a fuzzy linguistic quantifier approach [24]. The concept of fuzzy quantifiers allows us to convert natural language into formal mathematical formulations. They can be represented as fuzzy subsets over the unit interval with proportional fuzzy statements, such as: All of the criteria should be satisfied (“All” for short), most of the criteria should be satisfied (“Most”), many of the criteria should be satisfied (“Many”), half of the criteria should be satisfied (“Half”), some of the criteria should be satisfied (“Some”), few of the criteria should be satis- fied (“Few”), and at least one of the criteria should be satisfied (“At least one”). In this paper, the regular in- creasing monotone quantifiers, Q, is used [23]. If Q is a linguistic quantifier (e.g., “Most”), then it can be repre- sented as a fuzzy subset over the unit interval [0,1], where for each p in the unit interval, the membership grade Q(p) indicates the compatibility of p with the con- cept denoted by Q. To identify the quantifier, we employ one of the most often used methods for defining a pa- rameterized subset on the unit interval: α ppQ =)( , α > 0 [25]. The order weights can be derived from attribute weights using Equation (2) as follows [23,26]: 1 11 jj jk k kk vu u αα − == =− (2) where uk is the reordered j-th attribute weight, wj; a 0 ≤ vj ≤ 1 and 1 1. n j j v = = The parameter α is associated with a set of order weights. By changing the parameter α, one can generate different types of linguistic quantifiers and associated order weights between two extreme cases of the “At least one” and “All” quantifiers. With different sets of order weights, one can generate a wide range of OWA opera- tors, including the most often used GIS-base map com- bination procedures: WLC, Boolean overlay combination “OR” and “AND”. The “AND” and “OR” operators rep- resent the extreme cases of OWA and they correspond to the MIN (intersection) and MAX (union) operators, re- spectively (see Table 1). The order weights are associ- ated with the measures of ORness and trade-off [27]. These measures take values in the interval from 0.0 to 1.0. ORness indicates the degree to which an OWA op- erator is similar to the logical “OR” in terms of its com- binatorial behaviour. The trade-off measure can be inter- preted as the degree of the order weights dispersion. Specifically, the degree to which the order weights are evenly distributed across all attributes controls the level of overall trade-off between attributes (criteria). The greater is the equality among the weights, the greater is the degree of the trade-off (see Table 1). Given the attribute weights, wj, attribute values xij, and the parameter α, the linguistic quantifier-guided OWA can be defined using Equation (3) as follows [23,26]: 1 11 1 jj n ikkij jk k OWAuu z αα − == = =− (3) where i = 1, 2, …, m, zi1 ≥ zi2 ≥ …≥ zin is obtained by reordering the attribute values xi1, xi2, …, xin. Table 2 illustrates the OWA procedure for a given set of the attribute, xij = (0.3, 0.1, 0.5, 0.7) and the attribute weights, wj = (0.05, 0.1, 0.35, 0.5). 2.3. AHP-OWA Procedures The two approaches, AHP and linguistic quantifier- Table 1. Selected linguistic quantifiers and corresponding α parameters. α Quantifier (Q) OWA weights (vj) Combination proce- dure Trade-off OR-ness Decision strategies α→0 At least one v1 = 1; vj = 0 for othersLogic “OR” (MAX) 0 1 Extremely optimistic α = 0.1 Few * * * * Very optimistic α = 0.5 Some * * * * Optimistic α = 1 Half vj = 1/n for all j WLC 1 0.5 Neutral α = 2 Many * * * * Pessimistic α = 10 Most * * * * Very pessimistic α→∞ All vn = 1; vj = 0 for othersLogic “AND” (MIN)0 0 Extremely pessimistic Note: “*” is Case dependent (see Equation (2) and Table 2 for details) 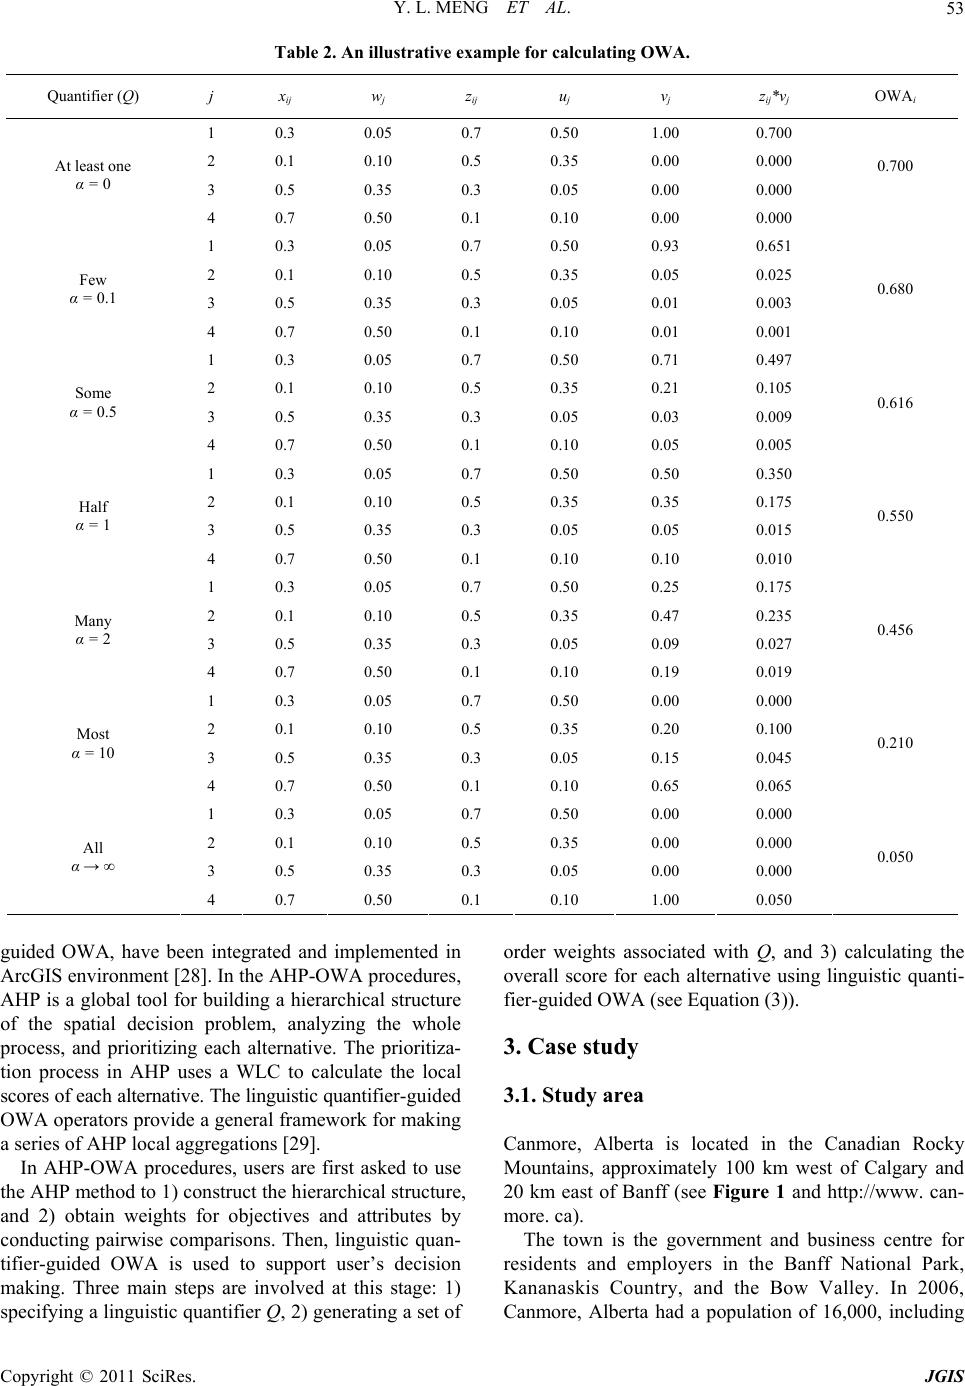 Y. L. MENG ET AL. Copyright © 2011 SciRes. JGIS 53 Table 2. An illustrative example for calculating OWA. Quantifier (Q) j xij w j z ij u j vj z ij*vj OWAi 1 0.3 0.05 0.7 0.50 1.00 0.700 2 0.1 0.10 0.5 0.35 0.00 0.000 3 0.5 0.35 0.3 0.05 0.00 0.000 At least one α = 0 4 0.7 0.50 0.1 0.10 0.00 0.000 0.700 1 0.3 0.05 0.7 0.50 0.93 0.651 2 0.1 0.10 0.5 0.35 0.05 0.025 3 0.5 0.35 0.3 0.05 0.01 0.003 Few α = 0.1 4 0.7 0.50 0.1 0.10 0.01 0.001 0.680 1 0.3 0.05 0.7 0.50 0.71 0.497 2 0.1 0.10 0.5 0.35 0.21 0.105 3 0.5 0.35 0.3 0.05 0.03 0.009 Some α = 0.5 4 0.7 0.50 0.1 0.10 0.05 0.005 0.616 1 0.3 0.05 0.7 0.50 0.50 0.350 2 0.1 0.10 0.5 0.35 0.35 0.175 3 0.5 0.35 0.3 0.05 0.05 0.015 Half α = 1 4 0.7 0.50 0.1 0.10 0.10 0.010 0.550 1 0.3 0.05 0.7 0.50 0.25 0.175 2 0.1 0.10 0.5 0.35 0.47 0.235 3 0.5 0.35 0.3 0.05 0.09 0.027 Many α = 2 4 0.7 0.50 0.1 0.10 0.19 0.019 0.456 1 0.3 0.05 0.7 0.50 0.00 0.000 2 0.1 0.10 0.5 0.35 0.20 0.100 3 0.5 0.35 0.3 0.05 0.15 0.045 Most α = 10 4 0.7 0.50 0.1 0.10 0.65 0.065 0.210 1 0.3 0.05 0.7 0.50 0.00 0.000 2 0.1 0.10 0.5 0.35 0.00 0.000 3 0.5 0.35 0.3 0.05 0.00 0.000 All α → ∞ 4 0.7 0.50 0.1 0.10 1.00 0.050 0.050 guided OWA, have been integrated and implemented in ArcGIS environment [28]. In the AHP-OWA procedures, AHP is a global tool for building a hierarchical structure of the spatial decision problem, analyzing the whole process, and prioritizing each alternative. The prioritiza- tion process in AHP uses a WLC to calculate the local scores of each alternative. The linguistic quantifier-guided OWA operators provide a general framework for making a series of AHP local aggregations [29]. In AHP-OWA procedures, users are first asked to use the AHP method to 1) construct the hierarchical structure, and 2) obtain weights for objectives and attributes by conducting pairwise comparisons. Then, linguistic quan- tifier-guided OWA is used to support user’s decision making. Three main steps are involved at this stage: 1) specifying a linguistic quantifier Q, 2) generating a set of order weights associated with Q, and 3) calculating the overall score for each alternative using linguistic quanti- fier-guided OWA (see Equation (3)). 3. Case study 3.1. Study area Canmore, Alberta is located in the Canadian Rocky Mountains, approximately 100 km west of Calgary and 20 km east of Banff (see Figure 1 and http://www. can- more. ca). The town is the government and business centre for residents and employers in the Banff National Park, Kananaskis Country, and the Bow Valley. In 2006, Canmore, Alberta had a population of 16,000, including  Y. L. MENG ET AL. Copyright © 2011 SciRes. JGIS 54 Figure 1. Study area. about 5,000 non-permanent residents. The permanent population growth decreased by 0.1%, while the non-permanent population increased by 37.2% (see Fi- ure 2). The town is undergoing rapid change and growth as a result of industrial tourism promotion and facility development. The change and growth contributed to a construction boom brought by the non-permanent resi- dents. As a result of growing population pressures, issues of land use planning have become increasingly impor- tant. 3.2. Data The data used in the Canmore case study consist of two Figure 2. Population growth in selected years in canmore, alberta. sets: 1) the data on the demand for various services, and 2) the data on the location of facilities supplying services. The Local Delivery Units (LDU), the smallest postal delivery zones, were used for identifying the spatial dis- tribution of population (demand). The centroids of LDU areas were used as the demand points. The Future De- velopment Areas (FDA) were identified by the Planning Department in Canmore (see Figure 1). FDAs contain 43 LDUs that are mainly distributed in the “Silver Trip”, “Three Sisters”, and “Three Sisters Parkway” areas of Canmore. The base map (Figure 1) shows the location of 30 existing facilities (see Table 3). The facilities can be classified into two categories: 1) salutary facilities (e.g., education, emergency and recrea- tion facilities), and 2) noxious facilities (e.g., flammable and noisy facilities). This distinction is made on the basis of the impact on the neighbouring communities brought by the proximity to those facilities. The proximity to the salutary facilities has a positive impact, while the prox- imity to noxious facilities is considered as a negative factor affecting the location of housing development. Consequently, the concept of accessibility is operation- alized in the context of the different types of facilities. The objective for salutary facilities is to maximize the accessibility. In other words, the housing development should be located as close as possible to such facilities. Meanwhile, the accessibility to noxious facilities should be minimized, so the housing development should be located far away from such facilities. 3.3. Hierarchical Structure of the Problem In order to evaluate the accessibility level of housing de- velopment sites, the following objectives are consid ered: 1) accessibility to education facilities, 2) accessibility to emergency facilities, 3) accessibility to leisure facilities, 4) accessibility to flammable facilities, and 5) accessibil Table 3. Facilities in canmore, alberta. Type of facilitiesName and number of facilities Total Number Education facilities Schools (5), Daycare center (1), Library (1) 7 Emergency facilities Fire stations (2), Hospital (1) 3 Recreation facilities Golf courses (3), Camp- grounds (3), Community and recreation centers (6) 12 Flammable facilities Gas tanks (4), Lumber yards (2) 6 Noisy facilities Pacific railway (1) , Heliport (1) 2 Total 30  Y. L. MENG ET AL. Copyright © 2011 SciRes. JGIS 55 ity to noisy facilities (see Figure 3). Each of the first four objectives is measured by two attributes: the aver- age and maximum distance. The distance was measured using the road network-based distance between the cen- troid of LDUs within FDAs and the location of facilities. The accessibility to noisy facilities was quantified by two attributes: the distance (Euclidean distance) to the pacific railway and heliport. The attribute map layers were de- veloped using ArcGIS [30]. Ten attribute map layers have been generated and all of them have been converted into 30m resolution raster data layers, which constitute the input dataset for mapping the accessibility patterns of housing development sites. 3.4. Attribute Map Layers The AHP-OWA procedures require that the attributes be represented in the form of standardized attribute map layers. The score range method, which linearly trans- forms the attribute values to standard values ranging from 0 to 1, has been used to transform the 10 attribute map layers into the standardized attribute map layers [13]. Figure 4 shows the standardized attribute map lay- ers. 3.5. Criterion weights Given the standardized attribute map layers, one of the key inputs for the AHP-OWA procedures is the set of criterion weights; that is, the weights assigned to the ob- jective and attribute maps. The weights have been de- rived using the pairwise comparison method (Saaty 1980; see Subsection 2.1). This approach required an expert in the Planning Department of the Town of Canmore to provide his/her best judgments regarding the relative importance of objectives and attributes. A questionnaire was used to assist the expert to make his/her judgments. The questionnaire contained the following information: the definition of objective and attribute weights in the context of MCDA, the scale for ratio judgment, and a set of questions regarding the ratios of importance for pairs of objectives or attributes. The scale in Table 4 was used. Given the 1-9 scale, a series of the following types of questions were asked: what is the ratio of importance of Table 4. Scale for pairwise comparisons [14]. Intensity of ImportanceDescription 1 Equal importance 3 Moderate importance of one factor over another 5 Strong or essential importance 7 Very strong or demonstrated impor- tance 9 Extreme importance 2, 4, 6, 8 Intermediate values Reciprocals Values for inverse comparison Figure 3. Hierarchical structure of accessibility of housing development sites to existing facilities in canmore, alberta.  Y. L. MENG ET AL. Copyright © 2011 SciRes. JGIS 56 Figure 4. Standardized attribute map layers. C1 to C2? The ratio questions were asked at each of the two levels of the hierarchy: the objective level (between pairs of the objectives) and the attribute level (between pairs of attributes associated with a given objective). Throughout the evaluation process, the expert was given the opportunity to re-examine the pairwise comparisons, re-calculate weights and check the consistency of his judgments. After debate and careful analysis of the set of evalua- tion criteria, the planner indicated the relative importance of 5 objectives and 10 attributes by the pairwise com- parisons at each level of the hierarchy. The accessibility to emergency facilities and leisure facilities are the two most important objectives, followed by accessibility to education facilities, flammable facilities and noisy facili- ties (see Table 5). The planner thought that the geographical efficiency (average distance) and equity (maximum distance) should be assigned equal weights of 0.5 in the process of mapping accessibility patterns of housing development sites. The planners also indicated that the distance to the railroad is 4 times more important than the distance to the heliport with respect to the accessibility to noisy fa- cilities. Consequently, the attribute weights of 0.8 and 0.2 were assigned to the railroad and heliport criteria, respectively.  Y. L. MENG ET AL. Copyright © 2011 SciRes. JGIS 57 Table 5. Pairwise comparison matrix and five objectives weights. Education facilities Emergency facilities Leisure facilities Flammable facilities Noisy facilities Weights Education facilities 1 1/3 1/2 7 8 0.171 Emergency facilities 3 1 1 6 7 0.378 Leisure facilities 2 1 1 5 7 0.347 Flammable facilities 1/7 6 1/5 1 2 0.059 Noisy facilities 1/8 7 1/7 0.5 1 0.045 Note: The consistency ratio, CR = 0.076 < 0.1 3.6. Linguistic Quantifier-Guided OWA Combination Different outcomes can be generated by varying the lin- guistic quantifiers in the AHP-OWA procedures (see Sec- tion 2.2). One can obtain a very large number of evalua- tion outcomes by varying the α parameter associated with the linguistic quantifiers. There are 7 linguistic quantifiers associated with the goal and five objectives; thus, theo- retically, 7(1+5) alternative evaluation scenarios can be generated for this case study. In this paper, we limit the analysis to a selection of five linguistic quantifiers: “Many” is assigned to accessibility to education facilities, “All” is assigned to accessibility to emergency facilities, “Many” is assigned to accessibility to leisure facilities, “Most” is assigned to accessibility to flammable facilities, and “Half” is assigned to accessibility to noisy facilities. Given the weights for objectives and attributes, and lin- guistic quantifiers for all objectives, we applied selected fuzzy linguistic quantifiers (“At least one”, “Few”, “Some”, “Half”, “Many”, “Most” and “All”) for the goal of the decision making to obtain a series of accessibility evaluation outcomes (see Figure 5). In other words, these alternative scenarios have been developed under the assumption that only the linguistic quantifier associated with the goal of the decision making Figure 5. Accessibility patterns of housing development sites: The results of AHP-OWA procedures for selected linguistic quantifiers.  Y. L. MENG ET AL. Copyright © 2011 SciRes. JGIS 58 problem changes. The linguistic quantifiers correspond to the following decision strategies: extremely optimistic, very optimistic, less optimistic, neutral, less pessimistic, very pessimistic, and extremely pessimistic (see Table 1). As mentioned, the overall site suitability for housing development is determined based on the accessibility levels in this study. Consequently, the OWA values were reclassified into four suitability based on “Equal Inter- vals” (Table 6). The reclassified outcomes are displayed in Figure 6. 3.7. Results Comparison of corresponding maps in Figures 5, 6 indi- cates that the increasing value of α corresponds to the decreasing degree of optimism. This implies that gradu- ally lower and lower order weights are assigned to the higher attribute values, while higher and higher order weights are assigned to the lower attribute values at a given location. As a result, the size of the areas suitable for housing development gradually becomes smaller and Table 6. Land suitability classification based on OWA values. Class Description OWA values S1 (highly suitable) Land has no significant limitations to the given type of use. 0.75 – 1 S2 (moderately suitable) Land has limitations which in aggregate are moderately severe for a given type of use. 0.5 – 0.75 S3 (marginally suitable) Land has limitations which in aggregate are severe for a given type of use. 0.25 – 0.5 N (Not suitable) Land is not suitable and has limitations that may be surmountable in time. 0 – 0.25 Figure 6. Site suitability for housing development: The reclassified results of AHP-OWA procedures for selected linguistic quantifiers.  Y. L. MENG ET AL. Copyright © 2011 SciRes. JGIS 59 smaller (see Figures 6 and 7). The linguistic term “At least one” (α→0) represents an extremely optimistic strategy. Under this strategy, the decision maker is willing to take the highest risk while identifying the best sites for housing development. This scenario selects the highest possible value at each loca- tion. In other words, the decision making can be based on optimistic attitudes represented by the best possible outcomes. Under this scenario, the results of AHP-OWA procedures show that most of FDAs are at least moder- ately suitable for housing development in terms of the accessibility level. With α close to 0, 65% of the FDAs are dominated by sites highly suitable for housing de- velopment and 35% of the FDAs are moderately suitable for housing development (see Figure 7). There are no unsuitable sites at all. The linguistic terms “Few” (α = 0.1) and “Some” (α = 0.5) correspond to a very optimistic strategy and opti- mistic strategy, respectively. For α = 0.1, the results of AHP-OWA procedures show that the “highly suitable” class covers 55% of the FDAs and the “moderately suit- able” area has increased to 45% of the total. There are no sites, which belongs to the other three classes. When α increases to 0.5, the highly suitable is down to 11%, but the class “moderately suitable” has greatly increased to 74%. Noticeably, 6% and 9% of the FDAs are under the classes “marginally suitable” and “unsuitable”, respec- tively. The two classes concentrate on the “Three Sister Parkway” area. In other words, it is the only place char- acterized by a low accessibility level when applying the linguistic term “Some”. The use of linguistic term “Half” (α = 1) means that equal order weights are assigned to all criteria. This leads to a neutral strategy. For this strategy, the highly suitable FDAs account for 8% of the total and they are located in the northwest part of the “Three Sisters” area (see Figure 6). The class “moderately suitable” has increased to 76% of the FDAs. Land parcels classified as “moderately suitable” are clustered in the “Silver Trips” area and the rest of the “Three Sisters” area. The class “unsuitable”, mainly located in the “Three Sister Parkways” area ac- counts for 16% of the total. The linguistic term “Many” (α = 2) and “Almost” (α = 10) represent a pessimistic strategy and a very pessimis- tic strategy, respectively. For α = 2, the “highly suitable” and “moderately suitable” classes have been squeezed down to 5% and 47%, respectively. These two classes are characterized by a high accessibility level. They are located in the “Three Sisters” area when applying the linguistic term of “Many”. The class “marginally suit- able” is also located in the “Silver Trips” area. It is char- acterized by a large increase (33% of the FDAs) in com- parison with α = 1. The “unsuitable” class accounts for almost the same proportion (15%) of the total and it is still dominant in the “Three Sister Parkways” area. For α = 10, the “highly suitable” and “moderately suitable” areas are down to 0% and 13%, respectively. The classes “unsuitable” and “marginally suitable” are characterized by a large increase to 26% and 61% of the FDAs. They are mostly located in the “Three Sister Parkway” and “Silver Trips” areas, respectively. When linguistic term “All” (α→∞) is applied, an ex- tremely pessimistic strategy is adopted (see Subsection 2.2). It represents the worst-case scenario. Under this sce- nario, the suitability pattern for housing development is composed of the worst possible outcomes. As expected the results of AHP-OWA procedures show that a very small area (6% of the FDAs), located in the south part of the “Three Sister” area, is characterized by a moderate suit- ability for housing development in terms of the accessibil- ity level. There are no highly suitable sites for housing development (see Figure 6). Noticeably, there is a large increase of the areas categorized as “unsuitable” (for α→∞) at the expense of declining the “marginally suitable” areas (for α = 10). For the extremely pessimistic strategy, the “unsuitable” class is the dominant one. It accounts for 59% of the total. The “unsuitable” and “marginally suit- able” classes together account for 94% of the FDAs. 4. Conclusions This study has presented the application of AHP-OWA Figure 7. Areas (%) of suitability classes derived from the seven resultant scenario maps.  Y. L. MENG ET AL. Copyright © 2011 SciRes. JGIS 60 procedures for mapping accessibility patterns of potential housing development sites in Canmore, Alberta. The method provides a mechanism to generate a wide range of decision strategies or evaluation scenarios by incor- porating the linguistic terms with the associated α pa- rameters. The AHP-OWA procedures incorporate uncer- tainty of expert and decision maker’ opinions regarding the evaluation criteria and their weights, and provide a mechanism for guiding them through the multi-criteria combination procedures. Several alternative scenarios of site suitability for housing development have been de- veloped in this study. They show how the decision maker’s attitude towards the uncertainty involved in land suitability decision-making process can influence the outcomes. It should be emphasized that the AHP-OWA procedure does not aim at determining a single “optimal” scenario. The procedure recommends sites under differ- ent decision strategies could be considered as the priority areas for housing development according to the level of attitudes towards risk (e.g., optimistic, pessimistic, and neutral). The other key capability of AHP-OWA proce- dure is that it is particularly useful for experts and deci- sion makers to interact with and analyze all possible al- ternative scenarios. Consequently, it facilitates a better understanding of the alternative suitability patterns and may lead to adopt a strategy for housing development that planning authorities would never consider using tra- ditional land suitability analysis methods. Finally, it should be noted that the selection of criteria was largely limited due to data availability. The study has been based on accessibility to a variety of facilities that affect the site suitability prioritization for housing development. Therefore, it is recognized that this re- search only provides preliminary results for further as- sessment of land suitability in the context of housing development. 5. Acknowledgements This research was supported by the GEOIDE Network (Project: HSS-DSS-17) of the Networks of Centers of Excellence. The authors would like to thank Gary Bux- ton, senior manager of the Planning and Engineering Department at the Town of Canmore, for his support in data preparation, criteria selection, and pairwise com- parison. 6. References [1] P. L. Knox, “Measure of Accessibility as Social Indica- tors: A Note,” Social Indicators Research, Vol. 7, No. 4, 1980, pp. 367-377. doi:10.1007/BF00305607 [2] G. Sénécal, “Urban Spaces and Quality of Life: Moving beyond Normative Approaches,” Policy Research Initia- tive, Vol. 5, No. 1, 2002, pp. 306-318. [3] K. E. Smoyer-Tomic, J. Hewko and M. J. Hodgson, “Spatial Accessibility and Equity of Playgrounds in Ed- monton,” The Canadian Geographer, Vol. 48, No. 3, 2004, pp. 287-302. doi:10.1111/j.0008-3658.2004.00061.x [4] S. Nicholls, “Measuring the Accessibility and Equity of Public Parks: A Case Study Using GIS,” Managing Lei- sure, Vol. 6, No. 4, 2001, pp. 201-219. doi:10.1080/13606710110084651 [5] M. Q. Dalvi, “Behavioural Modelling, Accessibility, Mobility and Need: Concepts and Measurement”, In: D. A. Hensher and P. R. Stopher, Eds., Behavioural Travel Modelling, Croom Helm, London, 1978, pp. 639-653. [6] D. M. McAllister, “Equity and Efficiency in Public Facil- ity Location,” Geographical Analysis, Vol. 8, 1976, pp. 47-63. doi:10.1111/j.1538-4632.1976.tb00528.x [7] R. Morrill and S. Symons, “Efficiency and Equity As- pects of Optimum Location,” Geographical Analysis, Vol. 9, 1977, PP. 215-225. [8] R. L. Hodgart, “Optimizing Access to Public Services,” Progress in Human Geography, Vol. 2, 1978, pp. 17-48. [9] Jong and J. R. Eck, “Location Profile Based Measures as an Improvement on Accessibility Modelling in GIS,” Computers, Environment and Urban Systems, Vol. 20, No. 3, 1996, pp. 181-190. doi:10.1016/S0198-9715(96)00013-0 [10] G. Shen, “Measuring Accessibility of Housing to Pub- lic-Community Facilities Using Geographical Informa- tion Systems,” Review of Urban and Regional Develop- ment Studies, Vol. 14, No. 3, 2002, pp. 235-255. doi:10.1111/1467-940X.00056 [11] X. Zhu, S. Liu and M. Yeow, “Accessibility Analysis for Housing Development in Singapore with GIS and Mul- ti-Criteria Analysis Methods,” Applied GIS, Vol. 2, No. 2, 2006, pp. 13.1-13.12. [12] P. Apparicio and A. Seguin, “Measuring the Accessibility of Services and Facilities for Residents of Public Housing in MontrÉAl,” Urban Studies, Vol. 43, No. 1, 2006, pp. 187-211. doi:10.1080/00420980500409334 [13] J. Malczewski, “GIS and Multicriteria Decision Analy- sis,” John Wiley and Sons, New York, 1999. [14] T. L. Saaty, “The Analytic Hierarchy Process,” McGraw- -Hill, New York, 1980. [15] R. R. Yager, “On Ordered Weighted Averaging Aggrega- tion Operators in Multicriteria Decision Making,” IEEE Transactions on Systems, Man and Cybernetics, Vol. 18, No. 1, 1988, pp. 183-190. doi:10.1109/21.87068 [16] S. Carver, “Integrating Multicriteria Evaluation with GIS,” International Journal of Geographical Information Science, Vol. 5, No. 3, 1991, pp. 321-339. doi:10.1080/02693799108927858 [17] J. M. C. Pereira and L. Duckstein, “A Multiple Criteria Decision Making Approach to GIS-Based Land Suitabil- ity Evaluation,” International Journal of Geographical  Y. L. MENG ET AL. Copyright © 2011 SciRes. JGIS 61 Information Systems, Vo. 7, No. 5, 1993, pp. 407-424. doi:10.1080/02693799308901971 [18] F. Joerin, M. C. Rey, A. Nembrini and G. Desthieux, “Informationet Participation pour L’Amenagement du Territoire,” Revue Internationale de Geomatique, Vol. 11, No. 3/4, 2001, pp. 309-332. [19] R. Banai, “Fuzziness in Geographical Information Sys- tems: Contribution from the Analytic Hierarchy Process,” International Journal of Geographical Information Sci- ence, Vol. 7, No. 4, 1993, pp. 315-329. doi:10.1080/02693799308901964 [20] E. H. Forman and S. I. Gass, “The Analytic Hierarchy Process: An Exposition,” Operations Research, Vol. 49, No. 4, 2001, pp. 469-486. doi:10.1287/opre.49.4.469.11231 [21] K. Habibi, S. Lotfi and M. J. Koohsari, “Spatial Analysis of Urban Fire Station Locations by Integrating AHP Model and IO Logic Using GIS,” Journal of Applied Sciences, Vol. 8, No. 19, 2008, pp. 3302-3315. doi:10.3923/jas.2008.3302.3315 [22] H. Deng, “Multi-Criteria Analysis with Fuzzy Pairwise Comparisons,” International Journal of Approximate Reasoning, Vol. 21, 1999, pp. 215-231. doi:10.1016/S0888-613X(99)00025-0 [23] R. R. Yager, “On the Inclusion of Importances in OWA Aggregation,” In: R. R.Yager and J. Kacprzyk, Eds., The Ordered Weighted Averaging Operators: Theory and ap- plications, Kluwer Academic Publishers, Boston, 1997, pp. 41-59. [24] L. A. Zadeh, “A Computational Approach to Fuzzy Quantifiers in Natural Languages,” Computers and Ma- thematics with Applications, Vol. 9, No. 1, 1983, pp. 149-184. doi:10.1016/0898-1221(83)90013-5 [25] R. R. Yager, “Quantifier Guided Aggregation Using OWA Operators,” International Journal of Intelligent Systems, Vo. 11, No. 1, 1996, pp. 49-73. doi:10.1002/(SICI)1098-111X(199601)11:1<49::AID-IN T3>3.3.CO;2-L [26] J. Malczewski, “Ordered Weighted Averaging with Fuzzy Quantifiers: GIS-Based Multicriteria Evaluation for Land-Use Suitability Analysis,” International Journal of Applied Earth Observation and Geoinformation, Vol. 8, No. 4, 2006, pp. 249-268. [27] H. Jiang and J. R. Eastman, “Application of Fuzzy Meas- ures in Multi-Criteria Evaluation in GIS,” International Journal of Geographical Information Systems, Vol. 14, No. 2, 2000, pp. 173-184. doi:10.1080/136588100240903 [28] S. Boroushaki and J. Malczewski, “Implementing an Extension of the Analytical Hierarchy Process Using Or- dered Weighted Averaging Operators with Fuzzy Quanti- fiers in Arcgis,” Computers and Geosciences, Vol. 34, No. 4, 2008, pp. 399-410. doi:10.1016/j.cageo.2007.04.003 [29] R. R. Yager and A. Kelman, “An Extension of the Ana- lytical Hierarchy Process Using OWA Operators,” Jour- nal of Intelligent and Fuzzy Systems, Vol. 7, No. 4, 1999, pp. 401-417. [30] ESRI, “Using Arcgis Spatial Analyst: Arcgis 9.1,” ESRI Press, 2004. |