 Open Journal of Pathology, 2013, 3, 156-165 Published Online October 2013 (http://www.scirp.org/journal/ojpathology) http://dx.doi.org/10.4236/ojpathology.2013.34029 Copyright © 2013 SciRes. OJPathology SATB1 Protein Is Associated with a More Aggressive Phenotype of Sporadic Colorectal Cancer Akueni L. Davelaar1,2*, Agnieszka M. Rygiel1,2*, Margriet R. Timmer1,2, Liudmila L. Kodach3, Carel J. M. van Noesel3, Paul Fockens2, Kausilia K. Krishnadath1,2 1Center for Experimental and Molecular Medicine, Academic Medical Center, Amsterdam, The Netherlands; 2Department of Gas- troenterology and Hepatology, Academic Medical Center, Amsterdam, The Netherlands; 3Department of Pathology, Academic Medi- cal Center, Amsterdam, The Netherlands. Email: a.l.davelaar@amc.uva.nl, k.k.krishnadath@amc.uva.nl Received June 8th, 2013; revised July 8th, 2013; accepted July 18th, 2013 Copyright © 2013 Akueni L. Davelaar et al. This is an open access article distributed under the Creative Commons Attribution Li- cense, which permits unrestricted use, distribution, and reproduction in any medium, provided the original work is properly cited. ABSTRACT Obje ctiv e: SATB1 is a genome organizer known for its role in T-cell development. With its cage-like, nuclear archi- tecture regulates a number of genes through epigenetic modifications. Ectopic expression of SATB1 has been shown to enhance aggressive behaviour of cancer. Here, we investigated whether this putative function can also be detected in sporadic colorectal cancer. Material and Methods: SATB1 protein expression in 107 cancer samples was screened using immunohistochemistry on tissue microarrays. These stainings were evaluated with respect to clinico-pathological parameters and patient outcome. In functional assays on cell lines, association of SATB1 with tumour cell behaviour was investigated. Results: Nuclear expression of SATB1 was seen in 17.8% of the cancers. A significantly poorer dis- ease-free survival was seen in patients positive for SATB1 expression (Log-rank test, p = 0.003). Cox regression analy- sis showed that SATB1 expression (p = 0.009, RR = 3.6, 95% CI = 1.4 to 9.4) was an independent predictor of disease relapse. Knockdown and ectopic expression of SATB1 in colorectal cancer cell lines lead to a corresponding decrease and increase in the migratory and invasive capacity of the respective cells. Conclusions: In colorectal cancer, nuclear expression of SATB1 correlates with a more aggressive disease. This reflects in the accompanying increased risk of disease relapse. Keywords: SATB1; Biomarker; Sporadic Colorectal Cancer 1. Introduction Colorectal cancer (CRC) is one of the leading causes of cancer related death in the world. Fifty percent of the CRC cases are advanced at the time of diagnosis [1]. Advanced CRC is often accompanied by metastasis to the peritoneum, lymph nodes or other organs and is fatal in most cases. There is currently a great search for pre- dictive and targetable biomarkers in CRC. The nuclear protein SATB1 might be involved in some of the mo- lecular mechanisms that contribute to more aggressive CRC phenotypes [2-4]. SATB1 functions as a genome organizer essential for T cell development. It constitutes a nuclear architecture with a “cage-like” protein distribution that binds to spe- cific regions of DNA, the base un-pairing regions (BURs) [5-7], which are associated with augmented gene expres- sion. This architecture regulates gene expression by re- cruiting chromatin remodeling/modifying enzymes and transcription factors to genomic DNA. The uniqueness of SATB1 compared to other transcription factors lies in the fact that it has a tissue specific regulation of multiple genetic loci through chromatin reorganization over long distances [5-7]. This molecule showed its potential for a putative role in molecular medicine in the 2008 paper by Han et al., where it was shown that SATB1 might be active in breast cancer development. This article postu- lates that SATB1 contributes to overall breast cancer aggressiveness and specifically breast cancer metastasis. And when ectopically expressed in non-metastatic breast cancer cells it can induce invasive activity in vivo [8]. Furthermore, the authors demonstrated that SATB1 in breast cancer cells establishes a gene expression profile *Authors contributed equally to the article. 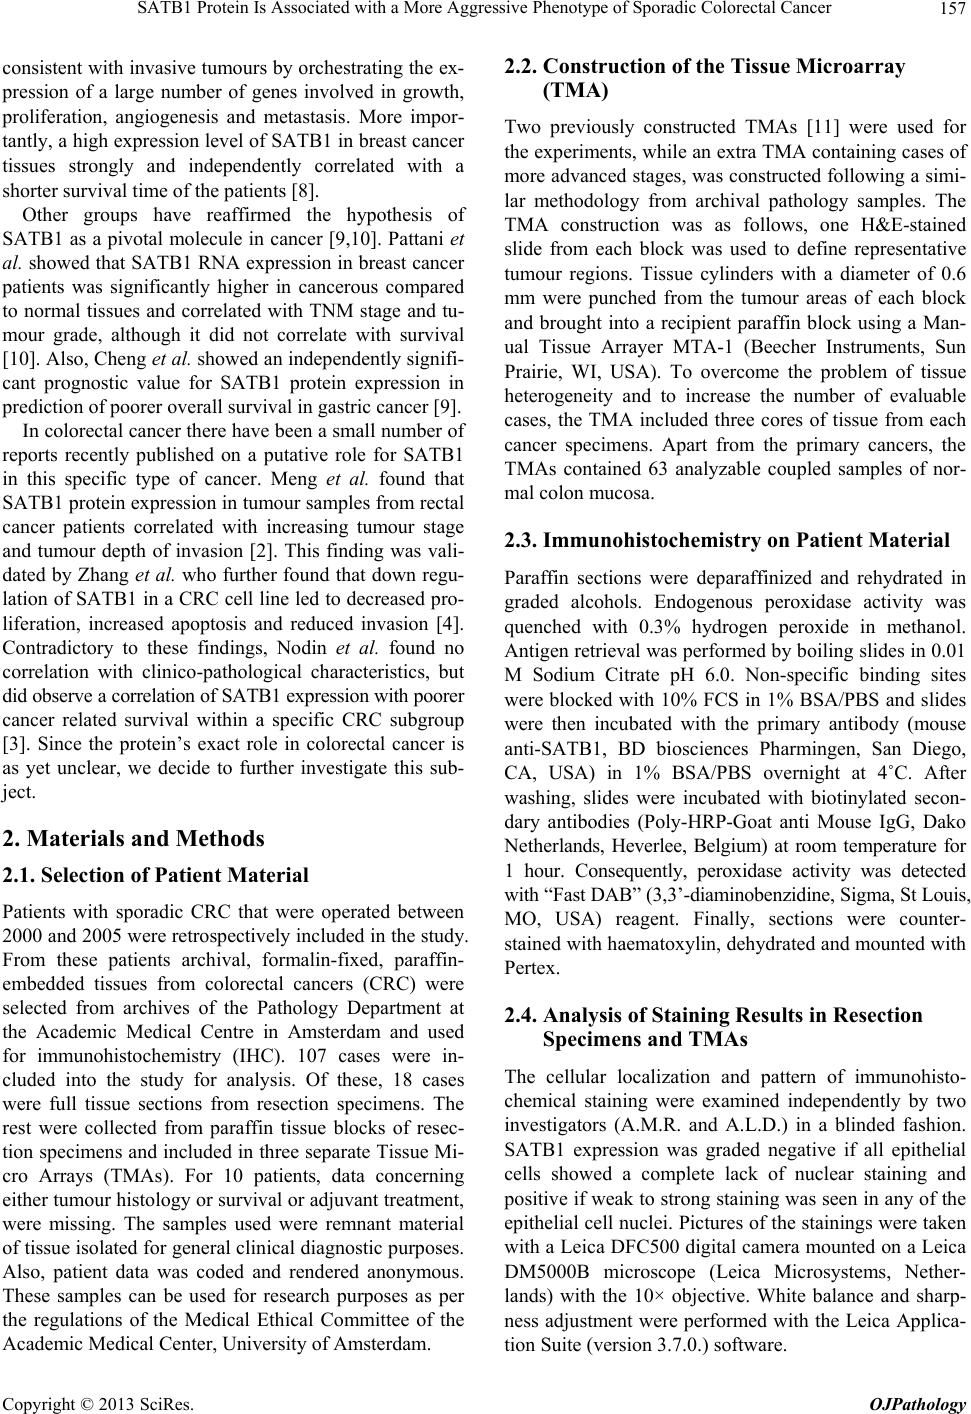 SATB1 Protein Is Associated with a More Aggressive Phenotype of Sporadic Colorectal Cancer 157 consistent with invasive tumours by orchestrating the ex- pression of a large number of genes involved in growth, proliferation, angiogenesis and metastasis. More impor- tantly, a high expression level of SATB1 in breast cancer tissues strongly and independently correlated with a shorter survival time of the patients [8]. Other groups have reaffirmed the hypothesis of SATB1 as a pivotal molecule in cancer [9,10]. Pattani et al. showed that SATB1 RNA expression in breast cancer patients was significantly higher in cancerous compared to normal tissues and correlated with TNM stage and tu- mour grade, although it did not correlate with survival [10]. Also, Cheng et al. showed an independently signifi- cant prognostic value for SATB1 protein expression in prediction of poorer overall survival in gastric cancer [9]. In colorectal cancer there have been a small number of reports recently published on a putative role for SATB1 in this specific type of cancer. Meng et al. found that SATB1 protein expression in tumour samples from rectal cancer patients correlated with increasing tumour stage and tumour depth of invasion [2]. This finding was vali- dated by Zhang et al. who further found that down regu- lation of SATB1 in a CRC cell line led to decreased pro- liferation, increased apoptosis and reduced invasion [4]. Contradictory to these findings, Nodin et al. found no correlation with clinico-pathological characteristics, but did observe a correlation of SATB1 expression with poorer cancer related survival within a specific CRC subgroup [3]. Since the protein’s exact role in colorectal cancer is as yet unclear, we decide to further investigate this sub- ject. 2. Materials and Methods 2.1. Selection of Patient Material Patients with sporadic CRC that were operated between 2000 and 2005 were retrospectively included in the study. From these patients archival, formalin-fixed, paraffin- embedded tissues from colorectal cancers (CRC) were selected from archives of the Pathology Department at the Academic Medical Centre in Amsterdam and used for immunohistochemistry (IHC). 107 cases were in- cluded into the study for analysis. Of these, 18 cases were full tissue sections from resection specimens. The rest were collected from paraffin tissue blocks of resec- tion specimens and included in three separate Tissue Mi- cro Arrays (TMAs). For 10 patients, data concerning either tumour histology or survival or adjuvant treatment, were missing. The samples used were remnant material of tissue isolated for general clinical diagnostic purposes. Also, patient data was coded and rendered anonymous. These samples can be used for research purposes as per the regulations of the Medical Ethical Committee of the Academic Medical Center, University of Amsterdam. 2.2. Construction of the Tissue Microarray (TMA) Two previously constructed TMAs [11] were used for the experiments, while an extra TMA containing cases of more advanced stages, was constructed following a simi- lar methodology from archival pathology samples. The TMA construction was as follows, one H&E-stained slide from each block was used to define representative tumour regions. Tissue cylinders with a diameter of 0.6 mm were punched from the tumour areas of each block and brought into a recipient paraffin block using a Man- ual Tissue Arrayer MTA-1 (Beecher Instruments, Sun Prairie, WI, USA). To overcome the problem of tissue heterogeneity and to increase the number of evaluable cases, the TMA included three cores of tissue from each cancer specimens. Apart from the primary cancers, the TMAs contained 63 analyzable coupled samples of nor- mal colon mucosa. 2.3. Immunohistochemistry on Patient Material Paraffin sections were deparaffinized and rehydrated in graded alcohols. Endogenous peroxidase activity was quenched with 0.3% hydrogen peroxide in methanol. Antigen retrieval was performed by boiling slides in 0.01 M Sodium Citrate pH 6.0. Non-specific binding sites were blocked with 10% FCS in 1% BSA/PBS and slides were then incubated with the primary antibody (mouse anti-SATB1, BD biosciences Pharmingen, San Diego, CA, USA) in 1% BSA/PBS overnight at 4˚C. After washing, slides were incubated with biotinylated secon- dary antibodies (Poly-HRP-Goat anti Mouse IgG, Dako Netherlands, Heverlee, Belgium) at room temperature for 1 hour. Consequently, peroxidase activity was detected with “Fast DAB” (3,3’-diaminobenzidine, Sigma, St Louis, MO, USA) reagent. Finally, sections were counter- stained with haematoxylin, dehydrated and mounted with Pertex. 2.4. Analysis of Staining Results in Resection Specimens and TMAs The cellular localization and pattern of immunohisto- chemical staining were examined independently by two investigators (A.M.R. and A.L.D.) in a blinded fashion. SATB1 expression was graded negative if all epithelial cells showed a complete lack of nuclear staining and positive if weak to strong staining was seen in any of the epithelial cell nuclei. Pictures of the stainings were taken with a Leica DFC500 digital camera mounted on a Leica DM5000B microscope (Leica Microsystems, Nether- lands) with the 10× objective. White balance and sharp- ness adjustment were performed with the Leica Applica- tion Suite (version 3.7.0.) software. Copyright © 2013 SciRes. OJPathology 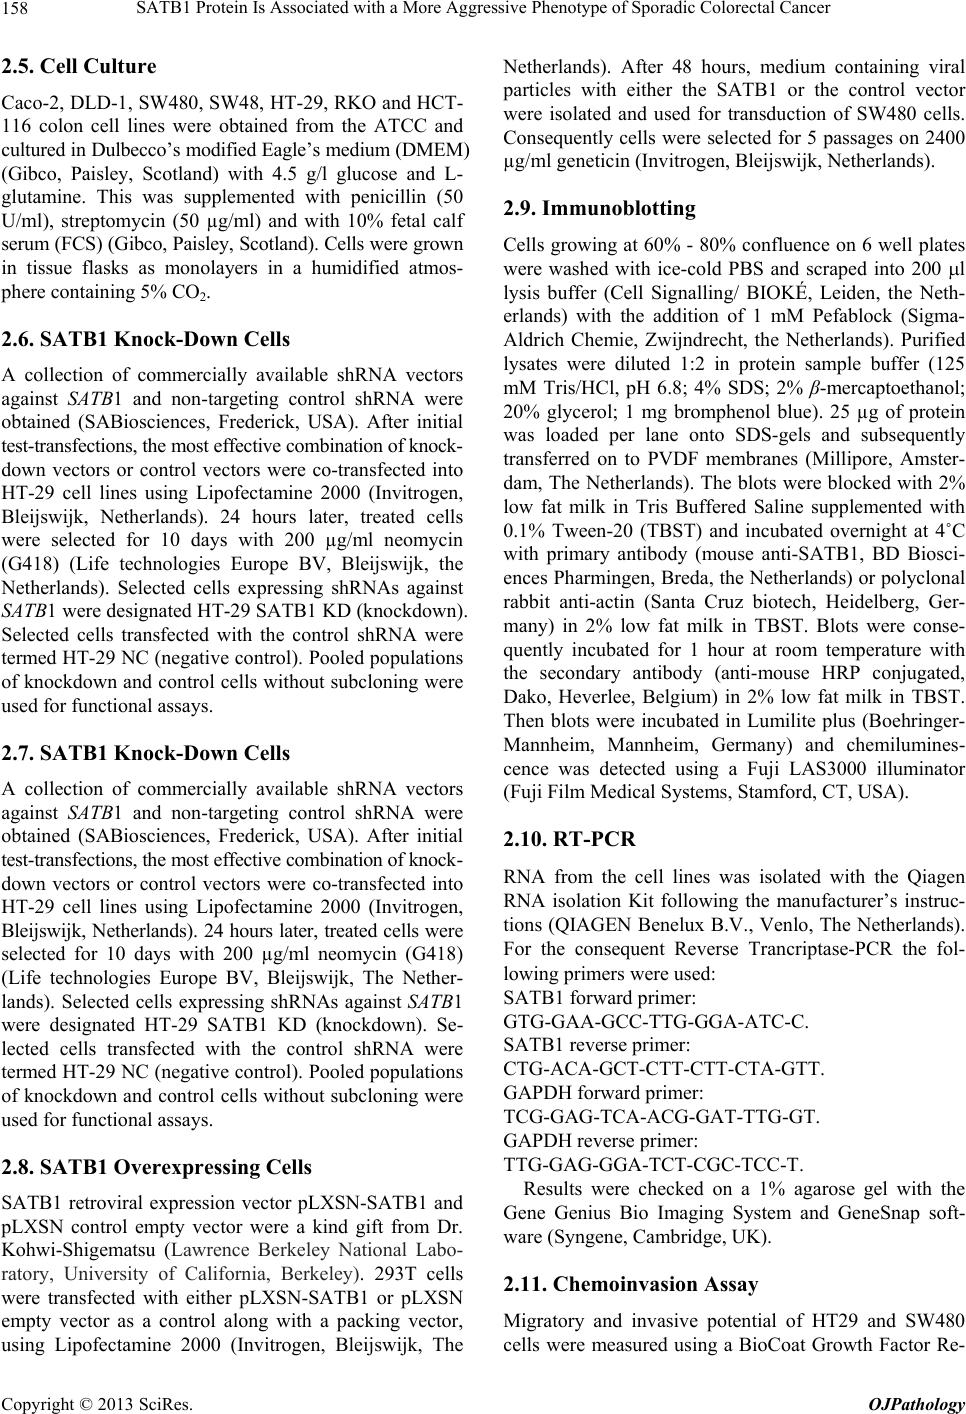 SATB1 Protein Is Associated with a More Aggressive Phenotype of Sporadic Colorectal Cancer 158 2.5. Cell Culture Caco-2, DLD-1, SW480, SW48, HT-29, RKO and HCT- 116 colon cell lines were obtained from the ATCC and cultured in Dulbecco’s modified Eagle’s medium (DMEM) (Gibco, Paisley, Scotland) with 4.5 g/l glucose and L- glutamine. This was supplemented with penicillin (50 U/ml), streptomycin (50 µg/ml) and with 10% fetal calf serum (FCS) (Gibco, Paisley, Scotland). Cells were grown in tissue flasks as monolayers in a humidified atmos- phere containing 5% CO2. 2.6. SATB1 Knock-Down Cells A collection of commercially available shRNA vectors against SATB1 and non-targeting control shRNA were obtained (SABiosciences, Frederick, USA). After initial test-transfections, the most effective combination of knock- down vectors or control vectors were co-transfected into HT-29 cell lines using Lipofectamine 2000 (Invitrogen, Bleijswijk, Netherlands). 24 hours later, treated cells were selected for 10 days with 200 µg/ml neomycin (G418) (Life technologies Europe BV, Bleijswijk, the Netherlands). Selected cells expressing shRNAs against SATB1 were designated HT-29 SATB1 KD (knockdown). Selected cells transfected with the control shRNA were termed HT-29 NC (negative control). Pooled populations of knockdown and control cells without subcloning were used for functional assays. 2.7. SATB1 Knock-Down Cells A collection of commercially available shRNA vectors against SATB1 and non-targeting control shRNA were obtained (SABiosciences, Frederick, USA). After initial test-transfections, the most effective combination of knock- down vectors or control vectors were co-transfected into HT-29 cell lines using Lipofectamine 2000 (Invitrogen, Bleijswijk, Netherlands). 24 hours later, treated cells were selected for 10 days with 200 µg/ml neomycin (G418) (Life technologies Europe BV, Bleijswijk, The Nether- lands). Selected cells expressing shRNAs against SATB1 were designated HT-29 SATB1 KD (knockdown). Se- lected cells transfected with the control shRNA were termed HT-29 NC (negative control). Pooled populations of knockdown and control cells without subcloning were used for functional assays. 2.8. SATB1 Overexpressing Cells SATB1 retroviral expression vector pLXSN-SATB1 and pLXSN control empty vector were a kind gift from Dr. Kohwi-Shigematsu (Lawrence Berkeley National Labo- ratory, University of California, Berkeley). 293T cells were transfected with either pLXSN-SATB1 or pLXSN empty vector as a control along with a packing vector, using Lipofectamine 2000 (Invitrogen, Bleijswijk, The Netherlands). After 48 hours, medium containing viral particles with either the SATB1 or the control vector were isolated and used for transduction of SW480 cells. Consequently cells were selected for 5 passages on 2400 µg/ml geneticin (Invitrogen, Bleijswijk, Netherlands). 2.9. Immunoblotting Cells growing at 60% - 80% confluence on 6 well plates were washed with ice-cold PBS and scraped into 200 l lysis buffer (Cell Signalling/ BIOKÉ, Leiden, the Neth- erlands) with the addition of 1 mM Pefablock (Sigma- Aldrich Chemie, Zwijndrecht, the Netherlands). Purified lysates were diluted 1:2 in protein sample buffer (125 mM Tris/HCl, pH 6.8; 4% SDS; 2% β-mercaptoethanol; 20% glycerol; 1 mg bromphenol blue). 25 µg of protein was loaded per lane onto SDS-gels and subsequently transferred on to PVDF membranes (Millipore, Amster- dam, The Netherlands). The blots were blocked with 2% low fat milk in Tris Buffered Saline supplemented with 0.1% Tween-20 (TBST) and incubated overnight at 4˚C with primary antibody (mouse anti-SATB1, BD Biosci- ences Pharmingen, Breda, the Netherlands) or polyclonal rabbit anti-actin (Santa Cruz biotech, Heidelberg, Ger- many) in 2% low fat milk in TBST. Blots were conse- quently incubated for 1 hour at room temperature with the secondary antibody (anti-mouse HRP conjugated, Dako, Heverlee, Belgium) in 2% low fat milk in TBST. Then blots were incubated in Lumilite plus (Boehringer- Mannheim, Mannheim, Germany) and chemilumines- cence was detected using a Fuji LAS3000 illuminator (Fuji Film Medical Systems, Stamford, CT, USA). 2.10. RT-PCR RNA from the cell lines was isolated with the Qiagen RNA isolation Kit following the manufacturer’s instruc- tions (QIAGEN Benelux B.V., Venlo, The Netherlands). For the consequent Reverse Trancriptase-PCR the fol- lowing primers were used: SATB1 forward primer: GTG-GAA-GCC-TTG-GGA-ATC-C. SATB1 reverse primer: CTG-ACA-GCT-CTT-CTT-CTA-GTT. GAPDH forward primer: TCG-GAG-TCA-ACG-GAT-TTG-GT. GAPDH reverse primer: TTG-GAG-GGA-TCT-CGC-TCC-T. Results were checked on a 1% agarose gel with the Gene Genius Bio Imaging System and GeneSnap soft- ware (Syngene, Cambridge, UK). 2.11. Chemoinvasion Assay Migratory and invasive potential of HT29 and SW480 cells were measured using a BioCoat Growth Factor Re- Copyright © 2013 SciRes. OJPathology 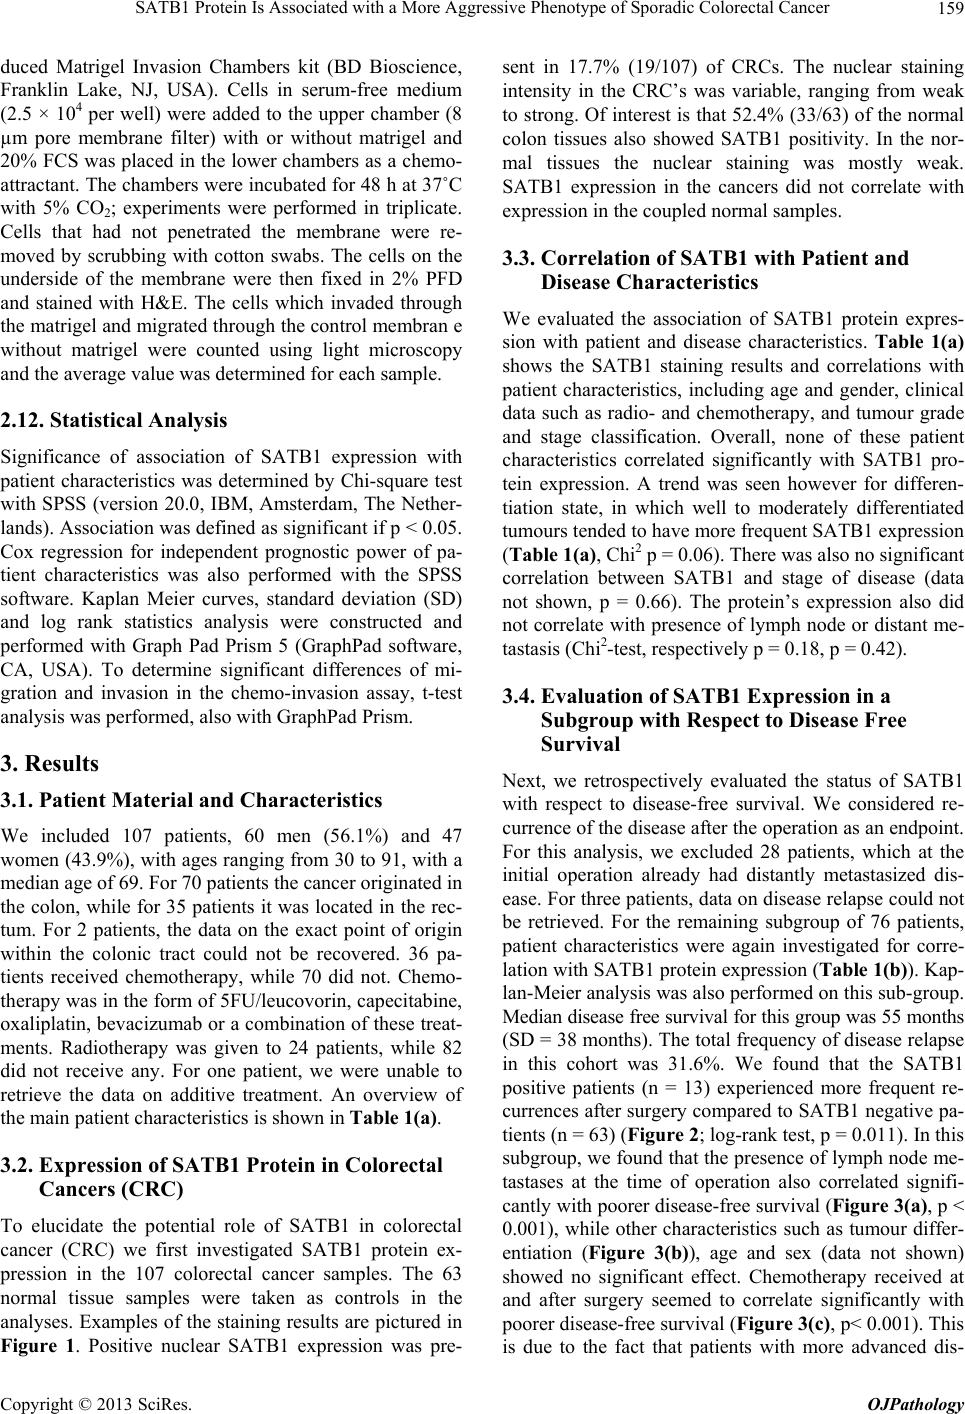 SATB1 Protein Is Associated with a More Aggressive Phenotype of Sporadic Colorectal Cancer 159 duced Matrigel Invasion Chambers kit (BD Bioscience, Franklin Lake, NJ, USA). Cells in serum-free medium (2.5 × 10⁴ per well) were added to the upper chamber (8 µm pore membrane filter) with or without matrigel and 20% FCS was placed in the lower chambers as a chemo- attractant. The chambers were incubated for 48 h at 37˚C with 5% CO2; experiments were performed in triplicate. Cells that had not penetrated the membrane were re- moved by scrubbing with cotton swabs. The cells on the underside of the membrane were then fixed in 2% PFD and stained with H&E. The cells which invaded through the matrigel and migrated through the control membran e without matrigel were counted using light microscopy and the average value was determined for each sample. 2.12. Statistical Analysis Significance of association of SATB1 expression with patient characteristics was determined by Chi-square test with SPSS (version 20.0, IBM, Amsterdam, The Nether- lands). Association was defined as significant if p < 0.05. Cox regression for independent prognostic power of pa- tient characteristics was also performed with the SPSS software. Kaplan Meier curves, standard deviation (SD) and log rank statistics analysis were constructed and performed with Graph Pad Prism 5 (GraphPad software, CA, USA). To determine significant differences of mi- gration and invasion in the chemo-invasion assay, t-test analysis was performed, also with GraphPad Prism. 3. Results 3.1. Patient Material and Characteristics We included 107 patients, 60 men (56.1%) and 47 women (43.9%), with ages ranging from 30 to 91, with a median age of 69. For 70 patients the cancer originated in the colon, while for 35 patients it was located in the rec- tum. For 2 patients, the data on the exact point of origin within the colonic tract could not be recovered. 36 pa- tients received chemotherapy, while 70 did not. Chemo- therapy was in the form of 5FU/leucovorin, capecitabine, oxaliplatin, bevacizumab or a combination of these treat- ments. Radiotherapy was given to 24 patients, while 82 did not receive any. For one patient, we were unable to retrieve the data on additive treatment. An overview of the main patient characteristics is shown in Table 1(a). 3.2. Expression of SATB1 Protein in Colorectal Cancers (CRC) To elucidate the potential role of SATB1 in colorectal cancer (CRC) we first investigated SATB1 protein ex- pression in the 107 colorectal cancer samples. The 63 normal tissue samples were taken as controls in the analyses. Examples of the staining results are pictured in Figure 1. Positive nuclear SATB1 expression was pre- sent in 17.7% (19/107) of CRCs. The nuclear staining intensity in the CRC’s was variable, ranging from weak to strong. Of interest is that 52.4% (33/63) of the normal colon tissues also showed SATB1 positivity. In the nor- mal tissues the nuclear staining was mostly weak. SATB1 expression in the cancers did not correlate with expression in the coupled normal samples. 3.3. Correlation of SATB1 with Patient and Disease Characteristics We evaluated the association of SATB1 protein expres- sion with patient and disease characteristics. Table 1(a) shows the SATB1 staining results and correlations with patient characteristics, including age and gender, clinical data such as radio- and chemotherapy, and tumour grade and stage classification. Overall, none of these patient characteristics correlated significantly with SATB1 pro- tein expression. A trend was seen however for differen- tiation state, in which well to moderately differentiated tumours tended to have more frequent SATB1 expression (Table 1(a), Chi2 p = 0.06). There was also no significant correlation between SATB1 and stage of disease (data not shown, p = 0.66). The protein’s expression also did not correlate with presence of lymph node or distant me- tastasis (Chi2-test, respectively p = 0.18, p = 0.42). 3.4. Evaluation of SATB1 Expression in a Subgroup with Respect to Disease Free Survival Next, we retrospectively evaluated the status of SATB1 with respect to disease-free survival. We considered re- currence of the disease after the operation as an endpoint. For this analysis, we excluded 28 patients, which at the initial operation already had distantly metastasized dis- ease. For three patients, data on disease relapse could not be retrieved. For the remaining subgroup of 76 patients, patient characteristics were again investigated for corre- lation with SATB1 protein expression (Table 1(b)). Kap- lan-Meier analysis was also performed on this sub-group. Median disease free survival for this group was 55 months (SD = 38 months). The total frequency of disease relapse in this cohort was 31.6%. We found that the SATB1 positive patients (n = 13) experienced more frequent re- currences after surgery compared to SATB1 negative pa- tients (n = 63) (Figure 2; log-rank test, p = 0.011). In this subgroup, we found that the presence of lymph node me- tastases at the time of operation also correlated signifi- cantly with poorer disease-free survival (Figure 3(a), p < 0.001), while other characteristics such as tumour differ- entiation (Figure 3(b)), age and sex (data not shown) showed no significant effect. Chemotherapy received at and after surgery seemed to correlate significantly with poorer disease-free survival (Figure 3(c), p< 0.001). This is due to the fact that patients with more advanced dis- Copyright © 2013 SciRes. OJPathology 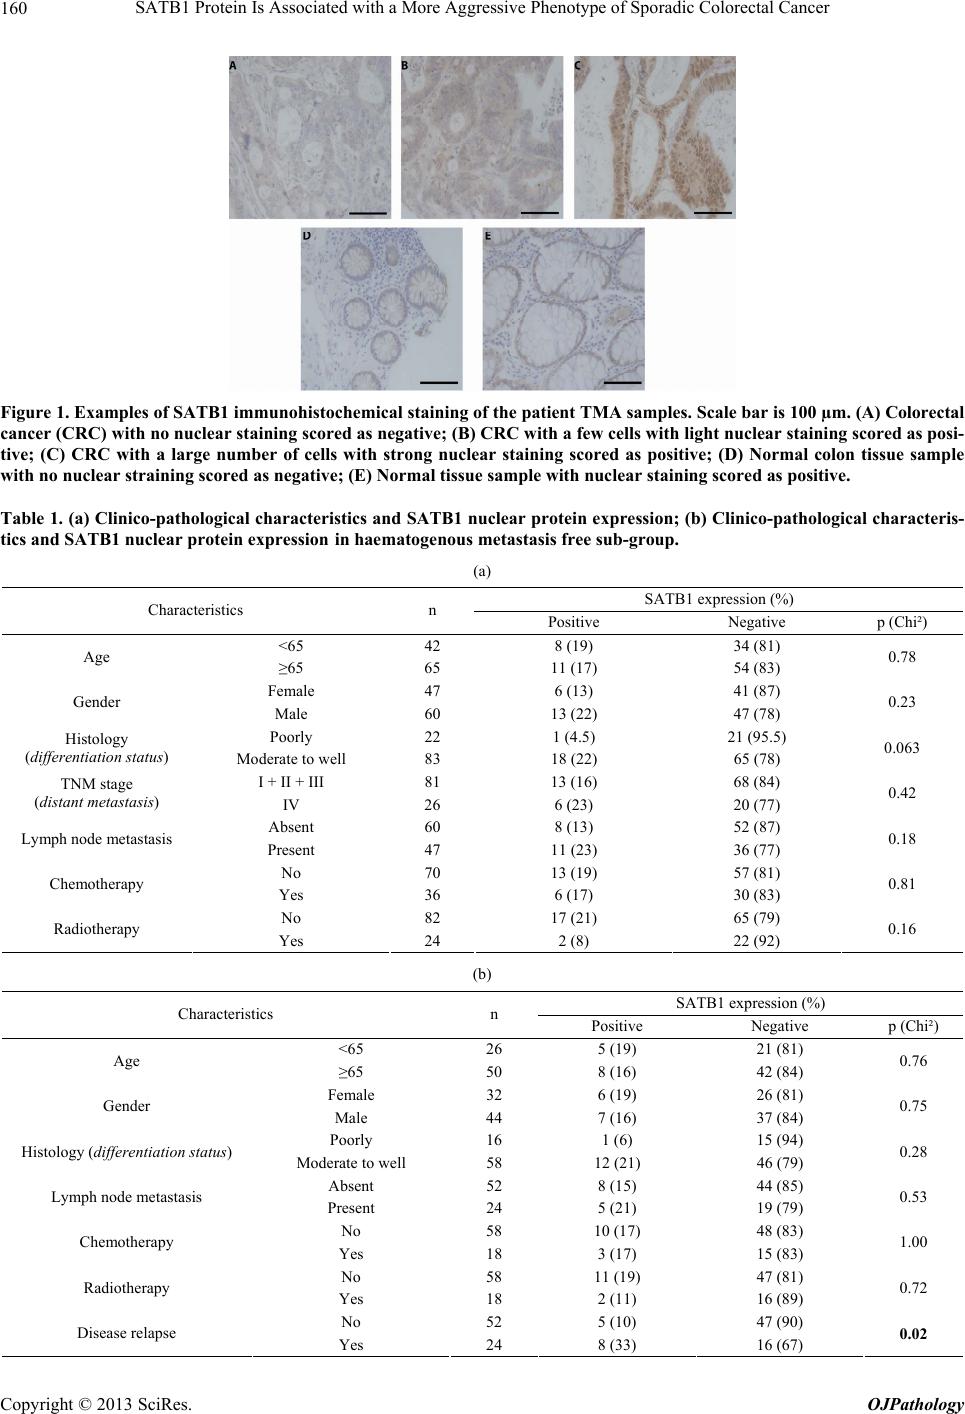 SATB1 Protein Is Associated with a More Aggressive Phenotype of Sporadic Colorectal Cancer Copyright © 2013 SciRes. OJPathology 160 Figure 1. Examples of SATB1 immunohistochemical staining of the patient TMA samples. Scale bar is 100 µm. (A) Colorectal cancer (CRC) with no nuclear staining scored as negative; (B) CRC with a few cells with light nuclear staining scored as posi- tive; (C) CRC with a large number of cells with strong nuclear staining scored as positive; (D) Normal colon tissue sample with no nuclear straining scored as negative; (E) Normal tissue sample with nuclear staining scored as positive. Table 1. (a) Clinico-pathological characteristics and SATB1 nuclear protein expre ssion; (b) Clinico-pathological characteris- tics and SATB1 nuclear protein expre ssion in haematogenous metastasis free sub-group. (a) SATB1 expression (%) Characteristics n Positive Negative p (Chi²) <65 42 8 (19) 34 (81) Age ≥65 65 11 (17) 54 (83) 0.78 Female 47 6 (13) 41 (87) Gender Male 60 13 (22) 47 (78) 0.23 Poorly 22 1 (4.5) 21 (95.5) Histology (differentiation status) Moderate to well 83 18 (22) 65 (78) 0.063 I + II + III 81 13 (16) 68 (84) TNM stage (distant metastasis) IV 26 6 (23) 20 (77) 0.42 Absent 60 8 (13) 52 (87) Lymph node metastasis Present 47 11 (23) 36 (77) 0.18 No 70 13 (19) 57 (81) Chemotherapy Yes 36 6 (17) 30 (83) 0.81 No 82 17 (21) 65 (79) Radiotherapy Yes 24 2 (8) 22 (92) 0.16 (b) SATB1 expression (%) Characteristics n Positive Negative p (Chi²) <65 26 5 (19) 21 (81) Age ≥65 50 8 (16) 42 (84) 0.76 Female 32 6 (19) 26 (81) Gender Male 44 7 (16) 37 (84) 0.75 Poorly 16 1 (6) 15 (94) Histology (differentiation status) Moderate to well 58 12 (21) 46 (79) 0.28 Absent 52 8 (15) 44 (85) Lymph node metastasis Present 24 5 (21) 19 (79) 0.53 No 58 10 (17) 48 (83) Chemotherapy Yes 18 3 (17) 15 (83) 1.00 No 58 11 (19) 47 (81) Radiotherapy Yes 18 2 (11) 16 (89) 0.72 No 52 5 (10) 47 (90) Disease relapse Yes 24 8 (33) 16 (67) 0.02  SATB1 Protein Is Associated with a More Aggressive Phenotype of Sporadic Colorectal Cancer 161 Figure 2. Kaplan-Meier curve indicating disease free survival in operated colorectal cancer patients stratified for positive, n = 13, versus negative, n = 63, SATB1 protein expression. Pa- tients with SATB1 nuclear expression have a significantly poorer disease free survival (Log-rank test p-value of 0.011) . ease more often receive this palliative adjuvant treatment. Treatment with chemotherapy indeed significantly cor- related with more advanced stage of disease (data not shown). Radiotherapy as performed on these patients prior to and after surgery had no significant effect on sur- vival (Figu re 3( d )). Cox regression analysis was performed to see whether SATB1 status, pathological stage or any of the patient characteristics had an independent predictive value. This analysis showed that only SATB1 protein expression (Hazard ratio = 3.6 with 95% CI = 1.4 to 9.4, p = 0.009) and lymph node metastases (HR = 6.4, with 95% CI = 1.6 to 25.1, p = 0.008) were independent negative pre- dictors of disease-free survival (Table 2). Figure 3. Correlation of disease free survival with colorectal cancer patient characteristics. (A) Comparison of disease free survival of patients with or without lymph node metastasis. Number of patients with lymph node metastasis was 24 and without this metastasis was 52. Log-rank: p < 0.001; (B) Comparison of disease free survival of patients with moderate to well or poorly differentiated tumours. Number of patients with poorly differentiated cancers was 16 and with moderate or well-differentiated cancers was 58. Log-rank: p = 0.44; (C) Comparison of disease free survival of patients who did or did not receive chemotherapy at or after surgery of the primary cancer. Number of patients who received adjuvant chemotherapy was 18 and number of patients who did not receive this was 58. Log-rank: p < 0.001; (D) Comparison of disease free survival of patients who did or did not receive radiotherapy at or after surgery of the primary cancer. Number of patients who re- eived radiothera py w a s 18 and the amount that did not receive this was 58. Log-rank: p = 0.07. c Table 2. Cox regression analysis of the patient ch aracteristics and SA TB1 express ion . 95.0% CI for Exp(B) Variables in the equation B df Sig. Exp(B) Lower Upper Age (<65 vs ≥65 y) −0.73 1 0.11 0.48 0.20 1.18 Gender 0.14 1 0.76 1.15 0.48 2.76 SATB1 protein expression 1.28 1 0.009 3.58 1.37 9.37 Differentiation status (poorly vs moderately/well) −0.89 1 0.11 0.41 0.14 1.22 Lymph node metastasis 1.85 1 0.008 6.37 1.61 25.1 Chemotherapy 0.36 1 0.58 1.43 0.40 5.05 Cox regression shows that SATB1 and lymph node status are the only independently significant variables that correlate with disease-free survival. Copyright © 2013 SciRes. OJPathology  SATB1 Protein Is Associated with a More Aggressive Phenotype of Sporadic Colorectal Cancer 162 3.5. Expression of SATB1 Protein in Colorectal Cancer Cell Lines SATB1 protein expression was present in a subset of CRCs and significantly correlated with poorer disease- free survival. The next step was to see whether these clinical results also held any functional relevance on a molecular level. To achieve this we first investigated seven CRC cell lines (SW48, SW480, HT29, HCT116, DLD-1, Caco-2) for the expression of SATB1 at mRNA and protein level by Reverse Transcriptase-PCR (RT- PCR) and immunoblotting. We found that SATB1 is ex- pressed in 3 out of 7 CRC cell lines (HT29, RKO and Caco-2) at both mRNA and protein level (Figure 4). The (a) (b) (c) (d) Figure 4. SATB1 Western blot and RT-PCR results and quantifications of 7 colon cancer cell lines. (a) HT29, RKO and Caco-2 colon cancer cell lines show SATB1 expression as detected by RT-PCR. The nRT sample was Jurkat cell lysate without reverse transcriptase enzyme added as a ne- gative control for the RT-PCR reactions; (b) Quantification of the RT-PCR results; (c) HT29, RKO and Caco-2 cells ex- press SATB1 protein with bands of the expected size as de- tected by Western blot analysis. HET1A, a normal squa- mous oesophageal cell line, was taken as a ne gative control; (d) Quantification of the WB results. Jurkat leukemic T- lymphocytes were taken as positive controls for both mRNA and Western Blot. highest expression of SATB1 was observed in the HT29 cell line. Conversely, the SW480 cell line showed the clearest lack of SATB1 protein both on mRNA and pro- tein level. 3.6. Genetic Knockdown of SATB1 Leads to Significant Reduction of the Invasive Phenotype of HT29 Cells in Vitro As the HT29 cell line showed the highest expression of SATB1 protein, we selected these cells for additional functional studies. We first established the genetic knock- down of SATB1 in the HT29 cell lines using a shRNA approach. Several combinations of shRNA led to effec- tive knockdown of the SATB1 protein as shown in Fig- ure 5(A). To evaluate whether increased SATB1 expres- sion leads to increased metastasis, we performed a che- mo-invasion assay on HT29 SATB1 knockdown cells. As the combination of the specific shRNAs 2 and 4 led to the most effective knockdown of the SATB1 protein (Figure 5), HT29 cells transfected with this mix were used for the assay. Experiments were performed in trip- licate. The assay showed a significant reduction in inva- sion (T-test, p = 0.038) and migration (T-test, p = 0.047) of the HT29 SATB1 knockdown cells compared to HT29 control cells (Figure 5(B)). Figure 5. Chemoinvasion assay comparing invasive ability of SATB1 knockdown HT29 colorectal cancer cell line with control transfected HT29 cell line; (A) The combination of short hairpin RNAs 4 and 2 led to an effective knockdown of SATB1 in HT29 as visualized by protein immunoblot. HT29 cells transfected with control shRNA were labelled HT29-NC = HT29-Negative Control; (B) Knockdown of SATB1 in HT29 leads to a significant reduction of invasion (T-test, p = 0.038) and migration (T-test, p = 0.047) of HT29 cells. Error bars indicate SD. Copyright © 2013 SciRes. OJPathology  SATB1 Protein Is Associated with a More Aggressive Phenotype of Sporadic Colorectal Cancer 163 3.7. In Vitro Upregulation of SATB1 Leads to Increased Invasive and Migratory Capacity of SW480 Cells Contrary to the HT29 cell line, the SW480 colorectal cancer cell line lacked strong expression of SATB1 on both protein and transcript level (Figure 4). This cell line was used to check whether ectopic expression of SATB1 would lead to an increase in its invasive and migratory capacity. SW480 clones stably transduced with either the pLXSN-SATB1 plasmid (SW480-SATB1) or the control empty vector (SW480-EV) were established (Figure 6(A)). The motility of the two cell lines were then compared by chemo-invasion assay. This was repeated for three inde- pendent experiments with different sets of SW480- SATB1 and -EV clones. The assay showed a slight in- crease in both migratory and invasive capacity of the SATB1 expressing cells compared to the cells transduced with the empty vector (Figure 6(B)). Figure 6. Chemoinvasion assay comparing invasive ability of SW480 colorectal cancer cells with ectopic expression of SATB1 and control transduced SW480 cell lines. (A) SW480 cells transduced with the pLXSN-SATB1 plasmid (SW480- SATB1) show ectopic expression of SATB1 protein as seen by immunoblot. Leukemic T-lymphocyte cell line J16 is used as a positive control for SATB1 expression. SW480 cells transduced with the pLXSN empty vector (SW480-EV) show no expression of the SATB1 protein; (B) SW480 cells expressing SATB1 show slightly increased invasion and migration. However, this increase is not significant. Error bars indicate standard deviation. 4. Discussion Our results seem to point to a pathogenic effect of SATB1 in colorectal cancer. Namely, our retrospective disease outcome analysis indicates an increased rate of disease relapse for SATB1 positive patients in a metasta- sis-free subgroup of our cohort. In vitro we see a de- crease in invasive behavior of colorectal cancer cells upon down regulation of SATB1. This latter discovery is in line with a recently published paper by Zang et al. who had similar results in the LOVO CRC cell line [4]. This is also similar to results seen in breast cancer, where SATB1 was suggested to have a role in stimulating me- tastasis [8]. There are some important discrepancies when com- paring our results and several recently published reports on SATB1 expression in colorectal cancer. The SATB1 protein expression frequencies in CRC in these reports vary between 42% - 59%. In normal colonic mucosa these frequencies varied between 3% - 26% [2-4]. In our study, we observed a frequency of approximately 18% in cancerous tissues and a relatively high frequency of 52% in normal tissues. While the Zang et al. study lacked in- formation on adjuvant treatment and the patients from the Meng et al. study had not yet received adjuvant treatment, the Nodin et al. study had a similar percentage of adjuvant treatment as our cohort. Furthermore, apart from some small differences there are no clear variations between the cohorts with respect to other patient charac- teristics such as disease stage, age and sex that could explain the observed differences in protein expression frequencies seen in both tumor and normal samples, when comparing the cohorts. The variation might be re- lated to the genetic background or perhaps other not- described patient characteristics. Alternatively it can also be explained by the use of different antibodies and dif- ferences in the applied methodologies and interpretation of the results. Regarding this, we used the same antibody as the Zhang et al. study [4], while the Nodin et al. and Meng et al. studies shared a different antibody [2,3]. Also, the scoring system we applied is likely the least stringent of the four methods used, which would account for the relatively high expression frequency for SATB1 seen in the normal mucosa samples. However this would not explain the relatively lower frequency seen in our cancer samples compared to the other three studies. Our normal mucosa samples showed more light or moderate nuclear staining rather than strong nuclear staining for the SATB1 protein. Also, in our tumor samples, there were relatively more samples with stronger SATB1 stain- ing compared to the normal mucosa samples. Due to the overall low number of samples with strong staining, the earlier-described scoring system was opted for where light and moderate staining were also included in the SATB1 positive group, so as not to miss any potential Copyright © 2013 SciRes. OJPathology  SATB1 Protein Is Associated with a More Aggressive Phenotype of Sporadic Colorectal Cancer 164 effects of SATB1 protein expression. With respect to the correlation of SATB1 protein ex- pression with patient characteristics, again some differ- ences between the studies can be seen. The Meng et al. and Zhang et al. studies observed a correlation of SATB1 protein expression with advanced disease stage and in- creased tumor depth of invasion [2,4]. However, both the Nodin et al. and our study did not show any correlation indicative of a poorer disease outcome of SATB1 ex- pression with patient characteristics [3]. There were also correlations with certain patient characteristics observed by one group but not seen by the other researchers, such as gender [3] and tumor differentiation grade [4]. This is possibly again indicative of the differences in general genetic background not captured in the shown patient characteristics that could have led to the differences seen in the SATB1 expression frequencies. With respect to the overall cancer related survival, both Nodin et al. [3] and our enquiries [data not shown] could not find any signi- ficant prognostic power of SATB1 protein expression. However, upon cohort stratification for early disease stage we did find an increased risk for disease relapse in patients with SATB1 positive tumors. Similarly, upon stratification for absence of another epigenetic regulator, SATB2, Nodin et al. found a significant decrease in can- cer specific survival of SATB1 positive patients [3]. One effect shared among all the research is the great heterogeneity of the SATB1 staining. The Han et al. breast cancer study showed that even low SATB1 ex- pression seems to have an effect on disease outcome [8]. It is not clear yet whether differing levels of SATB1 ex- pression could have differing effects in CRC. Concerning our research, light SATB1 expression might be lost or down regulated in cancerous tissues as a result of the changing biological environment. This could have led to the lower frequency of SATB1 positivity as assessed by our scoring system in the cancer samples, with the re- maining SATB1 positivity still being indicative of a poorer disease outcome. However, considerably fewer patients were considered as having light/moderate SATB1 ex- pression in cancerous tissues compared to normal tissues, a certain amount of tissue specific scoring bias can thus not be completely disregarded with respect to our tumor to normal frequency ratio. The exact cut-offs used in as- sessing SATB1 expression will thus also be important in determining potential biological effects of the protein. These reports along with our study suggest that the ef- fect and strength of SATB1 expression is likely very tis- sue- and cell-type dependent. Considering the currently available in vitro, descriptive and prognostic evidence on colorectal cancer it seems that SATB1 might play a role in poorer disease outcome in this type of cancer. How- ever, the true predictive power of SATB1 is only visible upon specific stratification of SATB1 positivity and thus its function is likely dependent on co-factors. The ge- nome-reorganizer SATB2 is a potential candidate for such a co-factor as shown by Nodin et al. [3]. In our case exclusion of stage IV disease led to a significant prog- nostic power of SATB1 with respect to increased disease relapse, indicating that likely both temporal and spatial factors might be important for the effects of SATB1 ex- pression and activity. 5. Conclusion In conclusion, our experiments show that there is evi- dence for a detrimental role of expression of SATB1 in CRC, as it is expressed in a subset of CRCs and corre- lates with poorer disease free survival. However, to evaluate its value as a tool for clinical decision making, larger prospective follow up studies are necessary. Also, in light of the protein’s presence in normal colonic tis- sues and potential tissue type specific function, more experiments should be done to validate and possibly ex- pand on this effect. REFERENCES [1] D. McCormick, P. J. Kibbe and S. W. Morgan, “Colon Cancer: Prevention, Diagnosis, Treatment,” Gastroen- terology Nursing, Vol. 25, No. 5, 2002, pp. 204-211. http://dx.doi.org/10.1097/00001610-200209000-00006 [2] W. J. Meng, H. Yan, B. Zhou, W. Zhang, X. H. Kong, R. Wang, et al., “Correlation of SATB1 Overexpression with the Progression of Human Rectal Cancer,” International Journal of Colorectal Disease, Vol. 27, No. 2, 2012, pp. 143-150. http://dx.doi.org/10.1007/s00384-011-1302-9 [3] B. Nodin, H. Johannesson, S. Wangefjord, D. P. O’Con- nor, K. E. Lindquist, M. Uhlén, et al., “Molecular Corre- lates and Prognostic Significance of SATB1 Expression in Colorectal Cancer,” Diagnostic Pathology, Vol. 7, No. 115, 2012, p. 115. [4] J. Zhang, B. Zhang, X. Zhang, Y. Sun, X. Wei, M. A. McNutt, et al., “SATB1 Expression Is Associated with Biologic Behavior in Colorectal Carcinoma in Vitro and in Vivo,” PLoS One, Vol. 8, No. 1, 2013, in press. http://dx.doi.org/10.1371/journal.pone.0047902 [5] J. D. Alvarez, D. H. Yasui, H. Niida, T. Joh, D. Y. Loh and T. Kohwi-Shigematsu, “The MAR-Binding Protein SATB1 Orchestrates Temporal and Spatial Expression of Multiple Genes during T-Cell Development,” Genes & Development, Vol. 14, No. 5, 2000, pp. 521-535. [6] S. Cai, H. J. Han and T. Kohwi-Shigematsu, “Tissue- Specific Nuclear Architecture and Gene Expression Re- gulated by SATB1,” Nature Genetics, Vol. 34, 2003, pp. 42-51. http://dx.doi.org/10.1038/ng1146 [7] D. Yasui, M. Miyano, S. Cai, P. Varga-Weisz and T. Kohwi-Shigematsu, “SATB1 Targets Chromatin Remod- elling to Regulate Genes over Long Distances,” Nature, Vol. 419, 2002, pp. 641-645. http://dx.doi.org/10.1038/nature01084 Copyright © 2013 SciRes. OJPathology  SATB1 Protein Is Associated with a More Aggressive Phenotype of Sporadic Colorectal Cancer Copyright © 2013 SciRes. OJPathology 165 [8] H. J. Han, J. Russo, Y. Kohwi and T. Kohwi-Shigematsu, “SATB1 Reprogrammes Gene Expression to Promote Breast Tumour Growth and Metastasis,” Nature, Vol. 452, 2008, pp. 187-193. http://dx.doi.org/10.1038/nature06781 [9] C. Cheng, X. Lu, G. Wang, L. Zheng, X. Shu, S. Zhu, et al., “Expression of SATB1 and Heparanase in Gastric Cancer and Its Relationship to Clinicopathologic Fea- tures,” APMIS, Vol. 118, No. 11, 2010, pp. 855-863. http://dx.doi.org/10.1111/j.1600-0463.2010.02673.x [10] N. Patani, W. Jiang, R. Mansel, R. Newbold and K. Mok- bel, “The mRNA Expression of SATB1 and SATB2 in Human Breast Cancer,” Cancer Cell International, Vol. 9, 2009, p. 18. [11] L. L. Kodach, S. A. Bleuming, A. R. Musler, M. P. Peppelenbosch, D. W. Hommes, G. R. Van den Brink, et al., “The Bone Morphogenetic Protein Pathway Is Active in Human Colon Adenomas and Inactivated in Colorectal Cancer,” Cancer, Vol. 112, No. 2, 2008, pp. 300-306. http://dx.doi.org/10.1002/cncr.23160
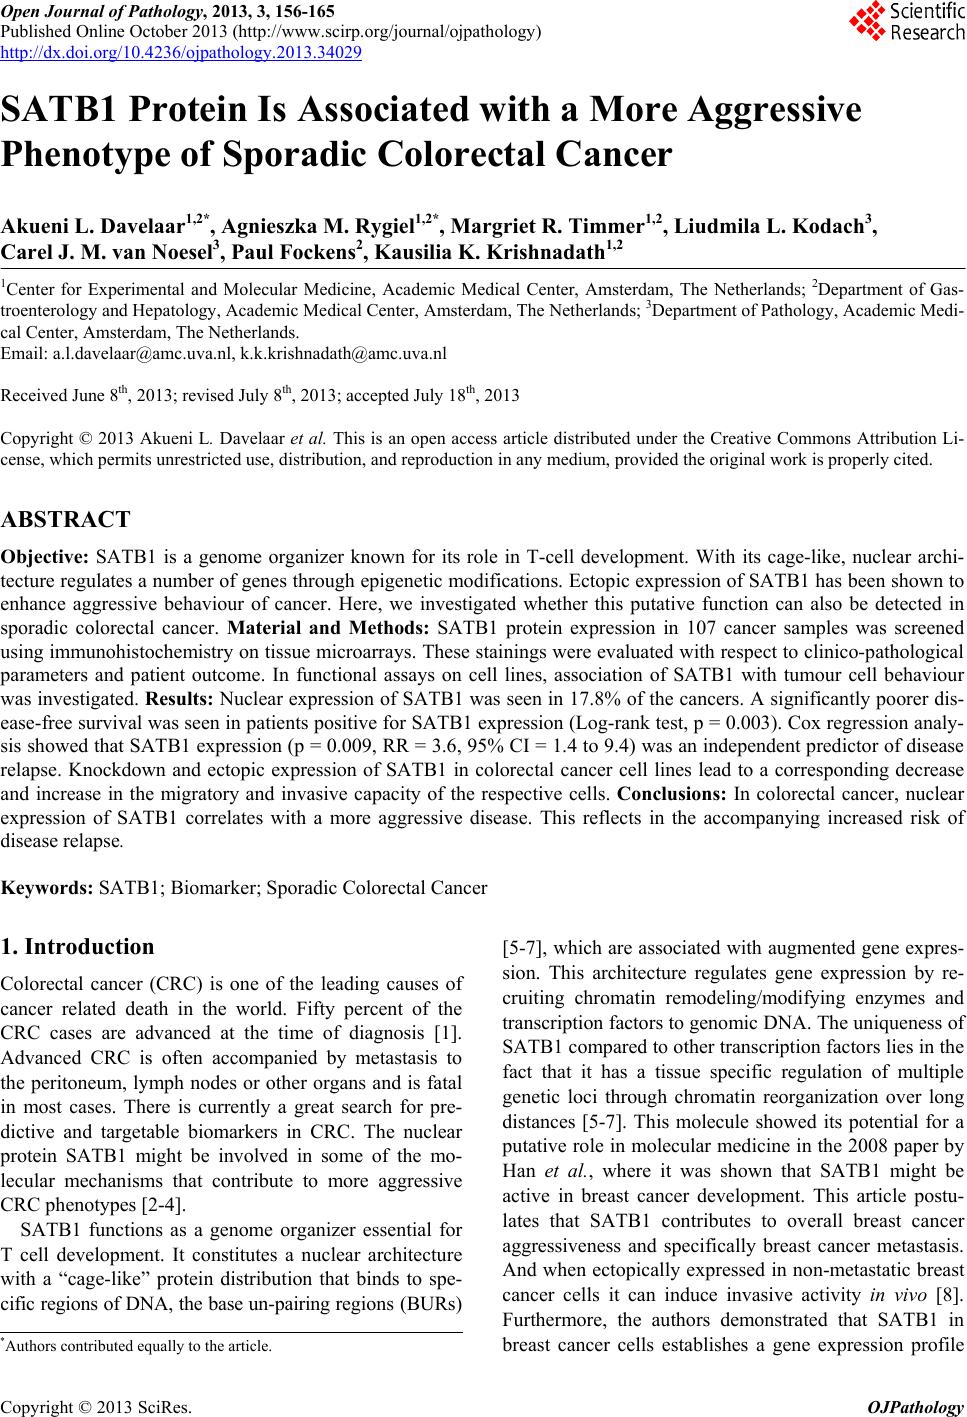
|