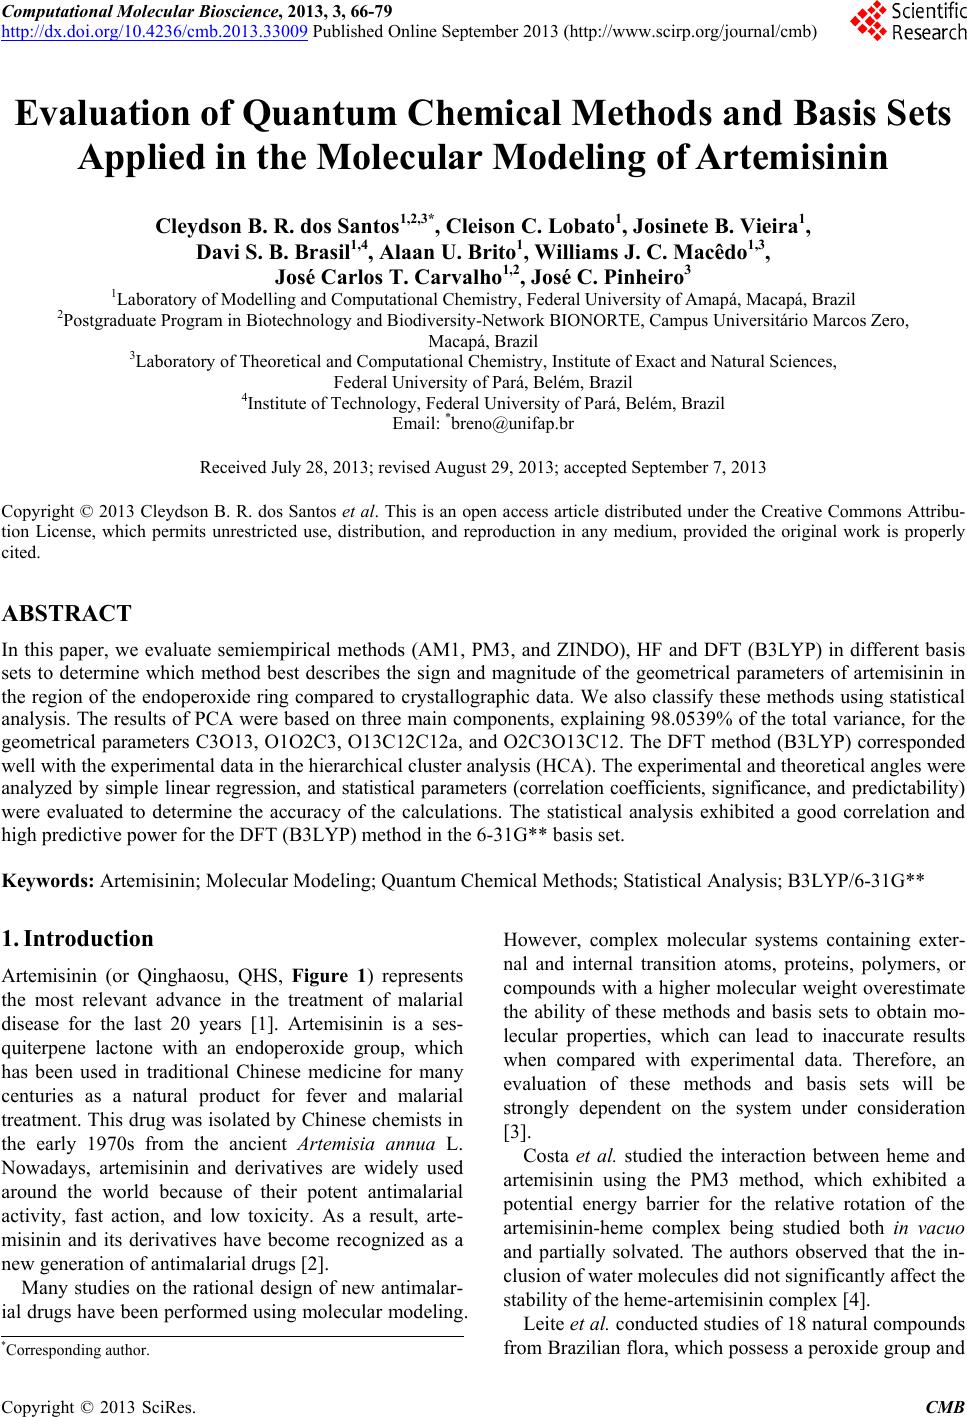
 Computational Molecular Bioscience, 2013, 3, 66-79 http://dx.doi.org/10.4236/cmb.2013.33009 Published Online September 2013 (http://www.scirp.org/journal/cmb) Evaluation of Quantum Chemical Meth ods and Basis Sets Applied in the Molecular Modeling of Artemisinin Cleydson B. R. dos Santos1,2,3*, Cleison C. Lobato1, Josinete B. Vieira1, Davi S. B. Brasil1,4, Alaan U. Brito1, Williams J. C. Macêdo1,3, José Carlos T. Carvalho1,2, José C. Pinheiro3 1Laboratory of Modelling and Computational Chemistry, Federal University of Amapá, Macapá, Brazil 2Postgraduate Program in Biotechnology and Biodiversity-Network BIONORTE, Campus Universitário Marcos Zero, Macapá, Brazil 3Laboratory of Theoretical and Computational Chemistry, Institute of Exact and Natural Sciences, Federal University of Pará, Belém, Brazil 4Institute of Technology, Federal University of Pará, Belém, Brazil Email: *breno@unifap.br Received July 28, 2013; revised August 29, 2013; accepted September 7, 2013 Copyright © 2013 Cleydson B. R. dos Santos et al. This is an open access article distributed under the Creative Commons Attribu- tion License, which permits unrestricted use, distribution, and reproduction in any medium, provided the original work is properly cited. ABSTRACT In this paper, we evaluate semiempirical methods (AM1, PM3, and ZINDO), HF and DFT (B3LYP) in different basis sets to determine which method best describes the sign and magnitude of the geometrical parameters of artemisinin in the region of the endoperoxide ring compared to crystallographic data. We also classify these methods using statistical analysis. The results of PCA were based on three main components, explaining 98.0539% of the total variance, for the geometrical parameters C3O13, O1O2C3, O13C12C12a, and O2C3O13C12. The DFT method (B3LYP) corresponded well with the experimental data in the hierarchical cluster analysis (HCA). The experimental and theoretical angles were analyzed by simple linear regression, and statistical parameters (correlation coefficients, significance, and predictability) were evaluated to determine the accuracy of the calculations. The statistical analysis exhibited a good correlation and high predictive power for the DFT (B3LYP) method in the 6-31G** basis set. Keywords: Artemisinin; Molecular Modeling; Quantum Chemical Methods; Statistical Analysis; B3LYP/6-31G** 1. Introduction Artemisinin (or Qinghaosu, QHS, Figure 1) represents the most relevant advance in the treatment of malarial disease for the last 20 years [1]. Artemisinin is a ses- quiterpene lactone with an endoperoxide group, which has been used in traditional Chinese medicine for many centuries as a natural product for fever and malarial treatment. This drug was isolated by Chinese chemists in the early 1970s from the ancient Artemisia annua L. Nowadays, artemisinin and derivatives are widely used around the world because of their potent antimalarial activity, fast action, and low toxicity. As a result, arte- misinin and its derivatives have become recognized as a new generation of antimalarial drugs [2]. Many studies on the rational design of new antimalar- ial drugs have been performed using molecular modeling. However, complex molecular systems containing exter- nal and internal transition atoms, proteins, polymers, or compounds with a higher molecular weight overestimate the ability of these methods and basis sets to obtain mo- lecular properties, which can lead to inaccurate results when compared with experimental data. Therefore, an evaluation of these methods and basis sets will be strongly dependent on the system under consideration [3]. Costa et al. studied the interaction between heme and artemisinin using the PM3 method, which exhibited a potential energy barrier for the relative rotation of the artemisinin-heme complex being studied both in vacuo and partially solvated. The authors observed that the in- clusion of water molecules did not significantly affect the stability of the heme-artemisinin complex [4]. Leite et al. conducted studies of 18 natural compounds from Brazilian flora, which possess a peroxide group and *Corresponding author. C opyright © 2013 SciRes. CMB  C. B. R. D. SANTOS ET AL. 67 Figure 1. Artemisinin (structure) and region essential for the expression of biological activity (pharmacophore). are assumed to act in heme protein, leading to a reduction in peroxide binding and the production of radicals that can kill the etiological agents of malaria (Plasmodium falciparum strains). These findings motivated the re- searchers to study the interactions among 18 natural per- oxides. They initially performed a conformational search using the MM3 method for each molecule, and the most stable conformers were optimized by the PM3 (tm) me- thod. The interactions between the peroxide-heme groups were then evaluated, and the results indicated that four of the compounds may exhibit desirable antimalarial activ- ity [5]. Recent studies on 51 peroxides were conducted to identify correlations between in silico parameters and experimental data for identifying new antimalarial agents from natural sources. The interaction of the heme group was studied by molecular docking refinement followed by conformational analysis using semiempirical paramet- ric method 6 (PM6). The results indicated that two of these compounds are promising antimalarials [6]. Artemisinin derivatives with antimalarial activity against Plasmodium fa lciparum, which is resistant to me- floquine, were studied using quantum chemical methods (HF/6-31G*) and the partial least-squares (PLS) method. Three main components explained 89.55% of the total variance, with Q2 = 0.83 and R2 = 0.92. From a set of 10 proposed artemisinin derivatives (artemisinin derivatives with unknown antimalarial activity against Plasmodium falciparum), a novel compound was produced with supe- rior antimalarial activity compared to the compounds previously described in the literature [7]. Recently, Cristino et al. [8] used the B3LYP/6-31G* method to model artemisinin and 19,10-substituted de- oxoartemisinin derivatives, with different degrees of ac- tivity against the Plasmodium falciparum D-6 strains of Sierra Leone. Chemometric methods (PCA, HCA, KNN, SIMCA, and SDA) were employed to reduce the dimen- sionality and to determine which subset of descriptors is responsible for the classification between more and less active agents. Figueiredo et al. [9] conducted studies using the B3LYP/6-31G* method for antimalarial compounds against Plasmodium falciparum K1. These studies led to multivariate models for artemisinin derivatives and series of dispiro-1,2,4-trioxolanes. The application of these models has enabled the prediction of activity for com- pounds designed without known biological activity. Moreover, a new series of antimalarial compounds is currently in the study phase. Araújo et al. [10] used density functional theory (6- 31G*) to verify the performance of a basis set in repro- ducing experimental data, particularly geometrical pa- rameters, and to calculate the interaction energies, elec- tronic states, and geometrical arrangements for com- plexes composed of a heme group and artemisinin. The results demonstrated that the interaction between arte- misinin and the heme group occurs at long distances through a complex in which the iron atom of the heme group retains its electronic characteristics, with the quin- tet state being the most stable. These results suggest that the interaction between artemisinin and heme is thermo- dynamically favorable. In this paper, we propose to identify the best method and basis set for molecular modeling of the pharmaco- phoric group of artemisinin and its derivatives. There is currently a diversity of methods and basis sets that can be applied to reproduce experimental data and to elucidate the biological significance of this compound. An identi- fication of the best theoretical method for data acquisi- tion is critical in achieving credible in silico results with respect to biological action. Artemisinin was modeled using five methods and seven basis sets (6-31G, 6-31G*, 6-31G**, 3-21G, 3-21G*, 3-21G**, and 6-311G) based on the properties of the endoperoxide group present in artemisinin, which is responsible for the biological activ- ity, and the results were evaluated via principal compo- nent analysis (PCA), hierarchical cluster analysis (HCA), and statistical analysis using simple linear regression. 2. Experimental 2.1. Molecular Modeling of Artemisinin The artemisinin compound was constructed as follows: initially, the structure of artemisinin was established with the Gauss View 3.0 program [11] and optimized using different methods and basis sets: semiempirical (AM1, PM3, and ZINDO), Hartree-Fock (HF/6-31G, HF/6-31G*, HF/6-31G**, HF/3-21G, HF/3-21G*, HF/3-21G**, and HF/6-311G), and DFT (B3LYP/6-31G, B3LYP/6-31G*, B3LYP/6-31G**, and B3LYP/3-21G) implemented with the Gaussian 03 program [12]. These calculations were performed to determine which methods and basis sets provide the best compromise between computational time and accuracy compared to the experimental data [13]. The experimental structure of artemisinin was re- Copyright © 2013 SciRes. CMB  C. B. R. D. SANTOS ET AL. 68 moved from the Database Cambridge Structural CSD with REFCODES: QNGHSU10, crystallographic R fac- tor 3.6 [14]. The numbering of atoms adopted in this study is shown in Figure 1 (artemisinin). When measurements are made on a number of objects, the results are typically organized in a data matrix. The measures in this study (geometrical parameters) were organized in rows, and the objects (quantum chemical methods and basis sets) were organized in columns. Sta- tistical analysis was conducted with the Piroutte 3.10 and Statistica 6.2 programs [15,16]. The statistical analysis of the geometrical parameters was based on the studies of Silva et al., in which density functional theory (DFT) calculations (B3PW91/DGD- ZVP) were employed to determine 13C and 1H nuclear magnetic resonance (NMR) chemical shifts for the two dihydrochalcones: 3,4,5-tetramethoxydihydrochalcone and 2,3,4,4-trimethoxydihydrochalcone. The theoretical and experimental NMR data were analyzed by simple linear regression, and the most relevant parameters were se- lected. In addition, other statistical parameters (correla- tion coefficients, significance, and predictability) were employed to verify the accuracy of the calculations. The statistical analysis indicated a good correlation between the NMR experiment results and the theoretical data, with high predictive power [17]. 2.2. Principal Component Analysis (PCA) PCA was performed with autoscaled processing for a maximum of three factors (3PCS), using the “leave-one- out validation method and cross-validation” procedure. The data matrix was constructed from the combinations of methods and basis sets, resulting in a 15 × 18 matrix. Each column was related to five methods and seven basis sets, and one column was related to the experimental geometrical parameters [13]. Each row represents 18 geometrical parameters of the 1,2,13-trioxane ring (bond lengths, bond angles, and torsion angles). The final PCA results led to the selection of a small number of geomet- rical parameters that were most strongly related to the dependent variable, which was the standard deviation of the methods and basis sets in this case. 2.3. Hierarchical Cluster Analysis (HCA) Similar to the PCA results, the HCA results are qualita- tive and are arranged in the form of a dendrogram to dis- play the methods studied and the variables (geometrical parameters of artemisinin) in a two-dimensional space. The results illustrate the combinations or divisions made in each successive stage of analysis. The samples (meth- ods and basis sets) are represented by the bottom branch of the dendrogram. The similarity between agglomerates is given by the length of each branch such that methods and basis sets with low levels of similarity have long branches and methods and basis sets with high similarity have short branches [18]. In HCA, the distance between these variables is calculated and transformed into a simi- larity matrix S. A hierarchical cluster analysis aims to display data in a manner that accentuates the natural groupings and patterns. Statistical analysis was required in this study to group similar methods and basis sets in their respective categories. HCA is a statistical method that was developed for this purpose. 2.4. Statistical Analysis Statistical analysis via simple linear regression can cor- relate data from more relevant parameters to estimate and predict values using a model built with a full dataset and actual values of yi (r), the explained variance (, i.e., adjusted R2), Fisher ratio values (F), and the standard error of estimation (SEE). The equations were also tested for their predictive power using a cross-validation pro- cedure. Cross-validation is a practical and reliable me- thod for verifying the predictive power. In the so-called “leave-one-out” approach, a number of models are de- veloped with one sample omitted in each step. After de- veloping each model, the omitted data are predicted and the differences between the actual and predicted y values are calculated. The sum of squares of these differences is computed, and finally, the performance of the model (its predictive ability) can be given by the prediction residual error sum of squares (PRESS) and standard deviation of the cross-validation (SPRESS), as shown in Equations (1) and (2) [19]: 2 A R 2 1 PRESS n i i y (1) PRESS PRESS 1 Snk (2) where yi is the experimental value, y is the predicted val- ue, n is the number of samples used to build the model, and k is the number of geometrical parameters. The pre- dictive ability of the model can also be quantified in terms of the cross-validated correlation coefficient (Q2), which is defined as [19] 2 mean 2 1 PRESS 1.0; where, n i i Qy yy y (3) In addition, other statistical parameters are available to verify the accuracy of the calculation, but none of these parameters are fully satisfactory if taken alone. For each system, we present parameters a and b from linear re- gression calcd = a + b expt1; the mean absolute error (MAE) defined as exp 1ncalcdt , and the corrected mean absolute error, CMAE [20], defined as MAE n Copyright © 2013 SciRes. CMB  C. B. R. D. SANTOS ET AL. Copyright © 2013 SciRes. CMB 69 exp 1 CMAE ncorrtn , where corrcalcd ab to correct for systematic errors. tween B3LYP/6-31G and B3LYP/6-31G*, ±0.260 be- tween B3LYP/6-31G and B3LYP/6-31G**, and ±0.124 between B3LYP/6-31G* and B3LYP/6-31G**. 3. Results and Discussion 3.2. PCA and HCA 3.1. Determination of the Theoretical Geometrical Parameters of Artemisinin The advantage of the PCA and HCA methods in this study is that all structural parameters are considered si- multaneously and all of their correlations are considered. We determined the geometrical parameters for the 1,2, 13-trioxane ring of artemisinin (bond length, bond angle, and torsion angle of atoms in this ring), as shown in Ta- ble 1. Table 1 illustrates that for the DFT method, all four basis sets (B3LYP/6-31G, B3LYP/6-31G*, B3LYP/ 6-31G**, and B3LYP/3-21G) can accurately describe all of the structural parameters with respect to their magni- tude and sign when compared with the experimental val- ues. Meanwhile, the semiempirical (AM1, PM3, and ZINDO) and Hartree-Fock (HF/6-31G, HF/6-31G*, HF/ 6-31G**, HF/3-21G, HF/3-21G*, HF/3-21G**, and HF/6-311G) methods exhibited standard deviations of 4.776, 8.388, and 4.372 and 1.663, 2.484, 1.762, 1.722, 1.714, 1.797, and 1.658, respectively. By comparing these methods with the DFT method, we find that all of the basis sets (B3LYP/6-31G, B3LYP/6-31G*, and B3LYP/6-31G**) have low standard deviations in rela- tion to the semiempirical and Hartree-Fock methods at 0.843 (B3LYP/6-31G), 1.227 (B3LYP/6-31G*), and 1.103 (B3LYP/6-31G**). The variation was ±0.384 be- Figure 2 presents the PC1-PC2 scores for the five methods and seven basis sets and one score related to the experimental geometrical parameters of the 1,2,13-tri- oxane ring. The methods are divided into two groups according to PC2, where the semiempirical and Har- tree-Fock methods are located at the bottom and the ex- perimental data and the DFT/B3LYP method and basis sets (B3LYP/6-31G, B3LYP/6-31G*, B3LYP/6-31G**, and B3LYP/3-21G) are located at the top. Figure 3 presents the PC1-PC2 loading for the four most important geometrical parameters related to the trioxane ring, namely, C3O13, O1O2C3, O13C12C12a, and O2C3O13C12. These geometrical parameters are responsible for the separation of the methods and basis sets into three groups, namely, semiempirical, Hartree- Fock, and DFT methods, as shown in Figure 2. The four geometrical parameters related to the trioxane ring are identified by atoms C3O13, which provides the interpla- nar distance between these two atoms (bond length), Figure 2. Plot of PC1-PC2 scores for the five methods and seven basis sets and the experimental geometrical parameters of the 1,2,13-trioxane ring. 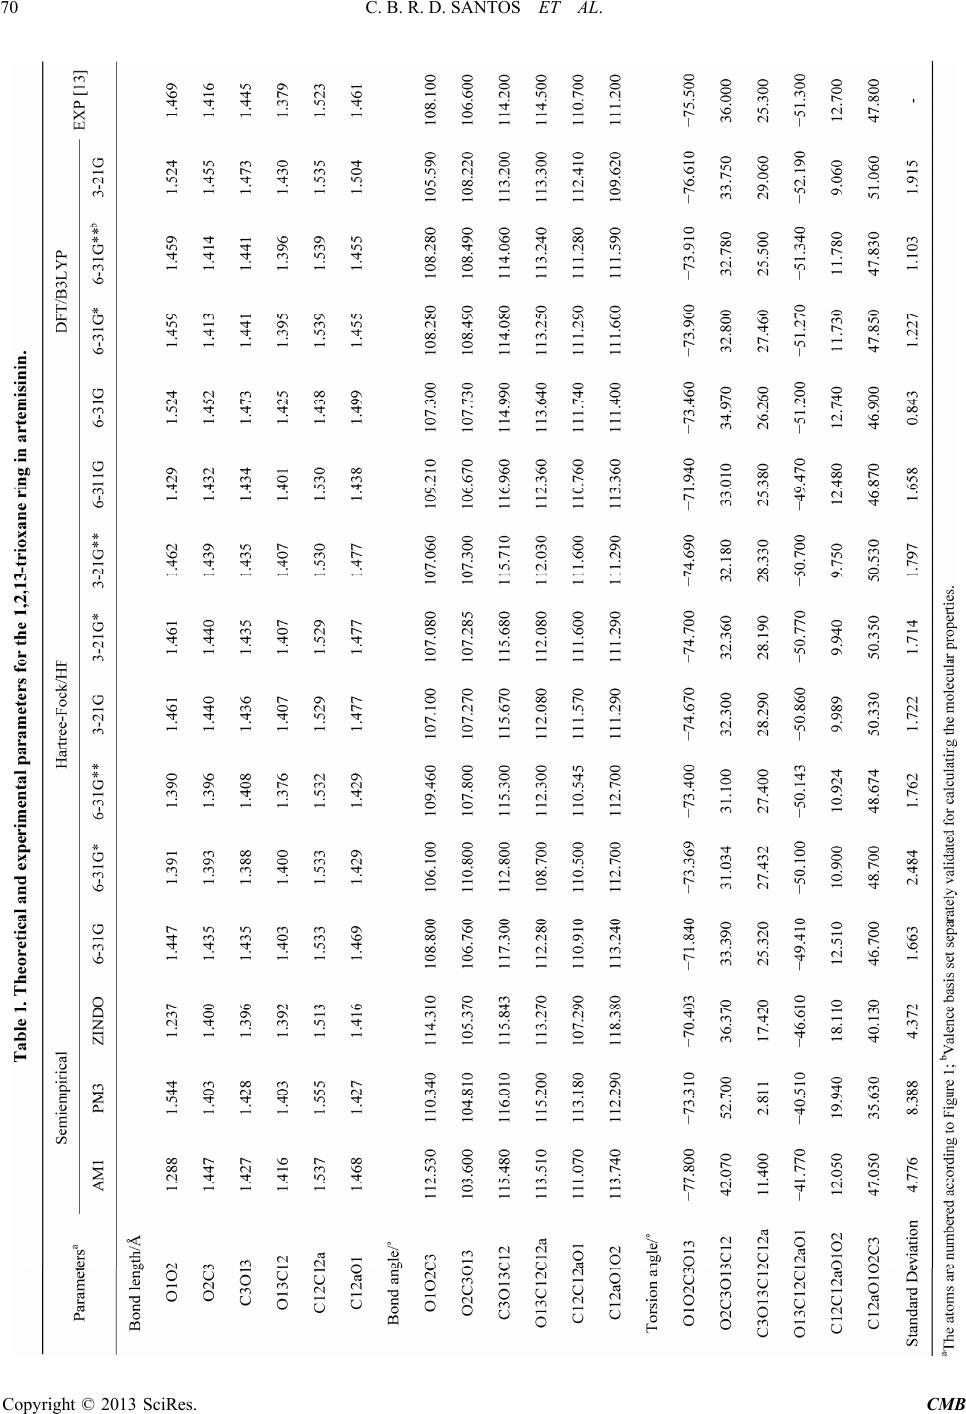 C. B. R. D. SANTOS ET AL. 70 Copyright © 2013 SciRes. CMB 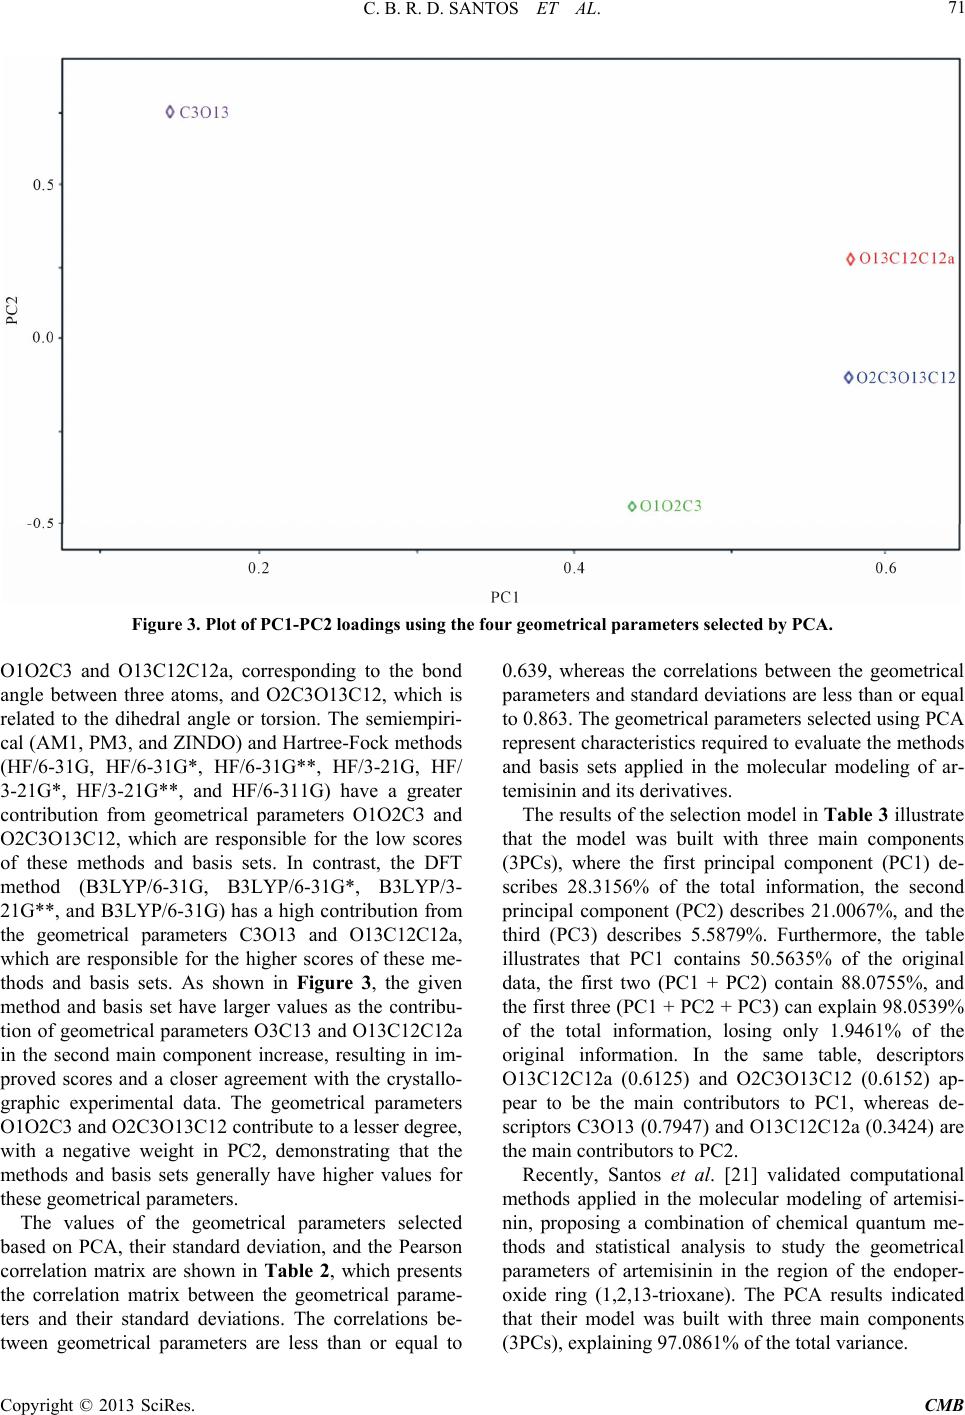 C. B. R. D. SANTOS ET AL. Copyright © 2013 SciRes. CMB 71 Figure 3. Plot of PC1-PC2 loadings using the four geometrical parameters selected by PCA. O1O2C3 and O13C12C12a, corresponding to the bond angle between three atoms, and O2C3O13C12, which is related to the dihedral angle or torsion. The semiempiri- cal (AM1, PM3, and ZINDO) and Hartree-Fock methods (HF/6-31G, HF/6-31G*, HF/6-31G**, HF/3-21G, HF/ 3-21G*, HF/3-21G**, and HF/6-311G) have a greater contribution from geometrical parameters O1O2C3 and O2C3O13C12, which are responsible for the low scores of these methods and basis sets. In contrast, the DFT method (B3LYP/6-31G, B3LYP/6-31G*, B3LYP/3- 21G**, and B3LYP/6-31G) has a high contribution from the geometrical parameters C3O13 and O13C12C12a, which are responsible for the higher scores of these me- thods and basis sets. As shown in Figure 3, the given method and basis set have larger values as the contribu- tion of geometrical parameters O3C13 and O13C12C12a in the second main component increase, resulting in im- proved scores and a closer agreement with the crystallo- graphic experimental data. The geometrical parameters O1O2C3 and O2C3O13C12 contribute to a lesser degree, with a negative weight in PC2, demonstrating that the methods and basis sets generally have higher values for these geometrical parameters. The values of the geometrical parameters selected based on PCA, their standard deviation, and the Pearson correlation matrix are shown in Table 2, which presents the correlation matrix between the geometrical parame- ters and their standard deviations. The correlations be- tween geometrical parameters are less than or equal to 0.639, whereas the correlations between the geometrical parameters and standard deviations are less than or equal to 0.863. The geometrical parameters selected using PCA represent characteristics required to evaluate the methods and basis sets applied in the molecular modeling of ar- temisinin and its derivatives. The results of the selection model in Table 3 illustrate that the model was built with three main components (3PCs), where the first principal component (PC1) de- scribes 28.3156% of the total information, the second principal component (PC2) describes 21.0067%, and the third (PC3) describes 5.5879%. Furthermore, the table illustrates that PC1 contains 50.5635% of the original data, the first two (PC1 + PC2) contain 88.0755%, and the first three (PC1 + PC2 + PC3) can explain 98.0539% of the total information, losing only 1.9461% of the original information. In the same table, descriptors O13C12C12a (0.6125) and O2C3O13C12 (0.6152) ap- pear to be the main contributors to PC1, whereas de- scriptors C3O13 (0.7947) and O13C12C12a (0.3424) are the main contributors to PC2. Recently, Santos et al. [21] validated computational methods applied in the molecular modeling of artemisi- nin, proposing a combination of chemical quantum me- thods and statistical analysis to study the geometrical parameters of artemisinin in the region of the endoper- oxide ring (1,2,13-trioxane). The PCA results indicated that their model was built with three main components (3Cs), explaining 97.0861% of the total variance. P 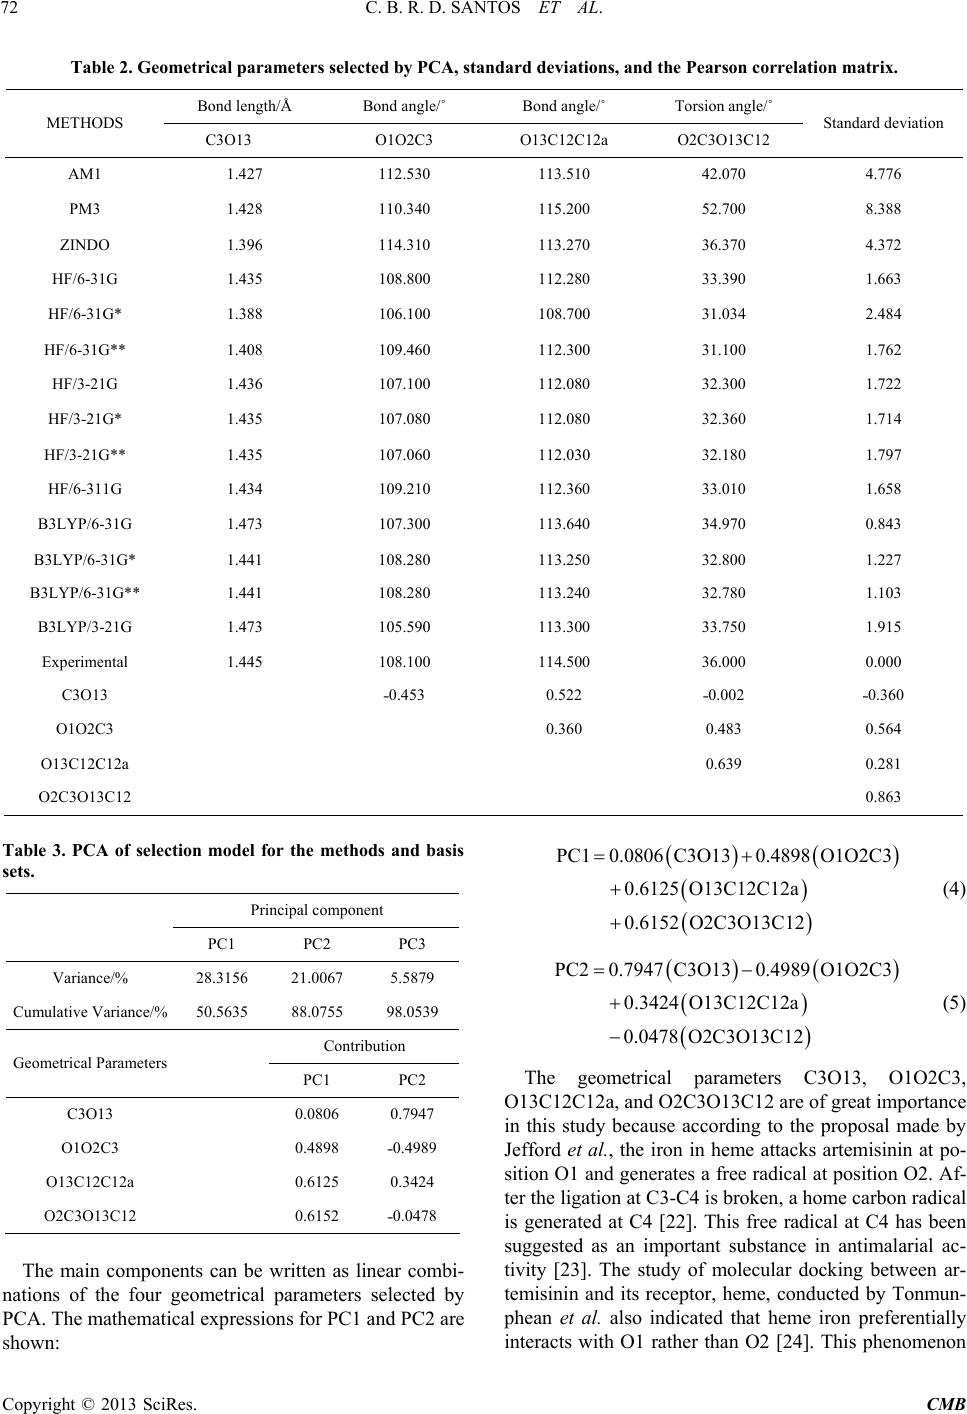 C. B. R. D. SANTOS ET AL. 72 Table 2. Geometrical parameters selected by PCA, standard deviations, and the Pearson correlation matrix. Bond length/Å Bond angle/˚ Bond angle/˚ Torsion angle/˚ METHODS C3O13 O1O2C3 O13C12C12a O2C3O13C12 Standard deviation AM1 1.427 112.530 113.510 42.070 4.776 PM3 1.428 110.340 115.200 52.700 8.388 ZINDO 1.396 114.310 113.270 36.370 4.372 HF/6-31G 1.435 108.800 112.280 33.390 1.663 HF/6-31G* 1.388 106.100 108.700 31.034 2.484 HF/6-31G** 1.408 109.460 112.300 31.100 1.762 HF/3-21G 1.436 107.100 112.080 32.300 1.722 HF/3-21G* 1.435 107.080 112.080 32.360 1.714 HF/3-21G** 1.435 107.060 112.030 32.180 1.797 HF/6-311G 1.434 109.210 112.360 33.010 1.658 B3LYP/6-31G 1.473 107.300 113.640 34.970 0.843 B3LYP/6-31G* 1.441 108.280 113.250 32.800 1.227 B3LYP/6-31G** 1.441 108.280 113.240 32.780 1.103 B3LYP/3-21G 1.473 105.590 113.300 33.750 1.915 Experimental 1.445 108.100 114.500 36.000 0.000 C3O13 ˗0.453 0.522 ˗0.002 ˗0.360 O1O2C3 0.360 0.483 0.564 O13C12C12a 0.639 0.281 O2C3O13C12 0.863 Table 3. PCA of selection model for the methods and basis sets. Principal component PC1 PC2 PC3 Variance/% 28.3156 21.0067 5.5879 Cumulative Variance/% 50.5635 88.0755 98.0539 Contribution Geometrical Parameters PC1 PC2 C3O13 0.0806 0.7947 O1O2C3 0.4898 ˗0.4989 O13C12C12a 0.6125 0.3424 O2C3O13C12 0.6152 ˗0.0478 The main components can be written as linear combi- nations of the four geometrical parameters selected by PCA. The mathematical expressions for PC1 and PC2 are shown: PC10.0806 C3O130.4898O1O2C3 0.6125 O13C12C12a 0.6152 O2C3O13C12 (4) PC20.7947 C3O130.4989 O1O2C3 0.3424 O13C12C12a 0.0478 O2C3O13C12 (5) The geometrical parameters C3O13, O1O2C3, O13C12C12a, and O2C3O13C12 are of great importance in this study because according to the proposal made by Jefford et al., the iron in heme attacks artemisinin at po- sition O1 and generates a free radical at position O2. Af- ter the ligation at C3-C4 is broken, a home carbon radical is generated at C4 [22]. This free radical at C4 has been suggested as an important substance in antimalarial ac- tivity [23]. The study of molecular docking between ar- temisinin and its receptor, heme, conducted by Tonmun- phean et al. also indicated that heme iron preferentially interacts with O1 rather than O2 [24]. This phenomenon Copyright © 2013 SciRes. CMB  C. B. R. D. SANTOS ET AL. 73 leads to the importance of geometry parameters C3O13 and O1O2C3, which were selected to be associated with the suggested mechanism in this model. Table 4 presents the geometrical parameters selected by PCA, the methods, the basis sets, and the variations in the geometrical parameters with respect to the experi- mental data (Δ and Δ%). The semiempirical and Har- tree-Fock methods do not exhibit a good agreement be- tween the theoretical and experimental values for the bond angles and torsion angles, particularly for the an- gles formed by atoms O13C12C12a and O2C3O13C12, respectively. The semiempirical methods (AM1, PM3, and ZINDO) present deviations of Δ = 0.990˚ (Δ% = 0.864), Δ = −0.700˚ (Δ% = −0.611), and Δ = 1.230˚ (Δ% = 1.074), respectively, in relation to the angle O13C12C12a. For angle O2C3O13C12, deviations of Δ = −6.070˚ (Δ% = −16.861), Δ = −16.700˚ (Δ = −46.388%), and Δ = −0.370˚ (Δ% = −1.027) were observed. For the Hartree-Fock methods (HF/6-31G, HF/6-31G*, HF/6-31G**, HF/ 3-21G, HF/3-21G*, HF/3-21G**, and HF/6-311G), the angle formed by atoms O13C12C12a have deviations of Δ = 2.220˚ (Δ% = 1.938), Δ= 5.800˚ (Δ% = 5.065) and Δ = 2.200˚ (Δ% = 1.921), Δ = 2.420˚ (Δ% = 2.113), Δ = 2.420˚ (Δ% = 2.113), Δ = 2.470˚ (Δ% = 2.157), and Δ = 2.140˚ (Δ% = 1.868), respectively. For the angle O2C3O13C12, deviations of Δ = 2.610˚ (Δ% = 7.250), Δ = 4.966˚ (Δ% = 13.794), Δ = 4.900 (Δ% = 13.611), Δ = 3.700˚ (Δ% = 10.277), Δ = 3.640˚ (Δ% = 10.111), Δ = 3.820˚ (Δ% = 10.611), and Δ = 2.990˚ (Δ% = 8.305) were obtained. For the DFT/B3LYP method, the four levels (6-31G, 6-31G*, 6-31G**, and 3-21G) exhibited excellent results for the bond angle O1O2C3, with devia- tions of Δ = −0.800˚ (Δ% = −0.740) for DFT/B3LYP 6-31G, Δ = −0.180 (Δ% = −0.166) for DFT/B3LYP 6-31G*, Δ = 0.180˚ (Δ% = −0.166) for DFT/B3LYP 6-31G**, and Δ = 2.510˚ (Δ% = 2.321) for DFT/B3LYP 3-21G, as shown in Table 4. As also shown in Table 4, by accounting for the fea- tures of the basis sets B3LYP/6-31G* and B3LYP/ 6-31G**, excellent results were obtained in relation to the bond length C3O13 and bond angle O1O2C3, which exhibited good agreement with the experimental values reported in the literature. Thus, for the 6-31G* and 6-31G** bases, these parameters are close to the crystal- lographic experimental data in the region of the endoper- oxide ring of artemisinin. HCA was used to explore and more appropriately group the methods and basis sets according to their simi- larities. A dendrogram was obtained with autoscaled processing based on the Euclidean distance and incre- mental method, as shown in Figure 4. This figure illus- trates the grouping of the three classes: semiempirical (AM1, PM3, and ZINDO), Hartree-Fock (HF/6-31G, HF/6-31G*, HF/6-31G**, HF/3-21G, HF/3-21G*, HF/ 3-21G**, and HF/6-311G), and DFT (B3LYP/6-31G, B3LYP/6-31G*, B3LYP/6-31G**, and B3LYP/3-21G). The semiempirical method has long branches, indicating a low similarity with the experimental data. However, the Hartree-Fock method exhibits similarity between the basis sets, indicated by short branches, for the HF/ 3-21G**, HF/3-21G*, and HF/3-21G bases. Cardoso et al. [25] studied artemisinin and some of its derivatives with activity against D-6 strains of Plasmodium falcipa- rum using the HF/3-21G method. To verify the reliability of the geometry obtained, Cardoso et al. compared the structural parameters of the artemisinin trioxane ring with theoretical and experimental values from the litera- ture. Ferreira et al. [26] also studied artemisinin and 18 derivatives with antimalarial activity against W-2 strains of Plasmodium falciparum through quantum chemistry and multivariate analysis. The geometry optimization of structures was realized using the Hartree-Fock method and the 3-21G** basis set. The DFT/B3LYP method exhibits high similarity be- tween the basis sets, particularly for the B3LYP/6-31G* and B3LYP/6-31G** basis sets, as indicated by the short branches between them, shown in Figure 4. The results of the theoretical methods and experimen- tal data exhibited a distribution similar to that obtained with PCA. Thus, HCA confirmed the results achieved by PCA. 3.3. Statistical Analysis of Parameters In this step, regression models with high values of r (%), (%), Q2, and F (a statistic assessing the overall sig- nificance) and low values of MAE, CMAE, SEE, PRESS, and SPRESS were selected. 2 A R The most relevant statistical parameters are given in Table 5. When comparing the semiempirical methods, the best values were found for ZINDO (r = 99.7039%, = 99.3496%, Q2 = 99.3909, F = 1681.28, SEE = 5.3983, MAE = 4.335, CMAE = 4.0998, PRESS = 305,773, and SPRESS = 1.7486). Among the basis sets for the Hartree-Fock method, the best values were observed for HF/6-31G (r = 99.9609%, = 99.9142%, Q2 = 99.9118%, F = 12811.33, SEE = 1.9641, MAE = 1.491, CMAE = 1.4715, PRESS = 44.286, SPRESS = 0.6654), HF/6-311G (r = 99.9606%, = 99.9134%, Q2 = 99.9124%, F = 12705.14, SEE = 1.9733, MAE = 1.492, CMAE = 1.4626, PRESS = 43.985, SPRESS = 0.6632), and HF/3-21G* (r = 99.9532%, = 99.8970%, Q2 = 99.9063%, F = 10679.82, SEE = 2.1638, MAE = 1.647, CMAE = 1.6311, PRESS = 47.017, SPRESS = 0.6856). 2 A R 2 A R 2 A R 2 A R The DFT method using B3LYP, with the valence- separate basis sets B3LYP/6-31G, B3LYP/6-31G*, and B3LYP/6-31G**, achieved the best results among all of the methods and basis sets studied herein (semiempirical Copyright © 2013 SciRes. CMB  C. B. R. D. SANTOS ET AL. Copyright © 2013 SciRes. CMB 74 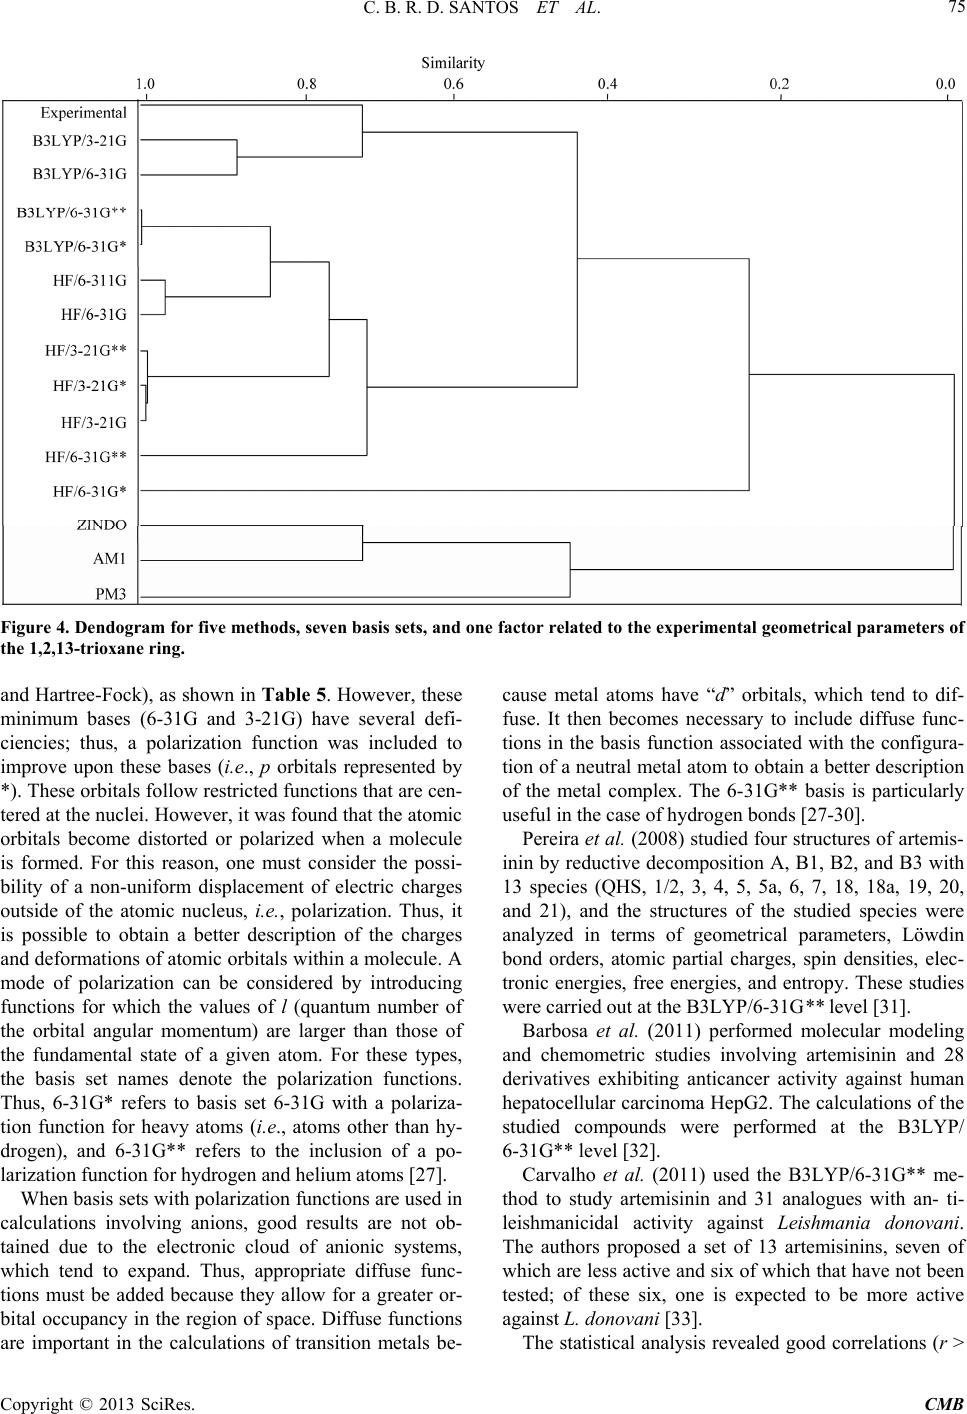 C. B. R. D. SANTOS ET AL. 75 Figure 4. Dendogram for five methods, seven basis sets, and one factor related to the experimental geometrical parameters of the 1,2,13-trioxane ring. and Hartree-Fock), as shown in Table 5. However, these minimum bases (6-31G and 3-21G) have several defi- ciencies; thus, a polarization function was included to improve upon these bases (i.e., p orbitals represented by *). These orbitals follow restricted functions that are cen- tered at the nuclei. However, it was found that the atomic orbitals become distorted or polarized when a molecule is formed. For this reason, one must consider the possi- bility of a non-uniform displacement of electric charges outside of the atomic nucleus, i.e., polarization. Thus, it is possible to obtain a better description of the charges and deformations of atomic orbitals within a molecule. A mode of polarization can be considered by introducing functions for which the values of l (quantum number of the orbital angular momentum) are larger than those of the fundamental state of a given atom. For these types, the basis set names denote the polarization functions. Thus, 6-31G* refers to basis set 6-31G with a polariza- tion function for heavy atoms (i.e., atoms other than hy- drogen), and 6-31G** refers to the inclusion of a po- larization function for hydrogen and helium atoms [27]. When basis sets with polarization functions are used in calculations involving anions, good results are not ob- tained due to the electronic cloud of anionic systems, which tend to expand. Thus, appropriate diffuse func- tions must be added because they allow for a greater or- bital occupancy in the region of space. Diffuse functions are important in the calculations of transition metals be- cause metal atoms have “d” orbitals, which tend to dif- fuse. It then becomes necessary to include diffuse func- tions in the basis function associated with the configura- tion of a neutral metal atom to obtain a better description of the metal complex. The 6-31G** basis is particularly useful in the case of hydrogen bonds [27-30]. Pereira et al. (2008) studied four structures of artemis- inin by reductive decomposition A, B1, B2, and B3 with 13 species (QHS, 1/2, 3, 4, 5, 5a, 6, 7, 18, 18a, 19, 20, and 21), and the structures of the studied species were analyzed in terms of geometrical parameters, Löwdin bond orders, atomic partial charges, spin densities, elec- tronic energies, free energies, and entropy. These studies were carried out at the B3LYP/6-31G** level [31]. Barbosa et al. (2011) performed molecular modeling and chemometric studies involving artemisinin and 28 derivatives exhibiting anticancer activity against human hepatocellular carcinoma HepG2. The calculations of the studied compounds were performed at the B3LYP/ 6-31G** level [32]. Carvalho et al. (2011) used the B3LYP/6-31G** me- thod to study artemisinin and 31 analogues with an- ti- leishmanicidal activity against Leishmania donovani. The authors proposed a set of 13 artemisinins, seven of which are less active and six of which that have not been tested; of these six, one is expected to be more active against L. donovani [33]. The statistical analysis revealed good correlations (r > Copyright © 2013 SciRes. CMB  C. B. R. D. SANTOS ET AL. 76 Table 5. Calculated correlation and fitting parameters for different methods and basis sets. Method and basis set a b r/% 2 A /% MAEbCMAEcF SEE PRESS SPRESS Q2/% ˚/AM1 0.3527 (±2.2869) 0.9975 (±0.0269) 99.637599.20403.817 3.8668 1372.07 6.0341 364.982 1.9104 99.2729 ˚/PM3 1.7477 (±3.9789) 0.9815 (±0.0468) 98.879797.54916.807 6.6778438.8210.4985 1125.718 3.355197.7576Semiempirical ˚/ZINDO 1.4298 (±2.0459) 0.9879 (±0.0240) 99.703999.34964.335 4.0998 1681.28 5.3983 305.773 1.7486 99.3909 ˚/6-31G 0.8997 (±0.7444) 0.9922 (±0.0087) 99.960999.9142 1.491 1.471512811.331.9641 44.286 0.665499.9118 ˚/6-31G* 0.2600 (±1.1455) 0.9890 (±0.0134) 99.907199.7957 2.352 2.19885375.553.0225 98.767 0.993899.8033 ˚/6-31G** 0.3649 (±0.8369) 0.9969 (±0.0098) 99.951199.89251.701 1.613710231.472.2083 49.7003 0.7049 99.9010 ˚/3-21G 0.1135 (±0.8242) 0.9980 (±0.0097) 99.952799.8960 1.643 1.628110572.082.1748 47.494 0.689199.9054 ˚/3-21G* 0.1156 (±0.8200) 0.9980 (±0.0096) 99.953299.8970 1.647 1.631110679.822.1638 47.017 0.685699.9063 ˚/3-21G** 0.1206 (±0.8601) 0.9979 (±0.0101) 99.948599.8868 1.720 1.70429707.472.2694 51.715 0.719199.8970 Hartree-Fock/HF ˚/6-311G 0.8464 (±0.7478) 0.9927 (±0.0088) 99.960699.9134 1.492 1.462612705.141.9733 43.985 0.663299.9124 ˚/6-31G 0.4455 (±0.3781) 0.9960 (±0.0044) 99.990099.9780 0.824 0.845750025.590.9977 11.367 0.337199.9774 ˚/6-31G* 0.2160 (±0.5843) 0.9981 (±0.0068) 99.976299.9477 1.036 1.042721041.001.5417 24.099 0.490999.9520 ˚/6-31G** −0.0257 (±0.5282) 0.9993 (±0.0062) 99.980699.9574 0.870 0.885625814.641.3936 19.485 0.441499.9612 ˚/3-21G −0.4588 (±0.9309) 1.0025 (±0.0109) 99.940299.8686 2.044 1.90318363.102.4562 61.878 0.786699.8767 ˚/3-21G* −0.3886 (±0.9058) 1.0020 (±0.0106) 99.943399.8754 1.999 1.87948824.322.3901 58.246 0.763199.8840 DFT/B3LYP ˚/3-21G** −0.3994 (±0.9435) 1.0021 (±0.0111) 99.938599.8649 2.069 1.94598134.512.4895 63.162 0.794799.8742 Notes: aLinear fitting parameters refer to calcd (˚) = a + b expt1 for n = 12; bMean average error: exp 1 MAEncalcdt n ; cCorrected mean average error: exp 1 CMAE ncorrt n (see text); Where corrcalcd ab to correct for systematic errors. 98% and > 99%) for all models with respect to the angles observed in crystallographic data. Figure 5 pre- sents the predicted and residuals values that were con- structed for the two best linear regression models using the DFT (B3LYP/6-31G* and B3LYP/6-31G**) method. The linear regression models for each basis set and me- thod exhibited results that were similar to the experi- mental values (see Figures 5(a) - (d)). 2 A R In these figures, the residues are randomly distributed about the zero value of the line, and therefore, there is strong evidence supporting a lack of fit for these models. Currently, the linearity of a straight calibration line is often verified using a correlation coefficient (r) computer program to perform regression. Unfortunately, there is a statistical test that can be applied to this coefficient to check linearity of straight line at a given confidence level [34]. In Figure 5(c), the maximum and minimum residue values obtained for the B3LYP/6-31G* method are shown to be 1.9911 and −3.3488, respectively. As shown in Figure 5(d), the maximum and minimum residue val- ues for the B3LYP/6-31G** method were 1.9820 and −3.1718, respectively. The statistical parameter results for the methods and basis sets exhibited a distribution similar to that obtained with HCA (see Figure 4). However, the results of the Copyright © 2013 SciRes. CMB  C. B. R. D. SANTOS ET AL. 77 (a) (b) (c) (d) Figure 5. Correlation between the calculated and experimental angle data; predicted values for the DFT/B3LYP method and the 6-31G* and 6-31G** basis sets (a) and (b) and residual values (c) and (d). DFT method for the B3LYP/6-31G** basis set exhibited the lowest values for MAE, CMAE, SEE, PRESS, and SPRESS; in comparison with B3LYP/6-31G*, the two sets have a variation of MAE = ±0.166, CMAE = ±0.1571, SEE = ±0.1481, PRESS = ±4.614, and SPRESS = ±0.0495. The molecular properties obtained depend on the me- thod and basis set used, which represent a number of functions used in the expansion monoelectronics (orbital) and parameter characteristics that must be optimized. Therefore, it is of fundamental importance that these functions be carefully evaluated to obtain accurate results. Many studies have been performed to develop methods and basis sets that can provide more accurate results. In recent years, other sets have been employed in electronic structure calculations in addition to the methods and ba- sis sets described previously [30]. Generally, the inclu- sion of polarization functions in the molecular basis al- lows for a greater probability of better results for many chemical properties of interest, such as the dissociation energy and dipole moment. In practice, the inclusion of polarization functions with d and f symmetry for small s and p basis sets has been shown to be unsatisfactory; thus, polarization functions should only be added to saturated basis sets. These results confirm the relevance of theoretical data used to calculate the angles of crystallographic data for this compound (artemisinin) for the method and basis set DFT/B3LYP 6-31G**. HCA confirmed the results ob- tained by statistical analysis. Therefore, we conclude that the DFT method combined with the B3LYP/6-31G** Copyright © 2013 SciRes. CMB  C. B. R. D. SANTOS ET AL. 78 basis set can be used for the calculation of molecular properties and for the molecular modeling of artemisinin and its derivatives with biological activity based on the mechanism of action in the region of the endoperoxide ring (1,2,13-trioxane). 4. Conclusions The statistical analysis techniques of PCA and HCA were vital in enabling the classification of methods and basis sets into three separate groups. The geometrical parameters that were found to be the most important in the classification of methods and basis sets were related to the trioxane ring: C3O13, O1O2C3, O13C12C12a, and O2C3O13C12. The HCA results were similar to those obtained with PCA. The DFT/B3LYP method with valence-separate basis set 6-31G** exhibited the best results and high predictive ability compared to the methods and basis sets studied herein (semiempirical, Hartree-Fock, and DFT). This method is suitable for molecular modeling studies of artemisinin and for determining the conformation of its derivatives along with their biological activity and me- chanism of action in the region of the endoperoxide ring. The DFT/B3LYP 6-31G** method can be used for future calculations of molecular properties, which represent a means of obtaining chemical information contained in the molecular structure of a compound for chemical, pharmacological, and toxicological studies on quantita- tive structure-activity and structure-property relation- ships. 5. Acknowledgements We gratefully acknowledge the support provided by the Brazilian Agency National Council of Scientific and Technological Development and the Institute of Exact and Natural Sciences of Federal University of Para for use of the GaussView and Gaussian software. The au- thors would like to thank the Postgraduate Program in Biotechnology and Biodiversity-Network BIONORTE, the Laboratory of Modeling and Computational Chemis- try, Federal University of Amapá for computational sup- port, and especially Professor Dr. José Walkimar de Mesquita Carneiro of Federal University Fluminense for his contributions. REFERENCES [1] S. R. Meshnick, C. W. Jefford, G. H. Posner, M. A. Ave- ry and W. Peters, “Second-Generation Antimalarial Endo- peroxides,” Parasitology Today, Vol. 12, No. 2, 1996, pp. 79-82. http://dx.doi.org/10.1016/0169-4758(96)80660-0 [2] D. L. Klayman, “Qinghaosu (Artemisinin): An Antima- larial Drug from China,” Science, Vol. 228, No. 4703, 1985, pp. 1049-1055. http://dx.doi.org/10.1126/science.3887571 [3] A. A. C. Braga and N. H. Morgon, “Cálculos Teóricos de Afinidades por Próton De N-Alquilaminas Usando o Método Oniom,” Quimica Nova, Vol. 29, No. 2, 2009, pp. 187-193. http://dx.doi.org/10.1590/S0100-40422006000200002 [4] M. S. Costa, R. Kiralj and M. M. C. Ferreira, “Estudo Teórico da Interação Existente Entre a Artemisinina e o Heme,” Quimica Nova, Vol. 30, No. 1, 2007, pp. 25-31. http://dx.doi.org/10.1590/S0100-40422007000100006 [5] F. H. A. Leite, A. G. Taranto, M. C. Santos Junior, A. Branco, M. T. Araujo and J. W. M. Carneiro, “Search for New Antimalarial Compounds Obtained From Natural Sources by Molecular Modeling,” International Journal of Quantum Chemistry, Vol. 110, No. 11, 2010, pp. 2057-2066. [6] F. H. A. Leite, J. W. M.Carneiro, M. T. Araujo, M. Co- mar Jr. and A. G. Taranto, “Docking Between Natural Peroxides and Heme Group by Parametric Method 6,” International Journal of Quantum Chemistry, Vol. 1012, No. 20, 2012, pp. 3390-3397. http://dx.doi.org/10.1002/qua.24247 [7] J. C. Pinheiro, R. Kiralj, M. M. C. Ferreira and O. A. S. Romero, “Artemisinin Derivatives with Antimalarial Ac- tivity against Plasmodium falciparum Designed with the aid of Quantum Chemical and Partial Least Squares Methods,” QSAR & Combinatorial Science, Vol. 22. No. 8, 2003, pp. 830-842. http://dx.doi.org/10.1002/qsar.200330829 [8] M. G. G. Cristino, C. C. F. Meneses, M. M. Soeiro, J. E. V. Ferreira, A. F. Figueiredo, J. P. Barbosa, R. C. O. Al- meida, J. C. Pinheiro and A. L. R. Pinheiro, “Computa- tional Modeling of Antimalarial 10-Substituted Deoxoar- temisinins,” Journal of Theoretical and Computational Chemistry, Vol. 11, No. 2, 2012, pp. 241-263. http://dx.doi.org/10.1142/S0219633612500162 [9] A. F. Figueiredo, J. E. V. Ferreira, J. P. Barbosa, W. J. C. Macêdo, M. G. G. Cristino, M. S. Lobato, J. C. Pinheiro and R. T. A. Serra, “A Computational Study on Antima- larial Dispiro-1,2,4-Trioxolanes,” Journal of Computa- tional and Theoretical Nanoscience, Vol. 8, No. 9, 2011, pp. 1847-1856. http://dx.doi.org/10.1166/jctn.2011.1892 [10] J. Q. Araújo, J. W. M. Carneiro, M. T.Araújo, F. H. A. Leite and A. G. Taranto, “Interaction between Artemisi- nin and Heme. A Density Functional Theory Study of Structures and Interaction Energies,” Bioorganic & Me- dicinal Chemistry, Vol. 16, No. 9, 2008, pp. 5021-5029. http://dx.doi.org/10.1016/j.bmc.2008.03.033 [11] GaussView 3.07, Gaussian, Inc.; Pittsburgh, PA, 1997. [12] M. J. Frisch, G. W. Trucks, H. B. Schlegel, G. E. Scuseria, M. A. Robb, J. R. Cheeseman, J. A. Montgomery Jr., T. Vreven, K. N. Kudin, J. C. Burant, J. M. Millam, S. S. Iyengar, J. Tomasi, V. Barone, B. Mennucci, M. Cossi, G. Scalmani, N. Rega, G. A. Petersson, H. Nakatsuji, M. Hada, M. Ehara, K. Toyota, R. Fukuda, J. Hasegawa, M. Ishida, T. Nakajima, Y. Honda, O. Kitao, H. Nakai, M. Klene, X. Li, J. E. Knox, H. P. Hratchian, J. B. Cross, C. Adamo, J. Jaramillo, R. Gomperts, R. E. Stratmann, O. Yazyev, A. J. Austin, R. Cammi, C. Pomelli, J. W. Och- Copyright © 2013 SciRes. CMB  C. B. R. D. SANTOS ET AL. Copyright © 2013 SciRes. CMB 79 terski, P. Y. Ayala, K. Morokuma, G. A. Voth, P. Salva- dor, J. J. Dannenberg, V. G. Zakrzewski, S. Dapprich, A. D. Daniels, M. C. Strain, O. Farkas, D. K. Malick, A. D. Rabuck, K. Raghavachari, J. B. Foresman, J. V. Ortiz, Q. Cui, A. G. Baboul, S. Clifford, J. Cioslowski, B. B. Ste- fanov, G. Liu, A. Liashenko, P. Piskorz, I. Komaromi, R. L. Martin, D. J. Fox, T. Keith, M. A. Al-Laham, C. Y. Peng, A. Nanayakkara, M. Challacombe, P. M. W. Gill, B. Johnson, W. Chen, M. W. Wong, C. Gonzalez and J. A. Pople, “Gaussian 03”, Revision C.02; Gaussian, Inc., Wallingford, 2004. [13] J. N. Lisgarten, B. S. Potter, C. Bantuzeko and R. A. Pal- mer, “Structure, Absolute Configuration, and Conforma- tion of the Antimalarial Compound, Artemisinin,” Jour- nal of Chemical Crystallography, Vol. 28, No. 7, 1998, pp. 539-543. http://dx.doi.org/10.1023/A:1023244122450 [14] F. H. Allen, “The Cambridge Structural Database: A Quarter of a Million Crystal Structures and Rising,” Acta Crystallographica Section B, Vol. 58, No. 01, 2002, pp. 380-388. http://dx.doi.org/10.1107/S0108768102003890 [15] Pirouette Software, Version 3.01, Infometrix Inc., 2001. [16] STATISTICA (Data Analysis Software System); Version 6.1, StatSoft, Inc., 2004. http://www.statsoft.com [17] S. O. Silva, M. J. C. Corrêa, H. R. Bitencourt, W. R. Mon- teiro, J. Lameira, L. S. Santos, G. M. S. P. Guilhon and D. S. B. Brasil, “Density Functional Theory Calculations of the Nuclear Magnetic Resonance Parameters for Two Dihydrochalcones,” Journal of Computational and Theo- retical Nanoscience, Vol. 9, No. 7, 2012, pp. 953-956. http://dx.doi.org/10.1166/jctn.2012.2123 [18] M. M. C. Ferreira, “Multivariate QSAR,” Journal of Bra- zilian Chemical Society, Vol. 13, No. 6, 2002, pp. 742- 753. http://dx.doi.org/10.1590/S0103-50532002000600004 [19] A. C. Gaudio and E. Zandonade, “Proposição, Validação e Análise dos Modelos que Correlacionam Estrutura Química e Atividade Biológica,” Quimica Nova, Vol. 24, No. 5, 2001, pp. 658-671. http://dx.doi.org/10.1590/S0100-40422001000500013 [20] P. Cimino, P. L. D. Gomez, R. R. Duca and G. Bifulco, “Comparison of Different Theory Models and Basis Sets in the Calculation of 13C NMR Chemical Shifts of Natural Products,” Magnetic Resonance in Chemistry, Vol. 42, No. S1, 2004, pp. S26-S33. http://dx.doi.org/10.1002/mrc.1410 [21] C. B. R. Santos, J. B. Vieira, A. S. Formigosa, E. V. M. Costa, M. T. Pinheiro, J. O. Silva, W. J. C. Macêdo and J. C. T. Carvalho, “Validation of Computational Methods Applied in Molecular Modeling of Artemisinin with Anti- malarial Activity,” Journal of Computational and Theo- retical Nanoscience, Vol. 11, No. 3, 2014, pp. 1-9. [22] C. W. Jefford, “Why Artemisinin and Certain Synthetic Peroxides are Potent Antimalarials. Implications for the Mode of Action,” Current Medicinal Chemistry, Vol. 8, No. 15, 2001, pp.1803-1826. http://dx.doi.org/10.2174/0929867013371608 [23] G. H. Posner, A. J. McRiner, I. H. Paik, S. Sur, K. Bor- stnik, S. Xie, T. A. Shapiro, A. Alagbala and B. Foster, “Anticancer and Antimalarial Efficacy and Safety of Ar- temisinin-Derived Trioxane Dimers in Rodents,” Journal of Medicinal Chemistry, Vol. 47, No. 5, 2004, pp. 1299- 1301. http://dx.doi.org/10.1021/jm0303711 [24] S. Tonmunphean, V. Parasuk and S. Kokpol, “Automated Calculation of Docking of Artemisinin to Heme,” Journal of Molecular Modeling, Vol. 7, No. 4, 2001, pp. 26-33. [25] F. J. B. Cardoso, A. F. Figueiredo, M. S. Lobato, R. M. Miranda, R. C. O. Almeida and J. C. Pinheiro, “A Study on Antimalarial Artemisinin Derivatives Using MEP Maps and Multivariate QSAR,” Journal of Molecular Modeling, Vol. 14, No. 1, 2008, pp. 39-48. http://dx.doi.org/10.1007/s00894-007-0249-9 [26] J. E. V. Ferreira, A. F. Figueiredo, J. P. Barbosa, M. G. G. Cristino, W. J. C. Macêdo, O. P. P. Silva, B. V. Malheiros, R. T. A. Serra and J. C. Pinheiro, “A Study of New An- timalarial Artemisinins Through Molecular Modeling and Multivariate Analysis,” Journal of the Serbian Chemical Society, Vol. 75, No. 11, 2010, pp. 1533-1548. http://dx.doi.org/10.2298/JSC100126124F [27] A. Leach, “Molecular Modelling—Principles and Appli- cations,” 2nd Edition, Pearson Education Limited, Upper Saddle River, 2001. [28] W. J. Hehre, “A Guide to Molecular Mechanics and Qu- antum Chemical Calculations,” Wavefunction, Inc., Ir- vine, 2003. [29] R. S. Mulliken and B. Liu, “Self-Consistent-Field Wave Functions of P2 and PO, and the Role of d Functions in Chemical Bonding and of s-p Hybridization in N2 and P2,” Journal of the American Chemical Society, Vol. 93, No. 25, 1971, pp. 6738-6744. http://dx.doi.org/10.1021/ja00754a004 [30] I. N. Levine, “Quantum Chemistry,” 4th Edition, Pren- tice-Hall, New York, 1991. [31] M. S. C. Pereira, R. Kiralj and M. M. C. Ferreira, “Theo- retical Study of Radical and Neutral Intermediates of Ar- temisinin Decomposition,” Journal Chemical Information and Modeling, Vol. 48, No. 1, 2008, pp. 85-98. http://dx.doi.org/10.1021/ci700011f [32] J. P. Barbosa, J. E. V. Ferreira, A. F. Figueiredo, R. C. O. Almeida, O. P. P. Silva, J. R. C. Carvalho, M. G. G. Cris- tino, J. C. Pinheiro, J. L. F. Vieira and R. T. A. Serra, “Molecular Modeling and Chemometric Study of Anti- cancer Derivatives of Artemisinin,” Journal of the Ser- bian Chemical Society, Vol. 76, No. 9, 2011, pp. 1263- 1282. http://dx.doi.org/10.2298/JSC111227111B [33] J. R. C. Carvalho, J. E. V. Ferreira, J. P. Barbosa, M. S. Lobato, C. C. F. Meneses, M. M. Soeiro, M. S. Farias, R. C. O. Almeida, K. C. Ventura, J. C. Pinheiro and A. L. R. Pinheiro, “Computational Modeling of Artemisinins with Antileishmanial Activity,” Journal of Computational and Theoretical Nanoscience, Vol. 8, No. 11, 2011, pp. 2193- 2203. http://dx.doi.org/10.1166/jctn.2011.1943 [34] L. M. Z. G. Passari, P. K. Soares, R. E. Bruns and I. S. Scarminio, “Estatística Aplicada à Química: Dez Dúvidas Comuns,” Quimica Nova, Vol. 34, No 5. 2011, pp. 888- 892. http://dx.doi.org/10.1590/S0100-40422011000500028
|