 Journal of Sustainable Bioenergy Systems, 2013, 3, 194-201 http://dx.doi.org/10.4236/jsbs.2013.33027 Published Online September 2013 (http://www.scirp.org/journal/jsbs) The Control of Lactobacillus sp. by Extracellular Compound Produced by Pseudomonas aeruginosa in the Fermentation Process of Fuel Ethanol Industry in Brazil Cíntia Greice Matsuoca Góis, Lucilene Lopes-Santos, Jamile Priscila de Oliveira Beranger, Admilton Gonçalves de Oliveira, Flavia Regina Spago, Galdino Andrade* Departamento de Microbiologia, Laboratório de Ecologia Microbiana, Universidade Estadual de Londrina, Londrina, Brazil Email: *andradeg@uel.br Received April 2, 2013; revised May 10, 2013; accepted June 1, 2013 Copyright © 2013 Cíntia Greice Matsuoca Góis et al. This is an open access article distributed under the Creative Commons Attribu- tion License, which permits unrestricted use, distribution, and reproduction in any medium, provided the original work is properly cited. ABSTRACT This work evaluated the effect of secondary bacterial metabolites produced by Pseudomonas sp LV strain in control of Lactobacillus sp. population in the microcosm of the vat during ethanol fermentation. The fraction F4 produced by Pseudomonas aeruginosa was extracted with dichloromethane and fractionating by vacuum liquid chromatography ob- tained in a methanol phase. The evaluation of antibiotic activity of F4 fraction mixed or not with sulphuric acid and Kamoram®. The antibiotic activity of F4 fraction was determined as well as the fermentation efficiency. Also was de- termined yeast cell viability, budding formation, the viability of budding cells, and number of populations of Sac- charomyces cerevisiae and Lactobacillus sp. The results showed that the F4 fraction had high selective antibiotic ac- tivity against Lactob acillus sp. but not for S. cerevisae, and no inhibitory effect was observed in the fermentation proc- ess by yeast. Also F4 fraction decreased flocculation and foam formation. The F4 has an antibiotic activity against Lac- tobacillus sp. and should be used as an alternative to control bacteria contamination and foam and flocculation forma- tion in the fuel ethanol fermentation process. The F4 fraction could reduce the use of antibiotics in the control of Lac- tobacillus sp. population during the fuel ethanol production. Keywords: Fuel Ethanol; Fermentation; Contamination; Lactobacillus; Yeast; Pseudomonas 1. Introduction The sugar cane (Saccharum officinarum) culture is largely used to produce sugar and fuel ethanol. Today, sugar cane is an important crop in Brazil occupying 8 million hectares producing more than 600 million tons per year, making the country the largest sugar cane pro- ducer worldwide [1]. Bacterial contamination is a continual problem in commercial fermentation cultures, particularly in fuel ethanol fermentation that is not performed under sterile and pure culture conditions [2]. A variety of Gram-posi- tive and Gram-negative bacteria have been isolated from fuel ethanol fermentations including species of Pedio- coccus, Enterococcus, Acetobacter, G luconobacter, and others [3,4]. The most common contaminant bacteria are species of Lactobacillus, which show fast growth rate and tolerance to alcohol, low pH and effectively compete with the yeast [4]. During fuel ethanol production the contamination level can increase the gum formation which can obstruct pipes, sieves, centrifuge, heat sinks, increasing the flocculation of yeast, decreasing fermentation process activity, and losing yeast cells for pellet formation on the fermentator depth. Also the flocculation decreases the centrifugation efficiency reducing the yeast viability and/or increases a formation of compounds which decreases fermentation activity and ethanol production [5]. The formation of organic acid decreases ethanol production and unfeasible yeast, resulting in an operational problem in the industry facilities [6]. Chronic bacterial contamination causes a constant draining of available sugar that is converted to ethanol by yeast, and the bacteria compete for essential micronutri- ents required for optimal yeast growth and ethanol pro- *Corresponding author. C opyright © 2013 SciRes. JSBS 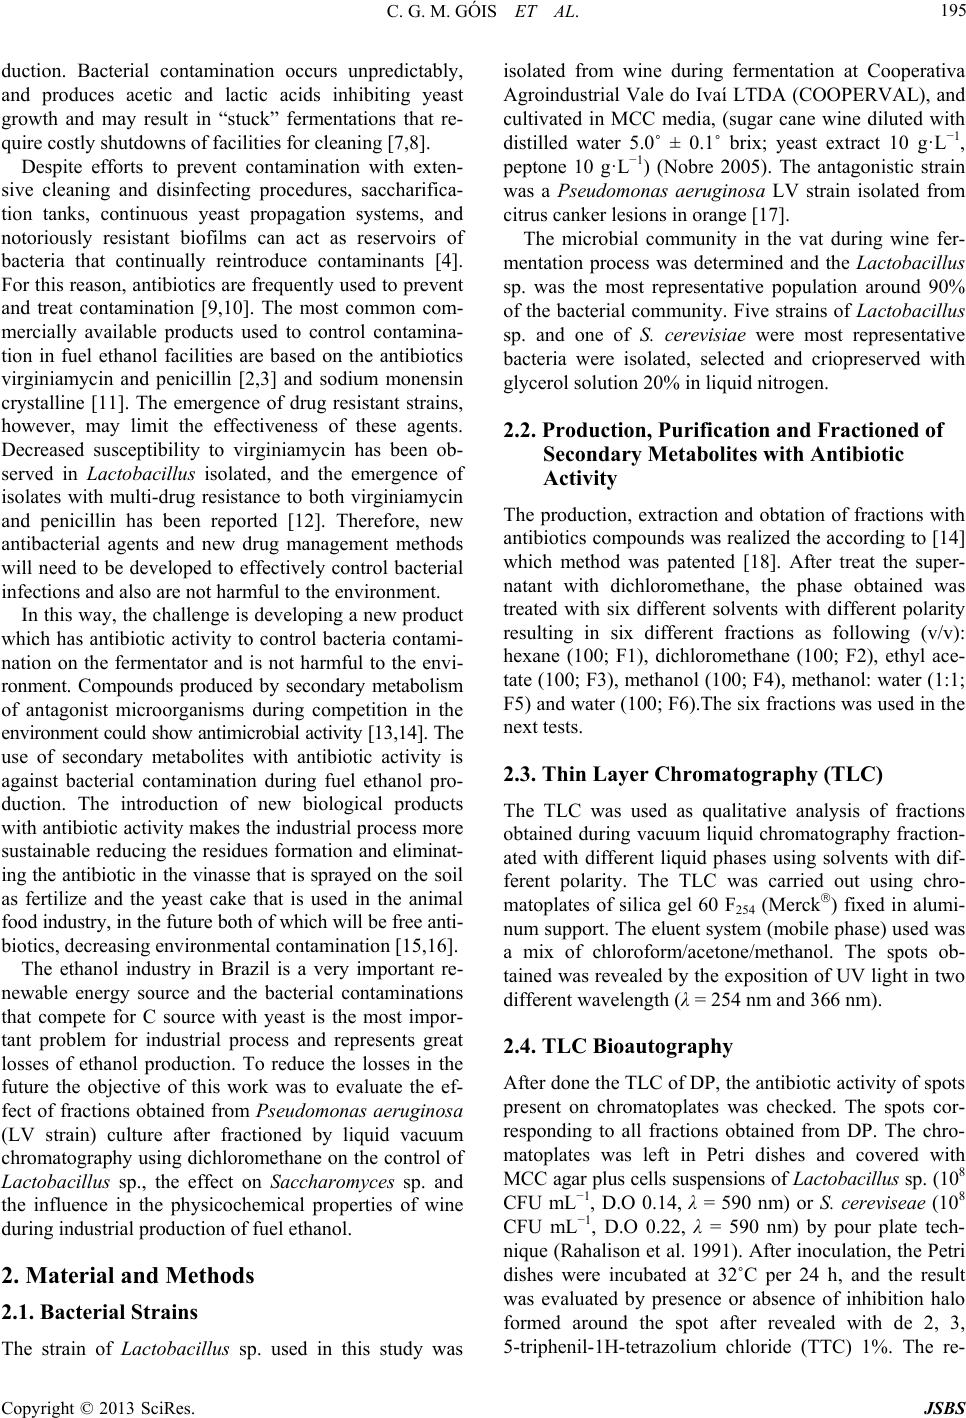 C. G. M. GÓIS ET AL. 195 duction. Bacterial contamination occurs unpredictably, and produces acetic and lactic acids inhibiting yeast growth and may result in “stuck” fermentations that re- quire costly shutdowns of facilities for cleaning [7,8]. Despite efforts to prevent contamination with exten- sive cleaning and disinfecting procedures, saccharifica- tion tanks, continuous yeast propagation systems, and notoriously resistant biofilms can act as reservoirs of bacteria that continually reintroduce contaminants [4]. For this reason, antibiotics are frequently used to prevent and treat contamination [9,10]. The most common com- mercially available products used to control contamina- tion in fuel ethanol facilities are based on the antibiotics virginiamycin and penicillin [2,3] and sodium monensin crystalline [11]. The emergence of drug resistant strains, however, may limit the effectiveness of these agents. Decreased susceptibility to virginiamycin has been ob- served in Lactobacillus isolated, and the emergence of isolates with multi-drug resistance to both virginiamycin and penicillin has been reported [12]. Therefore, new antibacterial agents and new drug management methods will need to be developed to effectively control bacterial infections and also are not harmful to the environment. In this way, the challenge is developing a new product which has antibiotic activity to control bacteria contami- nation on the fermentator and is not harmful to the envi- ronment. Compounds produced by secondary metabolism of antagonist microorganisms during competition in the environment could show antimicrobial activity [13,14]. The use of secondary metabolites with antibiotic activity is against bacterial contamination during fuel ethanol pro- duction. The introduction of new biological products with antibiotic activity makes the industrial process more sustainable reducing the residues formation and eliminat- ing the antibiotic in the vinasse that is sprayed on the soil as fertilize and the yeast cake that is used in the animal food industry, in the future both of which will be free anti- biotics, decreasing environmental contamination [15,16]. The ethanol industry in Brazil is a very important re- newable energy source and the bacterial contaminations that compete for C source with yeast is the most impor- tant problem for industrial process and represents great losses of ethanol production. To reduce the losses in the future the objective of this work was to evaluate the ef- fect of fractions obtained from Pseudomonas aeruginosa (LV strain) culture after fractioned by liquid vacuum chromatography using dichloromethane on the control of Lactobacillus sp., the effect on Saccharomyces sp. and the influence in the physicochemical properties of wine during industrial production of fuel ethanol. 2. Material and Methods 2.1. Bacterial Strains The strain of Lactobacillus sp. used in this study was isolated from wine during fermentation at Cooperativa Agroindustrial Vale do Ivaí LTDA (COOPERVAL), and cultivated in MCC media, (sugar cane wine diluted with distilled water 5.0˚ ± 0.1˚ brix; yeast extract 10 g·L−1, peptone 10 g·L−1) (Nobre 2005). The antagonistic strain was a Pseudomonas aeruginosa LV strain isolated from citrus canker lesions in orange [17]. The microbial community in the vat during wine fer- mentation process was determined and the Lactobacillus sp. was the most representative population around 90% of the bacterial community. Five strains of Lactobacillus sp. and one of S. cerevisiae were most representative bacteria were isolated, selected and criopreserved with glycerol solution 20% in liquid nitrogen. 2.2. Production, Purification and Fractioned of Secondary Metabolites with Antibiotic Activity The production, extraction and obtation of fractions with antibiotics compounds was realized the according to [14] which method was patented [18]. After treat the super- natant with dichloromethane, the phase obtained was treated with six different solvents with different polarity resulting in six different fractions as following (v/v): hexane (100; F1), dichloromethane (100; F2), ethyl ace- tate (100; F3), methanol (100; F4), methanol: water (1:1; F5) and water (100; F6).The six fractions was used in the next tests. 2.3. Thin Layer Chromatography (TLC) The TLC was used as qualitative analysis of fractions obtained during vacuum liquid chromatography fraction- ated with different liquid phases using solvents with dif- ferent polarity. The TLC was carried out using chro- matoplates of silica gel 60 F254 (Merck) fixed in alumi- num support. The eluent system (mobile phase) used was a mix of chloroform/acetone/methanol. The spots ob- tained was revealed by the exposition of UV light in two different wavelength (λ = 254 nm and 366 nm). 2.4. TLC Bioautography After done the TLC of DP, the antibiotic activity of spots present on chromatoplates was checked. The spots cor- responding to all fractions obtained from DP. The chro- matoplates was left in Petri dishes and covered with MCC agar plus cells suspensions of Lactobacillus sp. (108 CFU mL−1, D.O 0.14, λ = 590 nm) or S. cereviseae (108 CFU mL−1, D.O 0.22, λ = 590 nm) by pour plate tech- nique (Rahalison et al. 1991). After inoculation, the Petri dishes were incubated at 32˚C per 24 h, and the result was evaluated by presence or absence of inhibition halo formed around the spot after revealed with de 2, 3, 5-triphenil-1H-tetrazolium chloride (TTC) 1%. The re- Copyright © 2013 SciRes. JSBS 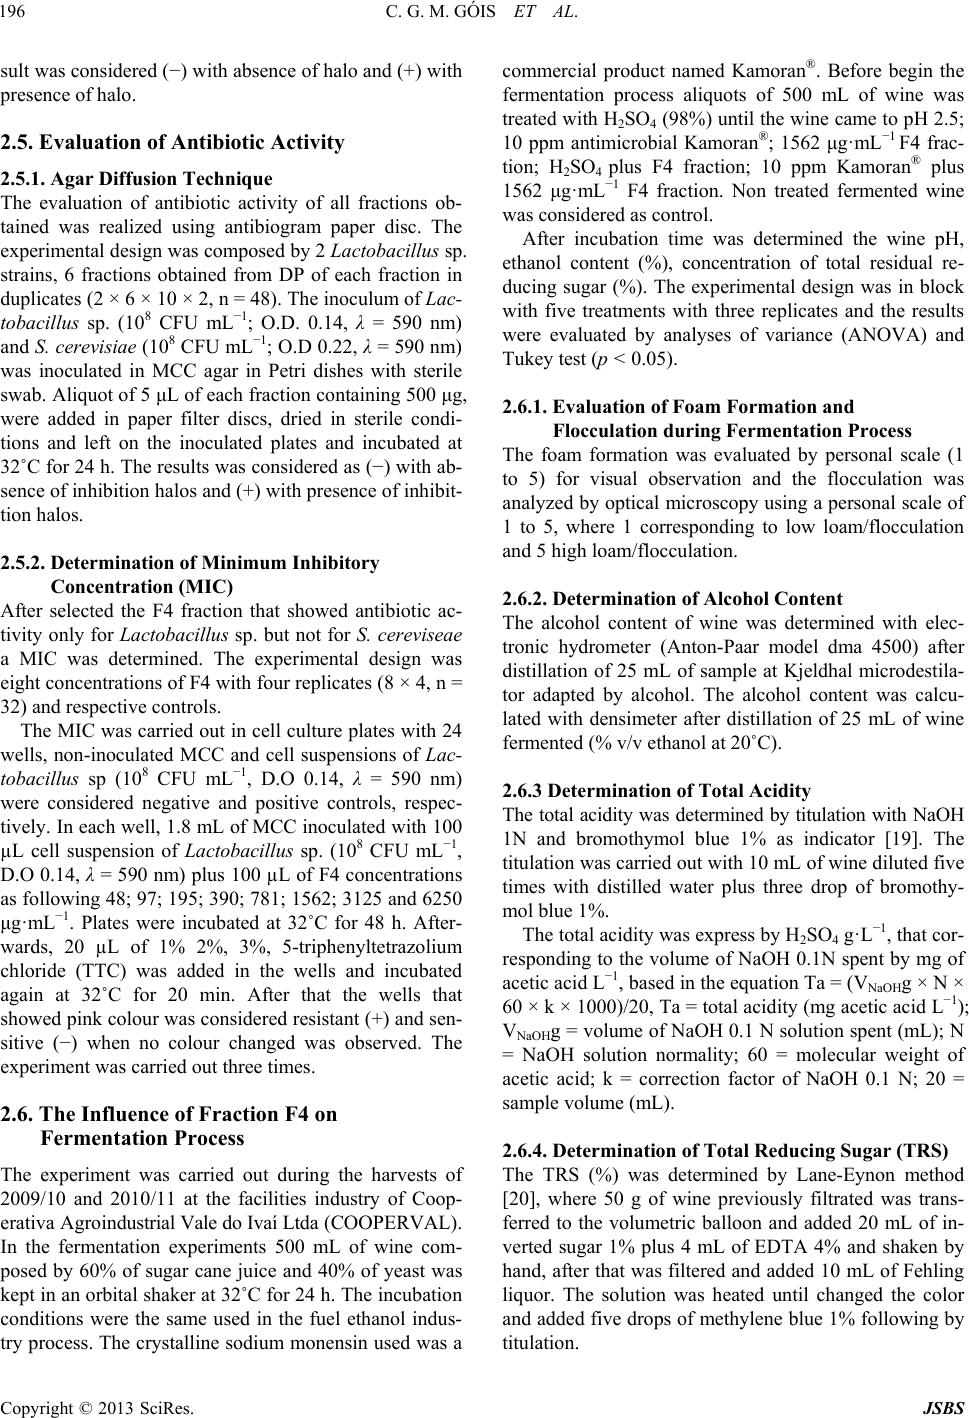 C. G. M. GÓIS ET AL. 196 sult was considered (−) with absence of halo and (+) with presence of halo. 2.5. Evaluation of Antibiotic Activity 2.5.1. Agar Diffusion Technique The evaluation of antibiotic activity of all fractions ob- tained was realized using antibiogram paper disc. The experimental design was composed by 2 Lactobacillus sp. strains, 6 fractions obtained from DP of each fraction in duplicates (2 × 6 × 10 × 2, n = 48). The inoculum of Lac- tobacillus sp. (108 CFU mL−1; O.D. 0.14, λ = 590 nm) and S. cerevisiae (108 CFU mL−1; O.D 0.22, λ = 590 nm) was inoculated in MCC agar in Petri dishes with sterile swab. Aliquot of 5 μL of each fraction containing 500 μg, were added in paper filter discs, dried in sterile condi- tions and left on the inoculated plates and incubated at 32˚C for 24 h. The results was considered as (−) with ab- sence of inhibition halos and (+) with presence of inhibit- tion halos. 2.5.2. Determination of Minimum Inhibitory Concentration (MIC) After selected the F4 fraction that showed antibiotic ac- tivity only for Lactobacillu s sp. but not for S. cereviseae a MIC was determined. The experimental design was eight concentrations of F4 with four replicates (8 × 4, n = 32) and respective controls. The MIC was carried out in cell culture plates with 24 wells, non-inoculated MCC and cell suspensions of Lac- tobacillus sp (108 CFU mL−1, D.O 0.14, λ = 590 nm) were considered negative and positive controls, respec- tively. In each well, 1.8 mL of MCC inoculated with 100 µL cell suspension of Lactobacillus sp. (108 CFU mL−1, D.O 0.14, λ = 590 nm) plus 100 µL of F4 concentrations as following 48; 97; 195; 390; 781; 1562; 3125 and 6250 μg·mL−1. Plates were incubated at 32˚C for 48 h. After- wards, 20 µL of 1% 2%, 3%, 5-triphenyltetrazolium chloride (TTC) was added in the wells and incubated again at 32˚C for 20 min. After that the wells that showed pink colour was considered resistant (+) and sen- sitive (−) when no colour changed was observed. The experiment was carried out three times. 2.6. The Influence of Fraction F4 on Fermentation Process The experiment was carried out during the harvests of 2009/10 and 2010/11 at the facilities industry of Coop- erativa Agroindustrial Vale do Ivaí Ltda (COOPERVAL). In the fermentation experiments 500 mL of wine com- posed by 60% of sugar cane juice and 40% of yeast was kept in an orbital shaker at 32˚C for 24 h. The incubation conditions were the same used in the fuel ethanol indus- try process. The crystalline sodium monensin used was a commercial product named Kamoran®. Before begin the fermentation process aliquots of 500 mL of wine was treated with H2SO4 (98%) until the wine came to pH 2.5; 10 ppm antimicrobial Kamoran®; 1562 μg·mL−1 F4 frac- tion; H2SO4 plus F4 fraction; 10 ppm Kamoran® plus 1562 μg·mL−1 F4 fraction. Non treated fermented wine was considered as control. After incubation time was determined the wine pH, ethanol content (%), concentration of total residual re- ducing sugar (%). The experimental design was in block with five treatments with three replicates and the results were evaluated by analyses of variance (ANOVA) and Tukey test (p < 0.05). 2.6.1. Evaluation of Foam Formation and Flocculation during Fermentation Process The foam formation was evaluated by personal scale (1 to 5) for visual observation and the flocculation was analyzed by optical microscopy using a personal scale of 1 to 5, where 1 corresponding to low loam/flocculation and 5 high loam/flocculation. 2.6.2. Determination of Alcohol Content The alcohol content of wine was determined with elec- tronic hydrometer (Anton-Paar model dma 4500) after distillation of 25 mL of sample at Kjeldhal microdestila- tor adapted by alcohol. The alcohol content was calcu- lated with densimeter after distillation of 25 mL of wine fermented (% v/v ethanol at 20˚C). 2.6.3 Determination of Total Acidity The total acidity was determined by titulation with NaOH 1N and bromothymol blue 1% as indicator [19]. The titulation was carried out with 10 mL of wine diluted five times with distilled water plus three drop of bromothy- mol blue 1%. The total acidity was express by H2SO4 g·L−1, that cor- responding to the volume of NaOH 0.1N spent by mg of acetic acid L−1, based in the equation Ta = (VNaOHg × N × 60 × k × 1000)/20, Ta = total acidity (mg acetic acid L−1); VNaOHg = volume of NaOH 0.1 N solution spent (mL); N = NaOH solution normality; 60 = molecular weight of acetic acid; k = correction factor of NaOH 0.1 N; 20 = sample volume (mL). 2.6.4. Determination of Total Reducing Sugar (TRS) The TRS (%) was determined by Lane-Eynon method [20], where 50 g of wine previously filtrated was trans- ferred to the volumetric balloon and added 20 mL of in- verted sugar 1% plus 4 mL of EDTA 4% and shaken by hand, after that was filtered and added 10 mL of Fehling liquor. The solution was heated until changed the color and added five drops of methylene blue 1% following by titulation. Copyright © 2013 SciRes. JSBS  C. G. M. GÓIS ET AL. 197 2.7. Microbial Analysis 2.7.1. Cellular Viability of Saccharomyces cerevisiae After finished the fermentative cycling, the cellular vi- ability of S. cerevisae (%) was determined in aliquots of 0.2 mL of wine plus erythrosine diluted in phosphate buffer in a Neübauer camera observed in microscope 400×. The cellular viability was express by the ratio be- tween viable and unviable cells [21]. Also were evalu- ated budding rate, cell number and viability of S. cere- visae (UFC. mL−1). The budding tax was estimated by the ratio between vi- able cell and bud numbers. The viability of budding was determined by the ratio of number of viable bud and num- ber of viable plus unviable bud. All evaluation was car- ried out with five replicates. The results were evaluated by analyses of variance (ANOVA) and Tukey test (p < 0.05). 2.7.2. Lactobacillus sp. Population Evaluation The number of colony forming units (CFU mL−1) was estimated by serial dilution 1:10 by pour plate method [22] in Petri dishes with MCC agar. Each sample was diluted of 10−1 to 10−9 and 50 μL was mixed with MCC agar in melt point and incubated at 32˚C for 24 h. All dilutions of samples were in three replicates. The results were expressed by CFU mL−1 and were evaluated by analyses of variance (ANOVA) and Tukey test (p < 0.05). 3. Results 3.1. Evaluation of Antibiotic Activity The DP and all six fractions obtained was evaluated the antibiotic activity (500 µg·mL−1) by agar diffusion using paper filter disc that showed different effect on Lactoba- cillus sp and S. cerevisiae. Six fractions obtained from DP, only F3 and F4 showing antibiotic activity against Lactobacillus sp. and no effect was observed by F1, F2, F5 and F6. However, F4 showed selective effect inhibit- ing only Lactobacillus sp. growth and did not show any effect against S. cerevisiae (Table 1). In TLC the antibiotic activity observed in the spot corresponding to DP and F4 for Lactobacillus sp. and DP and F3 for S. cerevisiae. The MIC of F4 was 1562 μg·mL−1 for Lactobacillus sp. and sample of all wells of plates that showed no growth was plated in MCC agar in Petri dishes and incubated at 32˚C for 24 h and no colo- nies was observed in any concentration up to the MIC, indicating that F4 showed bactericidal effect. In all con- centrations was observed S. cerevisiae growth. 3.2. The Influence of Fraction F4 on Fermentation Process In the non-treated wine, the foam formation was very high as well as in the wine treated with H2SO4 and KM. The wine treated with F4 fraction did not formed foam even when combined with KM, on the other hand the F4 plus HS a foam formation was low (Table 2). The wine treated with F4 and KM + F4 showed low flocculation during the final of fermentative process with level 1. All of those treatments showed high flocculation level among 3 and 5 except for F4 (Table 2). No differ- ences were observed in the e pH of wine for all treat- ments except when was added H2SO4 that the pH de- creased significantly. The addition of H2SO4 increased total acidity when compared with KM, F4 and control (Figure 1(a)). The F4 fraction and KM + F4, showed significant dif- ferences on ethanol production when compared with control and wine treated with HS plus or not F4 (Figure 1(b)). The total reducing sugar no differences was ob- served except for KM + F4 that decreased the amount in the wine (Figure 1(c)). 3.3. Microbial Analysis In all treatments including control was observed high cellular viability of S. cerevisiae that was more than 75% (Figure 2(a)). Table 1. Evaluation of antibiotic activity of dichlorometane phase (DP) and fraction purified by vaccum liquid chro- mathography using six mobile phase with differents polar- ity (F1, 100% hexane; F2, dichlorometane 100%; F3 ethyl acetate 100%; F4, methanol 100%; F5 methanol/water (1:1, v/v) e F6, water 100%), against Lactobacillus sp. and Sac- charomyces cer evisiae. DPF1 F2 F3 F4 F5 F6 Lactobacillus sp.+ − − + + − − S. cerevisiae + − − + − − − (−) Absence of halo; (+) Presence of halo; C Control. Table 2. Foam and floculation formation in the wine after fermentation process (32˚C per 6 h) treated with sulphuric acid 98% (HS); Kamoran® 10 ppm (KM), F4 fraction 1562 μg·mL−1 (F4); HS 98% + KM 10 ppm, KM 10 ppm + F4 1562 μg·mL−1. The numbers corresponding to: none (1); low (2); medium (3); high (4); very high (5). Treatments Foam Floculation Controle 5 5 HS 5 3 KM 5 5 F4 1 1 HS + F4 3 5 KM + F4 1 1 Copyright © 2013 SciRes. JSBS 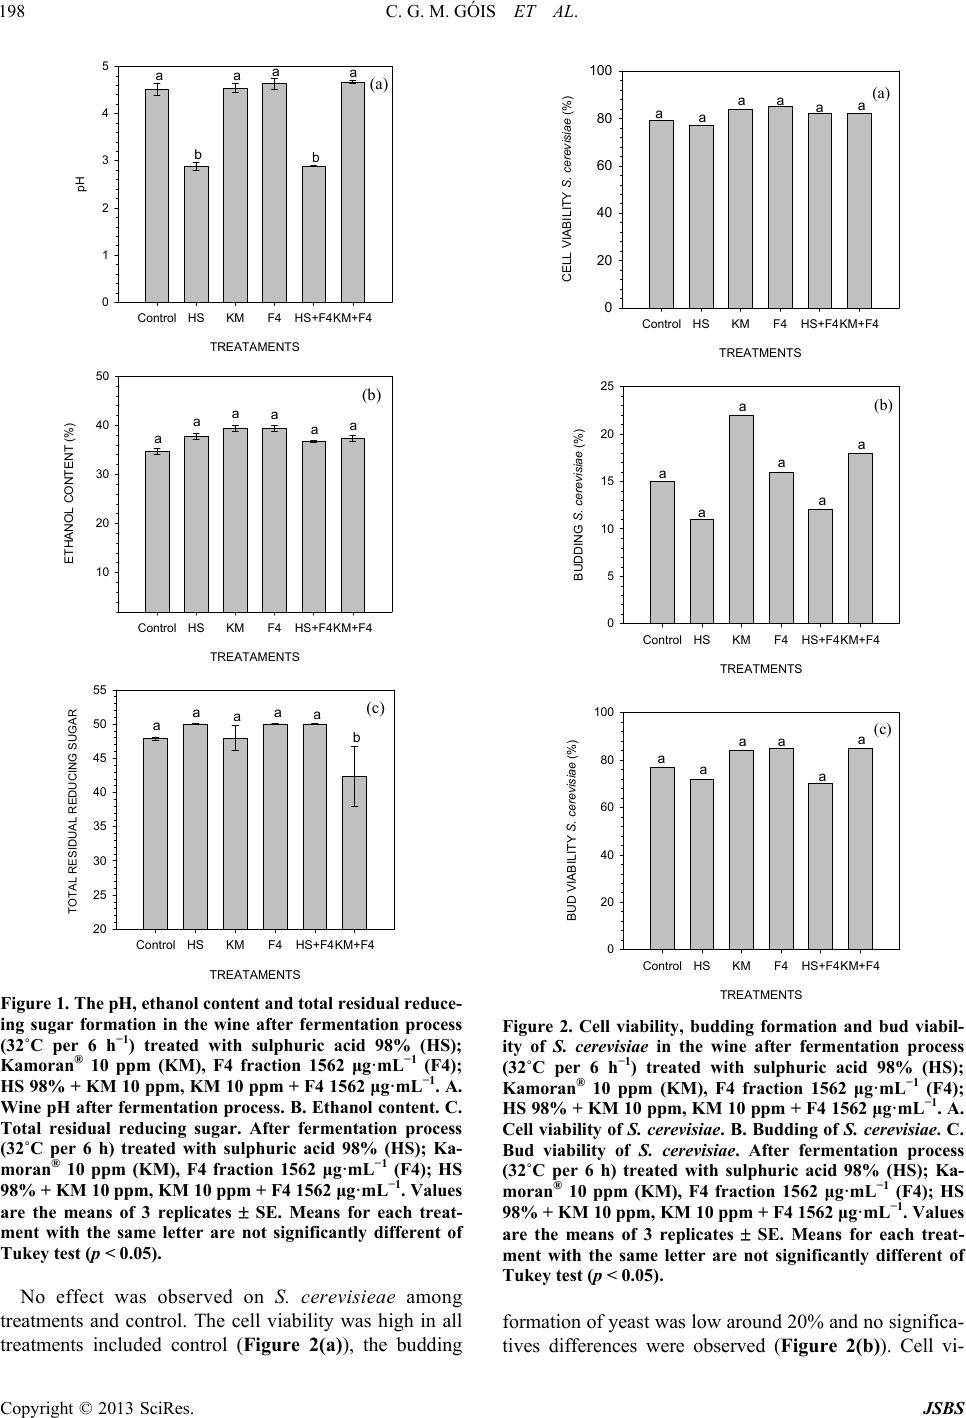 C. G. M. GÓIS ET AL. 198 TREATAME NTS Control HSKMF4HS+F4KM+F4 pH 0 1 2 3 4 5 aa b b aa A (a) TREATAMENTS Control HSKMF4HS+F4KM+F4 ETHANOL CONTENT (%) 10 20 30 40 50 aaaaaa B (b) TREATAMENTS Control HSKMF4HS+F4KM+F4 TOTAL RESIDUAL REDUCING SUGAR 20 25 30 35 40 45 50 55 aaaaa b C (c) Figure 1. The pH, ethanol content and total residual reduce- ing sugar formation in the wine after fermentation process (32˚C per 6 h−1) treated with sulphuric acid 98% (HS); Kamoran® 10 ppm (KM), F4 fraction 1562 μg·mL−1 (F4); HS 98% + KM 10 ppm, KM 10 ppm + F4 1562 μg·mL−1. A. Wine pH after fermentation process. B. Ethanol content. C. Total residual reducing sugar. After fermentation process (32˚C per 6 h) treated with sulphuric acid 98% (HS); Ka- moran® 10 ppm (KM), F4 fraction 1562 μg·mL−1 (F4); HS 98% + KM 10 ppm, KM 10 ppm + F4 1562 μg·mL−1. Values are the means of 3 replicates SE. Means for each treat- ment with the same letter are not significantly different of Tukey test (p < 0.05). No effect was observed on S. cerevisieae among treatments and control. The cell viability was high in all treatments included control (Figure 2(a)), the budding TREATMENTS Control HSKMF4HS+F4KM+F4 CELL VIABILITY S. cerevisiae (%) 0 20 40 60 80 100 aaaaaa A TREATMENTS Control HSKMF4HS+F4KM+F4 BUDDING S. cerevisiae (%) 0 5 10 15 20 25 a a a a a a B TREATMENTS Control HSKMF4HS+F4KM+F4 BUD VIABILITY S. cerevisiae (%) 0 20 40 60 80 100 aa aa a a C (a) (b) (c) Figure 2. Cell viability, budding formation and bud viabil- ity of S. cerevisiae in the wine after fermentation process (32˚C per 6 h−1) treated with sulphuric acid 98% (HS); Kamoran® 10 ppm (KM), F4 fraction 1562 μg·mL−1 (F4); HS 98% + KM 10 ppm, KM 10 ppm + F4 1562 μg·mL−1. A. Cell viability of S. cerevisiae. B. Budding of S. cerevisiae. C. Bud viability of S. cerevisiae. After fermentation process (32˚C per 6 h) treated with sulphuric acid 98% (HS); Ka- moran® 10 ppm (KM), F4 fraction 1562 μg·mL−1 (F4); HS 98% + KM 10 ppm, KM 10 ppm + F4 1562 μg·mL−1. Values are the means of 3 replicates SE. Means for each treat- ment with the same letter are not significantly different of Tukey test (p < 0.05). formation of yeast was low around 20% and no significa- tives differences were observed (Figure 2(b)). Cell vi- Copyright © 2013 SciRes. JSBS 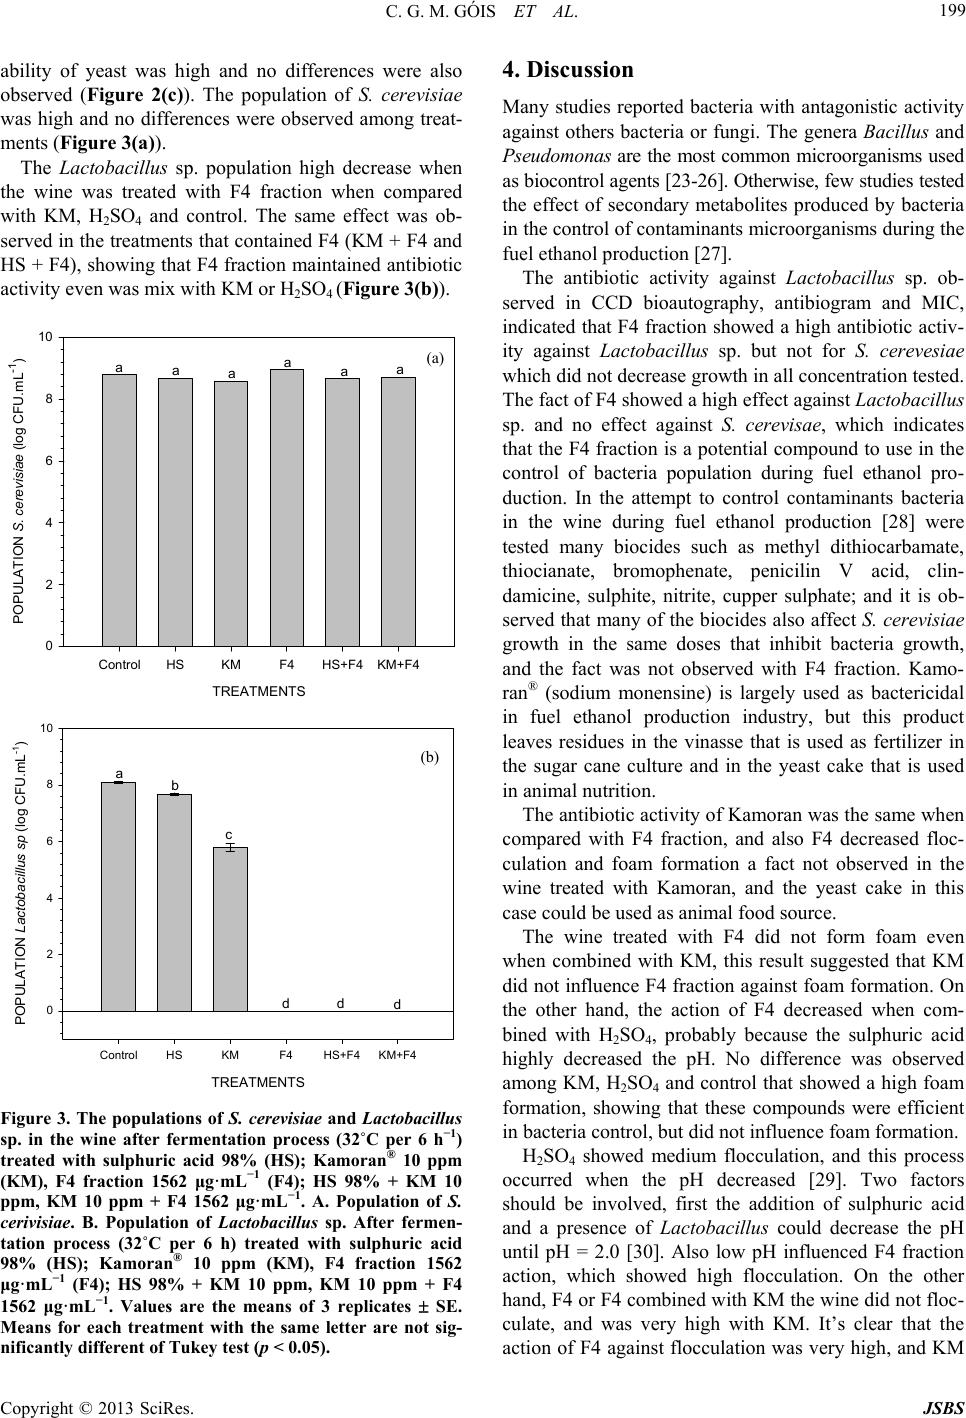 C. G. M. GÓIS ET AL. 199 ability of yeast was high and no differences were also observed (Figure 2(c)). The population of S. cerevisiae was high and no differences were observed among treat- ments (Figure 3(a)). The Lactobacillus sp. population high decrease when the wine was treated with F4 fraction when compared with KM, H2SO4 and control. The same effect was ob- served in the treatments that contained F4 (KM + F4 and HS + F4), showing that F4 fraction maintained antibiotic activity even was mix with KM or H2SO4 (Figure 3(b)). TREATMENTS ControlHSKMF4HS+F4 KM+F4 POPULATION S. cerevisiae (log CFU.mL -1 ) 0 2 4 6 8 10 aaaaaaA (a) TREATMENTS ControlHSKMF4HS+F4 KM+F4 POPULATION Lactobacillus sp (log CFU.mL -1 ) 0 2 4 6 8 10 ab c ddd B (b) Figure 3. The populations of S. cerevisiae and Lactobacillus sp. in the wine after fermentation process (32˚C per 6 h−1) treated with sulphuric acid 98% (HS); Kamoran® 10 ppm (KM), F4 fraction 1562 μg·mL−1 (F4); HS 98% + KM 10 ppm, KM 10 ppm + F4 1562 μg·mL−1. A. Population of S. cerivisiae. B. Population of Lactobacillus sp. After fermen- tation process (32˚C per 6 h) treated with sulphuric acid 98% (HS); Kamoran® 10 ppm (KM), F4 fraction 1562 μg·mL−1 (F4); HS 98% + KM 10 ppm, KM 10 ppm + F4 1562 μg·mL−1. Values are the means of 3 replicates SE. Means for each treatment with the same letter are not sig- nificantly different of Tukey test (p < 0.05). 4. Discussion Many studies reported bacteria with antagonistic activity against others bacteria or fungi. The genera Bacillus and Pseudomonas are the most common microorganisms used as biocontrol agents [23-26]. Otherwise, few studies tested the effect of secondary metabolites produced by bacteria in the control of contaminants microorganisms during the fuel ethanol production [27]. The antibiotic activity against Lactoba cillus sp. ob- served in CCD bioautography, antibiogram and MIC, indicated that F4 fraction showed a high antibiotic activ- ity against Lactobacillu s sp. but not for S. cerevesiae which did not decrease growth in all concentration tested. The fact of F4 showed a high effect against Lactobacillus sp. and no effect against S. cerevisae, which indicates that the F4 fraction is a potential compound to use in the control of bacteria population during fuel ethanol pro- duction. In the attempt to control contaminants bacteria in the wine during fuel ethanol production [28] were tested many biocides such as methyl dithiocarbamate, thiocianate, bromophenate, penicilin V acid, clin- damicine, sulphite, nitrite, cupper sulphate; and it is ob- served that many of the biocides also affect S. cerevisiae growth in the same doses that inhibit bacteria growth, and the fact was not observed with F4 fraction. Kamo- ran® (sodium monensine) is largely used as bactericidal in fuel ethanol production industry, but this product leaves residues in the vinasse that is used as fertilizer in the sugar cane culture and in the yeast cake that is used in animal nutrition. The antibiotic activity of Kamoran was the same when compared with F4 fraction, and also F4 decreased floc- culation and foam formation a fact not observed in the wine treated with Kamoran, and the yeast cake in this case could be used as animal food source. The wine treated with F4 did not form foam even when combined with KM, this result suggested that KM did not influence F4 fraction against foam formation. On the other hand, the action of F4 decreased when com- bined with H2SO4, probably because the sulphuric acid highly decreased the pH. No difference was observed among KM, H2SO4 and control that showed a high foam formation, showing that these compounds were efficient in bacteria control, but did not influence foam formation. H2SO4 showed medium flocculation, and this process occurred when the pH decreased [29]. Two factors should be involved, first the addition of sulphuric acid and a presence of Lactobacillus could decrease the pH until pH = 2.0 [30]. Also low pH influenced F4 fraction action, which showed high flocculation. On the other hand, F4 or F4 combined with KM the wine did not floc- culate, and was very high with KM. It’s clear that the action of F4 against flocculation was very high, and KM Copyright © 2013 SciRes. JSBS 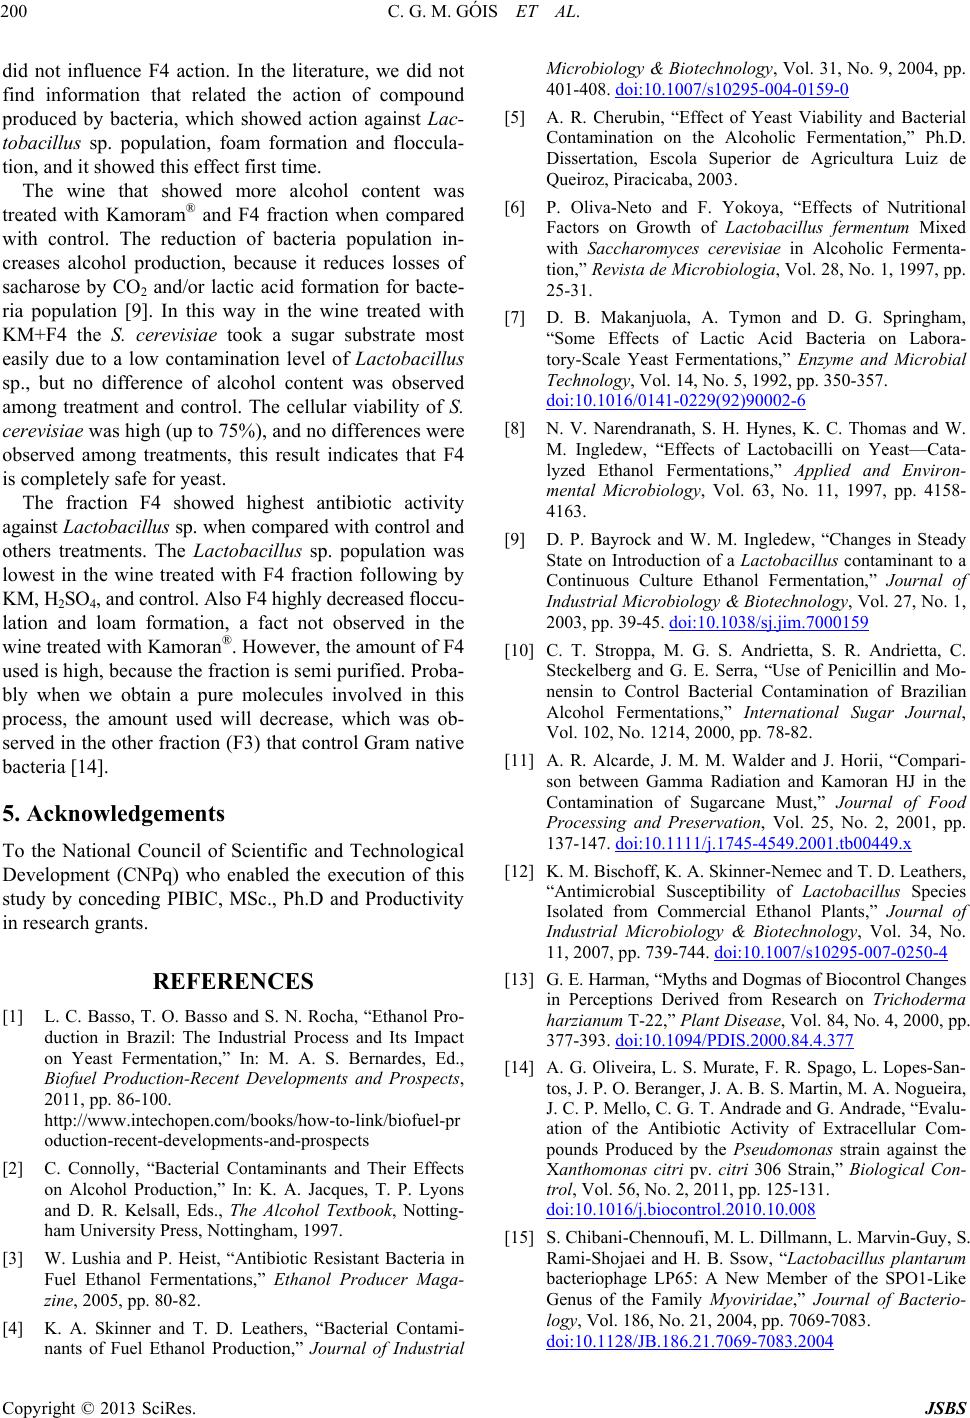 C. G. M. GÓIS ET AL. 200 did not influence F4 action. In the literature, we did not find information that related the action of compound produced by bacteria, which showed action against Lac- tobacillus sp. population, foam formation and floccula- tion, and it showed this effect first time. The wine that showed more alcohol content was treated with Kamoram® and F4 fraction when compared with control. The reduction of bacteria population in- creases alcohol production, because it reduces losses of sacharose by CO2 and/or lactic acid formation for bacte- ria population [9]. In this way in the wine treated with KM+F4 the S. cerevisiae took a sugar substrate most easily due to a low contamination level of Lactobacillus sp., but no difference of alcohol content was observed among treatment and control. The cellular viability of S. cerevisiae was high (up to 75%), and no differences were observed among treatments, this result indicates that F4 is completely safe for yeast. The fraction F4 showed highest antibiotic activity against Lactobacillus sp. when compared with control and others treatments. The Lactobacillus sp. population was lowest in the wine treated with F4 fraction following by KM, H2SO4, and control. Also F4 highly decreased floccu- lation and loam formation, a fact not observed in the wine treated with Kamoran®. However, the amount of F4 used is high, because the fraction is semi purified. Proba- bly when we obtain a pure molecules involved in this process, the amount used will decrease, which was ob- served in the other fraction (F3) that control Gram native bacteria [14]. 5. Acknowledgements To the National Council of Scientific and Technological Development (CNPq) who enabled the execution of this study by conceding PIBIC, MSc., Ph.D and Productivity in research grants. REFERENCES [1] L. C. Basso, T. O. Basso and S. N. Rocha, “Ethanol Pro- duction in Brazil: The Industrial Process and Its Impact on Yeast Fermentation,” In: M. A. S. Bernardes, Ed., Biofuel Production-Recent Developments and Prospects, 2011, pp. 86-100. http://www.intechopen.com/books/how-to-link/biofuel-pr oduction-recent-developments-and-prospects [2] C. Connolly, “Bacterial Contaminants and Their Effects on Alcohol Production,” In: K. A. Jacques, T. P. Lyons and D. R. Kelsall, Eds., The Alcohol Textbook, Notting- ham University Press, Nottingham, 1997. [3] W. Lushia and P. Heist, “Antibiotic Resistant Bacteria in Fuel Ethanol Fermentations,” Ethanol Producer Maga- zine, 2005, pp. 80-82. [4] K. A. Skinner and T. D. Leathers, “Bacterial Contami- nants of Fuel Ethanol Production,” Journal of Industrial Microbiology & Biotechnology, Vol. 31, No. 9, 2004, pp. 401-408. doi:10.1007/s10295-004-0159-0 [5] A. R. Cherubin, “Effect of Yeast Viability and Bacterial Contamination on the Alcoholic Fermentation,” Ph.D. Dissertation, Escola Superior de Agricultura Luiz de Queiroz, Piracicaba, 2003. [6] P. Oliva-Neto and F. Yokoya, “Effects of Nutritional Factors on Growth of Lactobacillus fermentum Mixed with Saccharomyces cerevisiae in Alcoholic Fermenta- tion,” Revista de Microbiologia, Vol. 28, No. 1, 1997, pp. 25-31. [7] D. B. Makanjuola, A. Tymon and D. G. Springham, “Some Effects of Lactic Acid Bacteria on Labora- tory-Scale Yeast Fermentations,” Enzyme and Microbial Technology, Vol. 14, No. 5, 1992, pp. 350-357. doi:10.1016/0141-0229(92)90002-6 [8] N. V. Narendranath, S. H. Hynes, K. C. Thomas and W. M. Ingledew, “Effects of Lactobacilli on Yeast—Cata- lyzed Ethanol Fermentations,” Applied and Environ- mental Microbiology, Vol. 63, No. 11, 1997, pp. 4158- 4163. [9] D. P. Bayrock and W. M. Ingledew, “Changes in Steady State on Introduction of a Lactobacillus contaminant to a Continuous Culture Ethanol Fermentation,” Journal of Industrial Microbiology & Biotechnology, Vol. 27, No. 1, 2003, pp. 39-45. doi:10.1038/sj.jim.7000159 [10] C. T. Stroppa, M. G. S. Andrietta, S. R. Andrietta, C. Steckelberg and G. E. Serra, “Use of Penicillin and Mo- nensin to Control Bacterial Contamination of Brazilian Alcohol Fermentations,” International Sugar Journal, Vol. 102, No. 1214, 2000, pp. 78-82. [11] A. R. Alcarde, J. M. M. Walder and J. Horii, “Compari- son between Gamma Radiation and Kamoran HJ in the Contamination of Sugarcane Must,” Journal of Food Processing and Preservation, Vol. 25, No. 2, 2001, pp. 137-147. doi:10.1111/j.1745-4549.2001.tb00449.x [12] K. M. Bischoff, K. A. Skinner-Nemec and T. D. Leathers, “Antimicrobial Susceptibility of Lactobacillus Species Isolated from Commercial Ethanol Plants,” Journal of Industrial Microbiology & Biotechnology, Vol. 34, No. 11, 2007, pp. 739-744. doi:10.1007/s10295-007-0250-4 [13] G. E. Harman, “Myths and Dogmas of Biocontrol Changes in Perceptions Derived from Research on Trichoderma harzianum T-22,” Plant Disease, Vol. 84, No. 4, 2000, pp. 377-393. doi:10.1094/PDIS.2000.84.4.377 [14] A. G. Oliveira, L. S. Murate, F. R. Spago, L. Lopes-San- tos, J. P. O. Beranger, J. A. B. S. Martin, M. A. Nogueira, J. C. P. Mello, C. G. T. Andrade and G. Andrade, “Evalu- ation of the Antibiotic Activity of Extracellular Com- pounds Produced by the Pseudomonas strain against the Xanthomonas citri pv. citri 306 Strain,” Biological Con- trol, Vol. 56, No. 2, 2011, pp. 125-131. doi:10.1016/j.biocontrol.2010.10.008 [15] S. Chibani-Chennoufi, M. L. Dillmann, L. Marvin-Guy, S. Rami-Shojaei and H. B. Ssow, “Lactobacillus plantarum bacteriophage LP65: A New Member of the SPO1-Like Genus of the Family Myoviridae,” Journal of Bacterio- logy, Vol. 186, No. 21, 2004, pp. 7069-7083. doi:10.1128/JB.186.21.7069-7083.2004 Copyright © 2013 SciRes. JSBS  C. G. M. GÓIS ET AL. Copyright © 2013 SciRes. JSBS 201 [16] V. Vinderola, M. M. Briggiler, D. Guglielmotti, G. Per- digón, G. Giraffa, J. Reinheimer and A. Quiberoni, “Phage Resistant Mutants of Lactobacillus delbrueckii May Have Functional Properties That Differ from Those of Parent Strains,” International Journal of Food Micro- biology, Vol. 116, No. 1, 2007, pp. 96-102. doi:10.1016/j.ijfoodmicro.2006.12.029 [17] L. G. L. Rampazo, “Evaluation of the Effect of Biological Agents and Their Products into the Incidence of Citrus Canker Lesions,” Master Dissertation, Universidade Estadual de Londrina, Londrina, 2004. [18] “Process of Production, Purification and Obtation of Sub- stances with Antibiotic Activity on the Control of Disease Caused by Bacteria in Plant,” Patent, 2010-PI 0803350-1, 2008. www.inpi.gov.br [19] M. A. Amerine and C. S. Ough, “Análisis de Vinos y Mostos,” Editorial Acribia, Zaragoza, 1976. [20] J. H. L. L. Eynon, “Determination of Reducing Sugars by Fehling’s Solution with Methylene Blue Indicator,” Nor- man Rodger, London, 1934, p. 8. [21] M. Bonneu, M. Crouzet, M. Urdaci and M. Aigle, “Direct Selection of Yeast Mutants with Reduced Viability on Plates by Erythrosine B Staining,” Analytical Biochemis- try, Vol. 193, No. 2, 1991, pp. 225-230. doi:10.1016/0003-2697(91)90013-J [22] R. N. Neder, “Microbiologia: Manual de Laboratório,” Nobel, São Paulo, 1992, p. 138. [23] T. P. Nobre, J. Horii and R. Alcarde, “Viabilidade Celular de Saccharomyces cerevisiae Cultivada em Associação Com Bactérias Contaminantes da Fermentação Alcoólica,” Ciência e Tecnologia de Alimentos, Vol. 27, 2007, pp. 20-25. doi:10.1590/S0101-20612007000100004 [24] J. M. Byrne, A. C. Dianese, P. Jia, H. L. Campbell, D. A. Cuppels, F. J. Louws, S. A. Miller, J. B. Jones and M. Wilson, “Biological Control of Bacterial Spot of Tomato under Weld Conditions at Several Locations in North America,” Biological Control, Vol. 32, No. 3, 2005, pp. 408-418. doi:10.1016/j.biocontrol.2004.12.001 [25] R. G. Mafia, A. C. Alfenas, L. A. Maffia, E. M. Ferreira, D. H. B. Binoti and G. M. V. Mafia, “Plant Growth Pro- moting Rhizobacteria as Agents in the Biocontrol of Eucalyptus Mini-Cutting Root,” Tropical Plant Patho- logy, Vol. 34, No. 1, 2009, pp. 10-17. doi:10.1590/S1982-56762009000100002 [26] F. Lemessa, and W. Zeller, “Screening Rhizobacteria for Biological Control of Ralstonia solanacearum in Ethio- pia,” Biological Control, Vol. 42, No. 3, 2007, pp. 336- 344. doi:10.1016/j.biocontrol.2007.05.014 [27] S. Todorova and L. Kozhuharova, “Characteristics and Antimicrobial Activity of Bacillus subtilis Strains Iso- lated from Soil,” World Journal of Microbiology and Biotechnology, Vol. 26, No. 7, 2010, pp. 1207-1216. doi:10.1007/s11274-009-0290-1 [28] J. Peng, L. Zhang, Z.-H. Gu, Z.-Y. Ding and G.-Y. Shi, “The Role of Nisin in Fuel Ethanol Production with Sac- charomyces cerevisiae,” Letters in Applied Microbiology, Vol. 55, No. 2, 2012, pp. 128-134. doi:10.1111/j.1472-765X.2012.03275.x [29] P. Oliva-Neto and F. Yokoya, “Susceptibility of Sac- charomyces cerevisiae and Lactic Acid Bacteria from the Alcohol Industry to Several Antimicrobial Compounds,” Brazilian Journal of Microbiology, Vol. 32, No. 1, 2001, pp. 10-14. doi:10.1590/S1517-83822001000100003 [30] G. B. Calleja, “Cell Aggregation,” In: A. H. Rose and J. S. Harrison, Eds., The Yeasts, Academic Press, London, 1987, pp. 165-237.
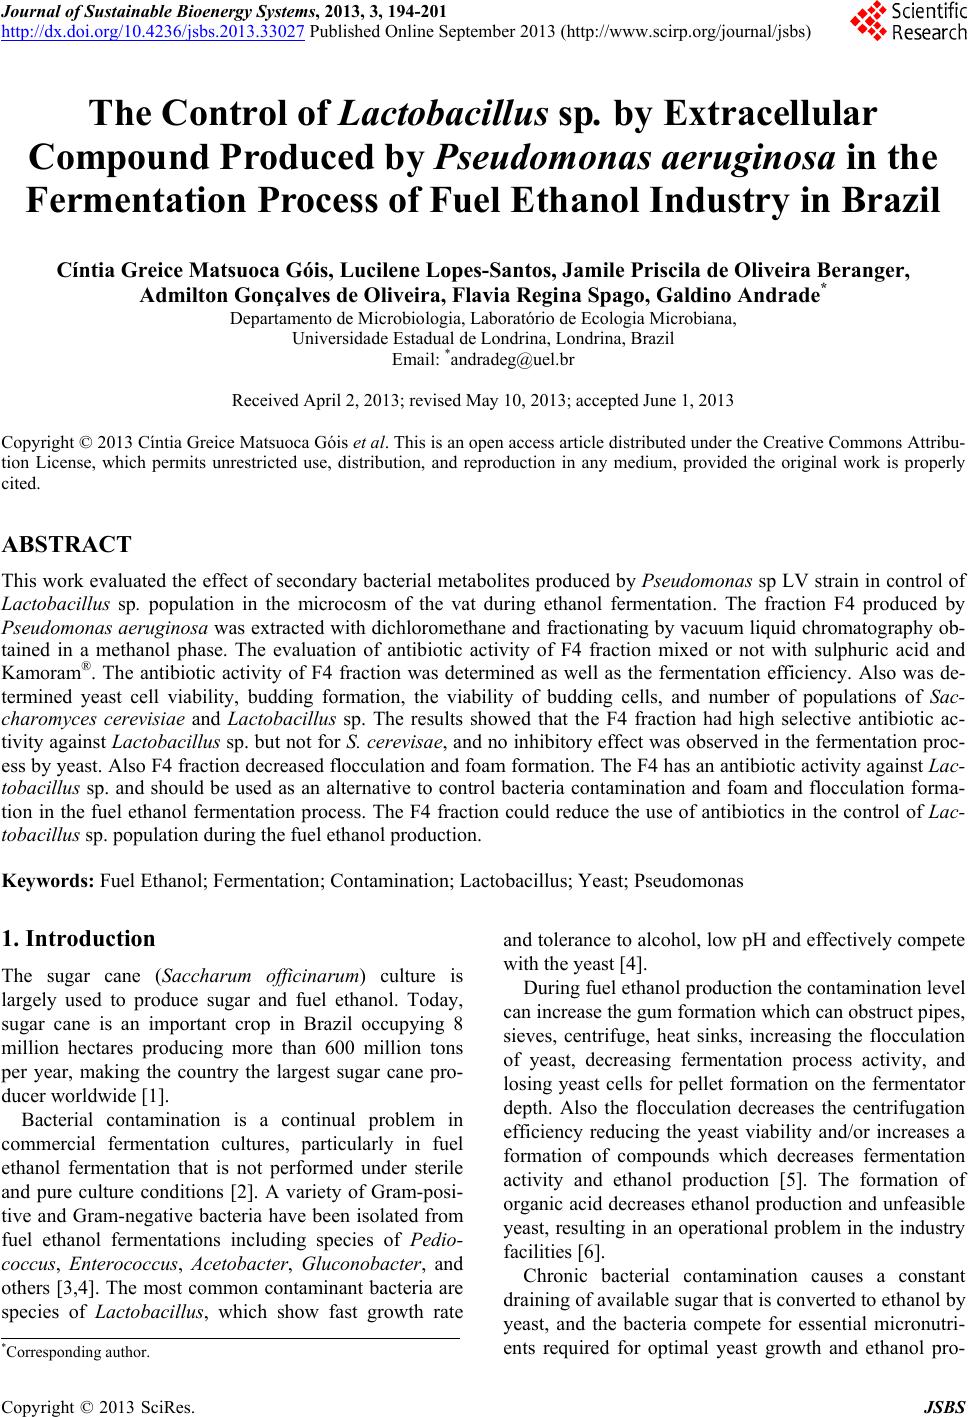
|