Paper Menu >>
Journal Menu >>
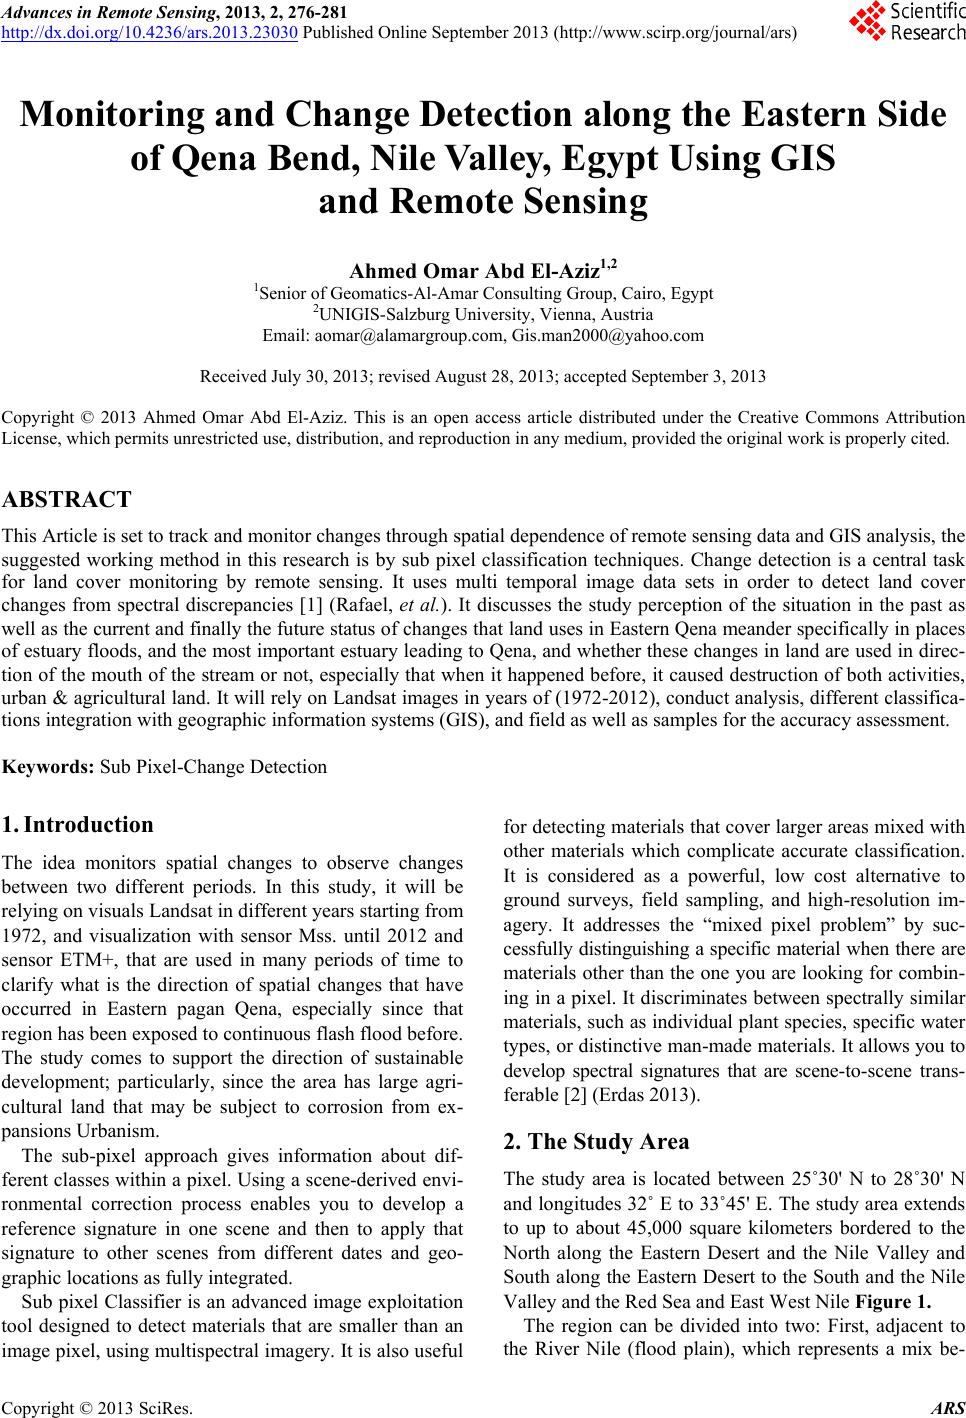 Advances in Remote Sensing, 2013, 2, 276-281 http://dx.doi.org/10.4236/ars.2013.23030 Published Online September 2013 (http://www.scirp.org/journal/ars) Monitoring and Change Detection along the Eastern Side of Qena Bend, Nile Valley, Egypt Using GIS and Remote Sensing Ahmed Omar Abd El-Aziz1,2 1Senior of Geomatics-Al-Amar Consulting Group, Cairo, Egypt 2UNIGIS-Salzburg University, Vienna, Austria Email: aomar@alamargroup.com, Gis.man2000@yahoo.com Received July 30, 2013; revised August 28, 2013; accepted September 3, 2013 Copyright © 2013 Ahmed Omar Abd El-Aziz. This is an open access article distributed under the Creative Commons Attribution License, which permits unrestricted use, distribution, and reproduction in any medium, provided the original work is properly cited. ABSTRACT This Article is set to track and monitor changes through spatial dependence of remote sensing data and GIS analysis, the suggested working method in this research is by sub pixel classification techniques. Change detection is a central task for land cover monitoring by remote sensing. It uses multi temporal image data sets in order to detect land cover changes from spectral discrepancies [1] (Rafael, et al.). It discusses the study perception of the situation in the past as well as the current and finally the future status of changes that land uses in Eastern Qena meander specifically in places of estuary floods, and the most important estuary leading to Qena, and whether these changes in land are used in direc- tion of the mouth of the stream or not, especially that when it happened before, it caused destruction of both activities, urban & agricultural land. It will rely on Landsat images in years of (1972-2012), conduct analysis, different classifica- tions integration with geographic information systems (GIS), and field as well as samples for the accuracy assessment. Keywords: Sub Pixel-Change Detection 1. Introduction The idea monitors spatial changes to observe changes between two different periods. In this study, it will be relying on visuals Landsat in different years starting from 1972, and visualization with sensor Mss. until 2012 and sensor ETM+, that are used in many periods of time to clarify what is the direction of spatial changes that have occurred in Eastern pagan Qena, especially since that region has been exposed to continuous flash flood before. The study comes to support the direction of sustainable development; particularly, since the area has large agri- cultural land that may be subject to corrosion from ex- pansions Urbanism. The sub-pixel approach gives information about dif- ferent classes within a pixel. Using a scene-derived envi- ronmental correction process enables you to develop a reference signature in one scene and then to apply that signature to other scenes from different dates and geo- graphic locations as fully integrated. Sub pixel Classifier is an advanced image exploitation tool designed to detect materials that are smaller than an image pixel, using multispectral imagery. It is also useful for detecting materials that cover larger areas mixed with other materials which complicate accurate classification. It is considered as a powerful, low cost alternative to ground surveys, field sampling, and high-resolution im- agery. It addresses the “mixed pixel problem” by suc- cessfully distinguishing a specific material when there are materials other than the one you are looking for combin- ing in a pixel. It discriminates between spectrally similar materials, such as individual plant species, specific water types, or distinctive man-made materials. It allows you to develop spectral signatures that are scene-to-scene trans- ferable [2] (Erdas 2013). 2. The Study Area The study area is located between 25˚30' N to 28˚30' N and longitudes 32˚ E to 33˚45' E. The study area extends to up to about 45,000 square kilometers bordered to the North along the Eastern Desert and the Nile Valley and South along the Eastern Desert to the South and the Nile Valley and the Red Sea and East West Nile Figure 1. The region can be divided into two: First, adjacent to the River Nile (flood plain), which represents a mix be- C opyright © 2013 SciRes. ARS  A. O. A. EL-AZIZ 277 tween green agricultural spaces as well as urban areas, inside large canals and drains that take water from the River Nile-scale. Second, adjacent to the scope of the first, a home in the band Desert and has set of valleys pour water for correspond to urban areas on the edge of the desert. Here the problem can be detected, in the first region, the change tracts of green areas (farmland), which exist on the River Nile across thousands of Sunnis turned into urban areas. In the second region, the trend of ex- pansion of urban areas towards valleys and estuaries, which sweep in front of everything. The changes will be studied by highlighting them on both sides to clarify the extent of the problem. 3. Methodology Based research methodology is using Sub pixel Classi- fication Method, one of the best ways that are monitored rating them on the level of a sub pixel which results ac- curate work and results [3]. Relying on image satellites of Landsat from the years of (1972 to 2013) Figure 2 with sensors (MSS-TM-ETM+-OLI) which gives an im- portant dimension, that the evolution of land uses in the study area and trends of increase or decrease in the land use and that the region matching with the east moun- tainous area. Represent the mouth of Valleys at the time of the floods. The above figure represents action steps and methodol- ogy. By using Finding other ways of classifications for com- parison and to reach the utmost precision [4,5], such as supervised classification and unsupervised classification were done. Over the years, which have studied them in addition to the calibration of these classifications using topographic maps covering the study area. Comparing the results of those categories with those of the method used in the search (sub pixel classification). Research also included the use of equation to derive water surfaces and com- Figure 1. Study area. Copyright © 2013 SciRes. ARS  A. O. A. EL-AZIZ 278 Figure 2. Change detection flow chart. paring them with those of other classification methods that relied-in the calculation of water surfaces and the equation-on Erdas program according to the following equation (0.5 × image name + (1 − 0.5) × image name × 22.958) as Figure 3. As well as the points that were monitored by GPS points for many areas within the area of study to compare the effect of the land use in the same places on the results of classification of work accuracy assessment [6]. 4. Remote Sensing Data Objectives of the study require knowledge of the ele- ments that have been reliable in the study in terms of di- mensions, and clearly show that both in the remote sens- ing data, as well as methods of use and analysis [7]. Depends on satellite data (a) with different stages as it is shown in Table 1. Classes To achieve the objectives of this study, there were three groups selected for rating; which are the use of urban land for urban area, cultivated area, and water surfaces represented in the River Nile including some of the side channels observed changes that have emerged in those places and trends of change. 5. Results and Discussion When we look at the change in land use in the study area, it is found that the change covers two important Figure 3. Extract water surface from land sat images. Table 1. Land sat data sources. Landsat satellite images information year sensorResolution Bands number satellite 1972 MSS 56 meter 4 bands Landsat 1,2,3 1984 TM 30 meter 7 bands Landsat 4,5 1998 ETM+14.25 meter 8 bands Landsat 7 2006 ETM+14.25 meter 8 bands Landsat 7 2013 JuneOLI 14.25 11 bands Landsat 8 aspects: what item has been changed and in which direction if we compare or note the difference. There are important elements which are the construction and cover agriculture that is changing from year to year depending Copyright © 2013 SciRes. ARS  A. O. A. EL-AZIZ 279 on the developments of the system of living. In the study area since the period following the construction of the High dam till now. It is through the Figure 4 can be observed extent of change between the two components regulars in the study area, and it seems stable, but now evolved Area Urban of up to 150 kilometers Km2, while decreased agricultural area to reach to 553 km, that is due to the increasing Crawl of Urban agricultural areas. In the past, there had been change, with the exception of the period from 1972 until 1984, the agricultural area increased by 64 km as a result of the construction of the High Dam and the evolution of the cultivated area and regularity of Agriculture in the study area. The second element, a trend changes and through the study illustrated the direction of those changes, and the expansion of tenderness urban and agricultural as it appears from the study of evolution in the land use of study area (Figure 5). This represents a serious indication in the study of the dangers of floods then that most of those moving expan- sions in the mouths of the valleys, making it vulnerable to drifting in the face of any flash flood occur, which is what happened in previous times where roads collapsed and sank agricultural land and displaced thousands of residents. Changes can be observed through the following forms for years (1972-1984-2005-2013). As these changes can be seen more clearly in the pe- riod between 1984 to 2005 in the East in the mouth of the valleys that pour from the east and north-east to the west as shown in Figure 6. Between 2005 to 2013, we find an increase in the development of human urban activity. More obvious than before, as in Figure 7. As appears from the previous the changes take varying proportions and different directions and show area changes (Figure 8). Figure 4. Land use of Qena eastern 1972. Figure 5. Land use of Qena ester between (1972-1984). Copyright © 2013 SciRes. ARS  A. O. A. EL-AZIZ 280 Risk lies in directions those changes to the east where mouths valleys especially the mouth of Wadi Qena and matulla Valley, which displays these developments Ur- ban mankind constantly dangerous when flash flood oc- curs. 6. Conclusions Decision-maker needed a clear vision for the dimensions of the current situation and the future planning when making the decision. Landsat data have been used in this study to discuss and follow up the changes in human activity from 1972 and until 2013 they has been proven its worth in the analysis and monitoring of changes through the style category and advanced sub pixel classi- fication through calibration of these data with more ac- curacy, compared with the situation in the field (GPS data). The study puts a warning and an indication of trends in changes of the need to address urban and agricultural development in the direction of the mouths of valleys Figure 6. Land use of Qena ester between (1984-2005). Figure 7. Land use of Qena ester between (2005-2013). Copyright © 2013 SciRes. ARS  A. O. A. EL-AZIZ 281 Figure 8. Land use changes in study area for urban and ed to sudden flash floods i REFERENCES [1] M. El Hajj, A.Hagolle, G. Dedieu, doi:10.3390/s8042774 ssifier™, 2013. /White_Papers/I r- t of Nile . Speck, D. Kulbach, H. Spitzer and J. c Change Detection for Road- Techniques Using agriculture ar ea. at are constantly exposthf we are going to talk about sustainable development to pre- serve the human activity of environmental disasters. Begue, B. Lafrance, O. and M. umeau, “Relative Radiometric Normalization and Atmospheric Orrection of a SPOT 5 Time Series,” Sen- sors, Vol. 8, 2008, pp. 2774-2791. [2] IMAGINE Subpixel Cla http://geospatial.intergraph.com/Libraries MAGINE_Subpixel_Classifier%E2%84%A2.sflb.ashx [3] M. Flanagan and D. L. Civco, “Subpixel Impervious Su face Mapping,” Proceedings of 2001 ASPRS Annual Convention, St. Louis, 23-27 April 2001, 13 p. [4] A. A. Haggag, “Soil Classification of North Coas Delta,” Doctoral Thesis, Mansoura University, Mansoura, 1994, 300 p. [5] R. Wiemker, A Bienlein, “Unsupervised Robust Change Detection in Multispectral Imagery Using Spectral and Spatial Fea- tures,” Proceedings of the 2nd International Airborne Remote Sensing Conference and Exhibition, San Fran- cisco, 1997, pp. 640-647. [6] H. G. Sui (2002) “Automati Networks Base on Features,” Ph.D. Dissertations, Wuhan University, Wuhan, in Chinese. [7] A. Singh, “Digital Change Detection Remotely Sensed Data,” International Journal of Remote Sensing, Vol. 10, No. 6, 1989, pp. 989-1003. Copyright © 2013 SciRes. ARS |