Paper Menu >>
Journal Menu >>
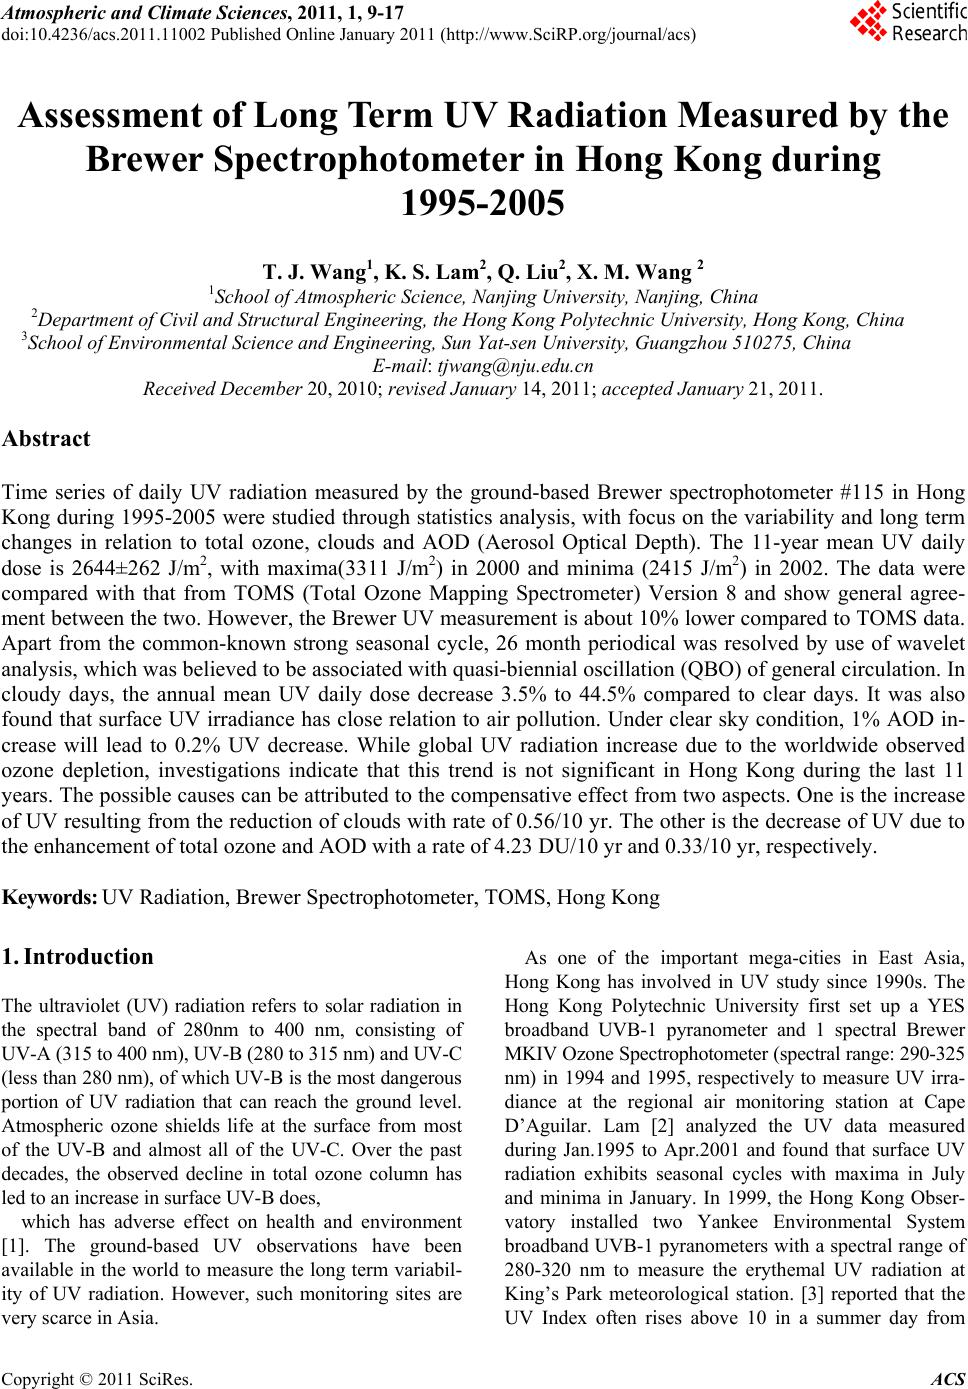 Atmospheric and Climate Sciences, 2011, 1, 9-17 doi:10.4236/acs.2011.11002 Published Online January 2011 (http://www.SciRP.org/journal/acs) Copyright © 2011 SciRes. ACS Assessment of Long Term UV Radiation Measured by the Brewer Spectrophotometer in Hong Kong during 1995-2005 T. J. Wang1, K. S. Lam2, Q. Liu2, X. M. Wang 2 1School of Atmospheric Science, Nanjing University, Nanjing, China 2Department of Civil and Structural Engineering, the Hong Kong Polytechnic University, Hong Kong, China 3School of Environmental Science and Engineering, Sun Yat-sen Un iversity, Guangzhou 510275, China E-mail: tjwang@nju.edu.cn Received December 20, 2010; revised January 14, 2011; accepted January 21, 2011. Abstract Time series of daily UV radiation measured by the ground-based Brewer spectrophotometer #115 in Hong Kong during 1995-2005 were studied through statistics analysis, with focus on the variability and long term changes in relation to total ozone, clouds and AOD (Aerosol Optical Depth). The 11-year mean UV daily dose is 2644±262 J/m2, with maxima(3311 J/m2) in 2000 and minima (2415 J/m2) in 2002. The data were compared with that from TOMS (Total Ozone Mapping Spectrometer) Version 8 and show general agree- ment between the two. However, the Brewer UV measurement is about 10% lower compared to TOMS data. Apart from the common-known strong seasonal cycle, 26 month periodical was resolved by use of wavelet analysis, which was believed to be associated with quasi-biennial oscillation (QBO) of general circulation. In cloudy days, the annual mean UV daily dose decrease 3.5% to 44.5% compared to clear days. It was also found that surface UV irradiance has close relation to air pollution. Under clear sky condition, 1% AOD in- crease will lead to 0.2% UV decrease. While global UV radiation increase due to the worldwide observed ozone depletion, investigations indicate that this trend is not significant in Hong Kong during the last 11 years. The possible causes can be attributed to the compensative effect from two aspects. One is the increase of UV resulting from the reduction of clouds with rate of 0.56/10 yr. The other is the decrease of UV due to the enhancement of total ozone and AOD with a rate of 4.23 DU/10 yr and 0.33/10 yr, respectively. Keywords: UV Radiation, Brewer Spectrophotometer, TOMS, Hong Kong 1. Introduction The ultraviolet (UV) radiation refers to solar radiation in the spectral band of 280nm to 400 nm, consisting of UV-A (315 to 40 0 nm), UV-B (280 to 315 nm) and UV-C (less than 280 nm), of which UV-B is the most dangerous portion of UV radiation that can reach the ground level. Atmospheric ozone shields life at the surface from most of the UV-B and almost all of the UV-C. Over the past decades, the observed decline in total ozone column has led to an increase in surface UV-B does, which has adverse effect on health and environment [1]. The ground-based UV observations have been available in the world to measure the long term variabil- ity of UV radiation. However, such monitoring sites are very scarce in Asia. As one of the important mega-cities in East Asia, Hong Kong has involved in UV study since 1990s. The Hong Kong Polytechnic University first set up a YES broadband UVB-1 pyranometer and 1 spectral Brewer MKIV Ozone Spectrophotometer (spectral range: 290-325 nm) in 1994 and 1995, respectively to measure UV irra- diance at the regional air monitoring station at Cape D’Aguilar. Lam [2] analyzed the UV data measured during Jan.1995 to Apr.2001 and found that surface UV radiation exhibits seasonal cycles with maxima in July and minima in January. In 1999, the Hong Kong Obser- vatory installed two Yankee Environmental System broadband UVB-1 pyranometers with a spectral range of 280-320 nm to measure the erythemal UV radiation at King’s Park meteorological station. [3] reported that the UV Index often rises above 10 in a summer day from 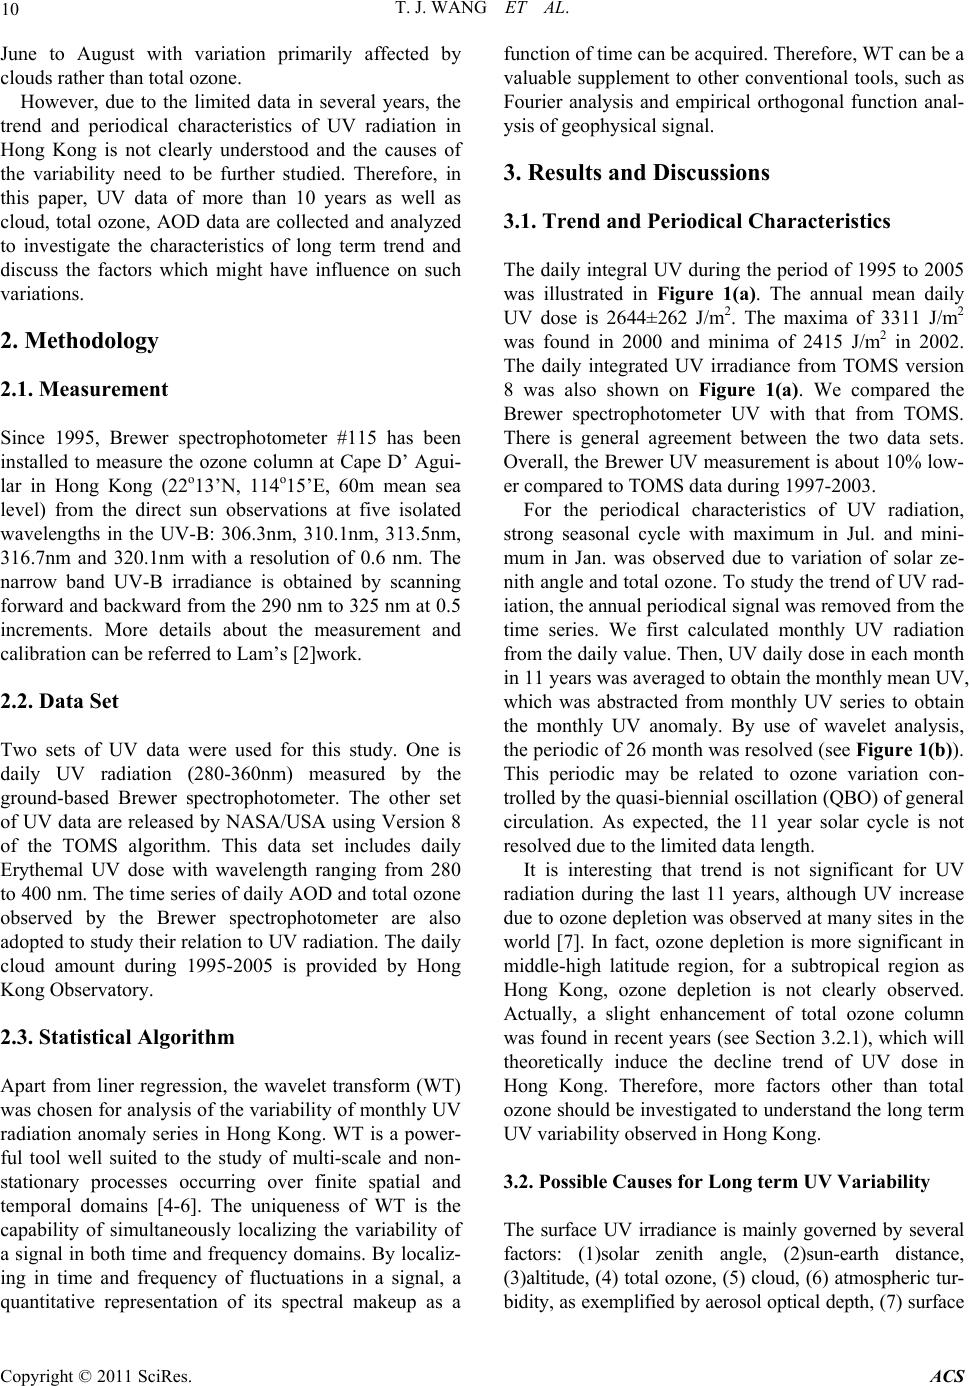 T. J. WANG ET AL. Copyright © 2011 SciRes. ACS 10 June to August with variation primarily affected by clouds rather than total ozone. However, due to the limited data in several years, the trend and periodical characteristics of UV radiation in Hong Kong is not clearly understood and the causes of the variability need to be further studied. Therefore, in this paper, UV data of more than 10 years as well as cloud, total ozone, AOD data are collected and analyzed to investigate the characteristics of long term trend and discuss the factors which might have influence on such variations. 2. Methodology 2.1. Measurement Since 1995, Brewer spectrophotometer #115 has been installed to measure the ozone column at Cape D’ Agui- lar in Hong Kong (22o13’N, 114o15’E, 60m mean sea level) from the direct sun observations at five isolated wavelengths in the UV-B: 306.3nm, 310.1nm, 313.5nm, 316.7nm and 320.1nm with a resolution of 0.6 nm. The narrow band UV-B irradiance is obtained by scanning forward and backward from the 290 nm to 325 nm at 0.5 increments. More details about the measurement and calibration can be referred to Lam’s [2]work. 2.2. Data Set Two sets of UV data were used for this study. One is daily UV radiation (280-360nm) measured by the ground-based Brewer spectrophotometer. The other set of UV data are released by NASA/USA using Version 8 of the TOMS algorithm. This data set includes daily Erythemal UV dose with wavelength ranging from 280 to 400 nm. The time series of daily AOD and total ozone observed by the Brewer spectrophotometer are also adopted to study their relation to UV radiation. The daily cloud amount during 1995-2005 is provided by Hong Kong Observatory. 2.3. Statistical Algorithm Apart from liner regression, the wavelet transform (WT) was chosen for analysis of the variability of monthly UV radiation anomaly series in Hong Kong. WT is a power- ful tool well suited to the study of multi-scale and non- stationary processes occurring over finite spatial and temporal domains [4-6]. The uniqueness of WT is the capability of simultaneously localizing the variability of a signal in both time and frequency domains. By localiz- ing in time and frequency of fluctuations in a signal, a quantitative representation of its spectral makeup as a function of time can be acquired. Th er ef or e, WT ca n b e a valuable supplement to other conventional tools, such as Fourier analysis and empirical orthogonal function anal- ysis of geophysical signal. 3. Results and Discussions 3.1. Trend and Periodical Characteristics The daily integral UV dur ing the period of 1995 to 2005 was illustrated in Figure 1(a). The annual mean daily UV dose is 2644±262 J/m2. The maxima of 3311 J/m2 was found in 2000 and minima of 2415 J/m2 in 2002. The daily integrated UV irradiance from TOMS version 8 was also shown on Figure 1(a). We compared the Brewer spectrophotometer UV with that from TOMS. There is general agreement between the two data sets. Overall, the Brewer UV measurement is about 10% low- er compared to TOMS data during 1997-2003. For the periodical characteristics of UV radiation, strong seasonal cycle with maximum in Jul. and mini- mum in Jan. was observed due to variation of solar ze- nith angle and total ozone. To study th e trend of UV rad- iation, the annual periodical signal was removed from the time series. We first calculated monthly UV radiation from the daily value. Then, UV daily dose in each month in 11 years was averaged to obtain the monthly mean UV, which was abstracted from monthly UV series to obtain the monthly UV anomaly. By use of wavelet analysis, the period ic of 26 month was reso lved (s ee Figure 1(b)). This periodic may be related to ozone variation con- trolled by the quasi-biennial oscillation (QBO) of general circulation. As expected, the 11 year solar cycle is not resolved due to the limited data length. It is interesting that trend is not significant for UV radiation during the last 11 years, although UV increase due to ozone depletion was observed at many sites in the world [7]. In fact, ozone depletion is more significant in middle-high latitude region, for a subtropical region as Hong Kong, ozone depletion is not clearly observed. Actually, a slight enhancement of total ozone column was found in recent years (see Section 3.2.1), which will theoretically induce the decline trend of UV dose in Hong Kong. Therefore, more factors other than total ozone should be investigated to understand the long term UV variability observed in Hong Kong. 3.2. Possible Causes for Long term UV Variability The surface UV irradiance is mainly governed by several factors: (1)solar zenith angle, (2)sun-earth distance, (3)altitude, (4) total ozone, (5) cloud, (6) atmospheric tur- bidity, as exemplified by aerosol optical depth, (7) surface 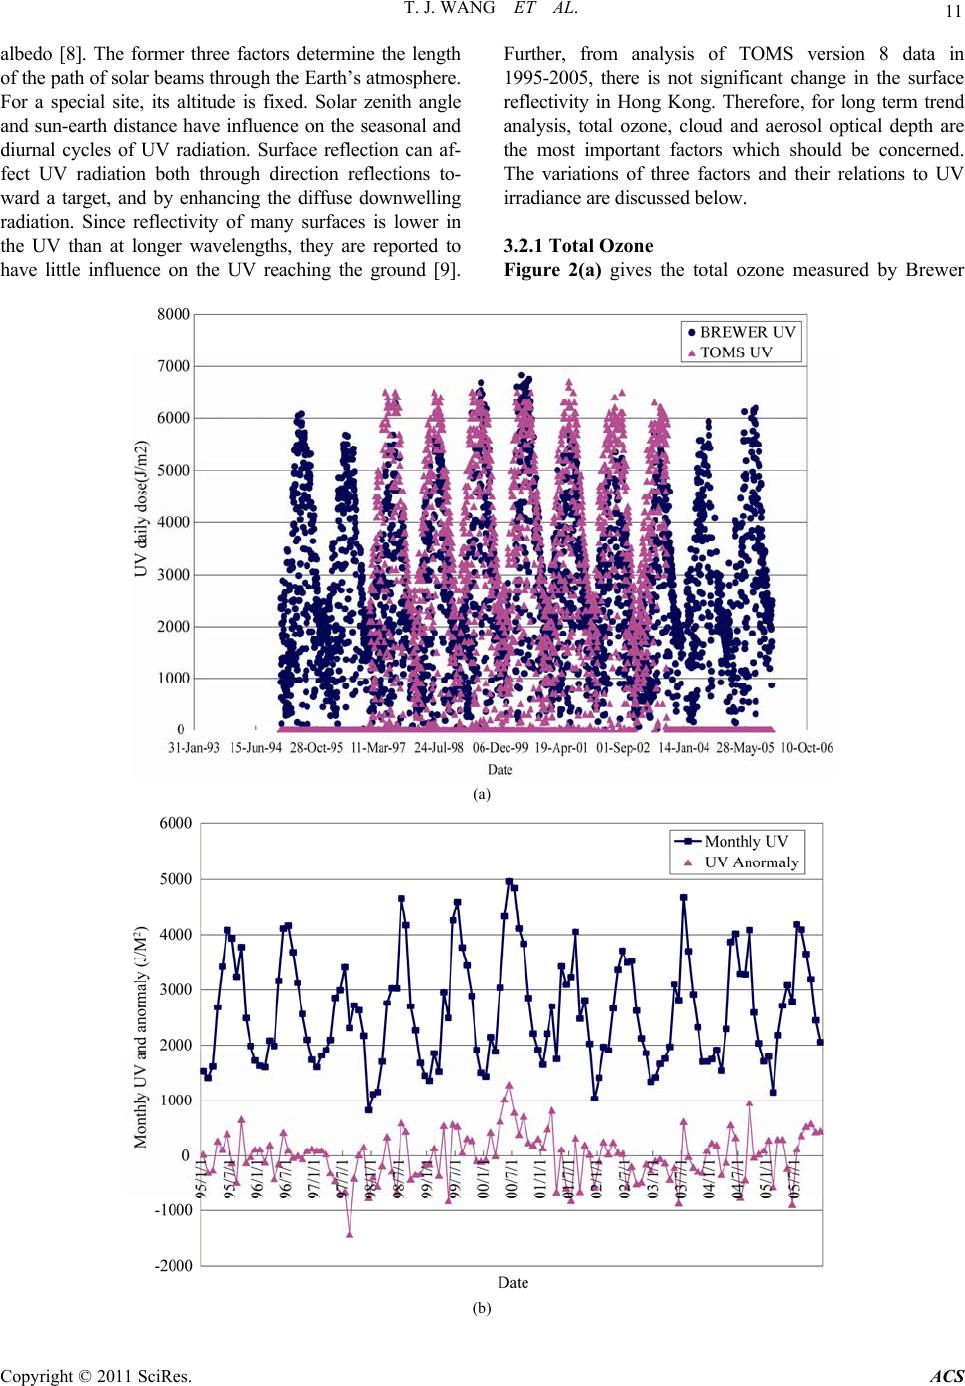 T. J. WANG ET AL. Copyright © 2011 SciRes. ACS 11 albedo [8]. The former three factors determine the length of the path of solar beams through the Earth’s atmosphere. For a special site, its altitude is fixed. Solar zenith angle and sun-earth distance have influence on the seasonal and diurnal cycles of UV radiation. Surface reflection can af- fect UV radiation both through direction reflections to- ward a target, and by enhancing the diffuse downwelling radiation. Since reflectivity of many surfaces is lower in the UV than at longer wavelengths, they are reported to have little influence on the UV reaching the ground [9]. Further, from analysis of TOMS version 8 data in 1995-2005, there is not significant change in the surface reflectivity in Hong Kong. Therefore, for long term trend analysis, total ozone, cloud and aerosol optical depth are the most important factors which should be concerned. The variations of three factors and their relations to UV irradiance are discussed below. 3.2.1 Total Ozone Figure 2(a) gives the total ozone measured by Brewer (a) (b) 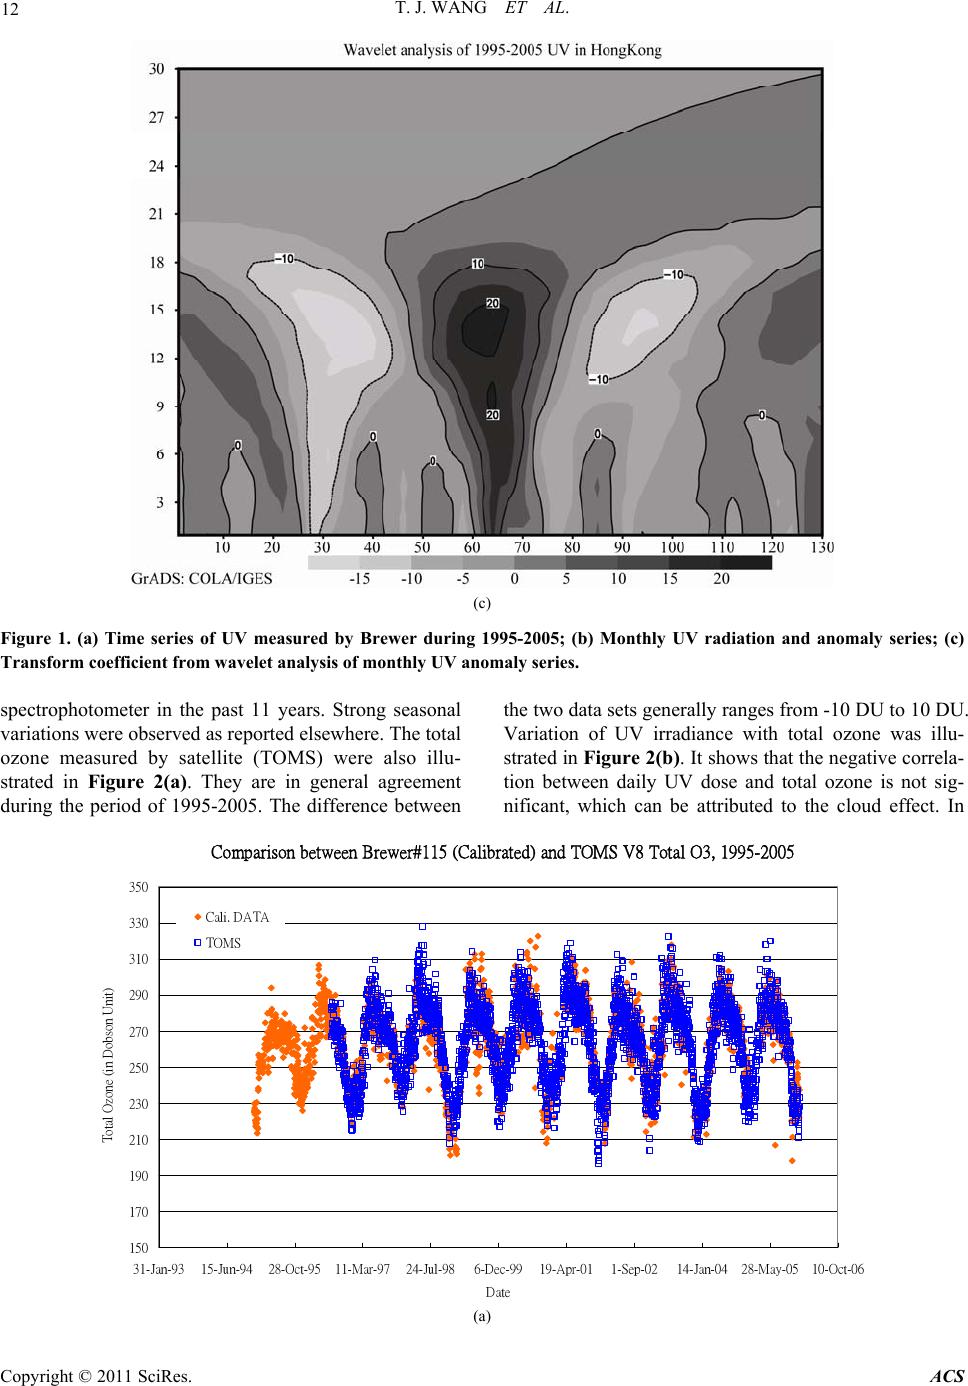 T. J. WANG ET AL. Copyright © 2011 SciRes. ACS 12 (c) Figure 1. (a) Time series of UV measured by Brewer during 1995-2005; (b) Monthly UV radiation and anomaly series; (c) Transform coefficient from wavelet analysis of monthly UV anomaly series. spectrophotometer in the past 11 years. Strong seasonal variations were observed as reported elsewhere. The total ozone measured by satellite (TOMS) were also illu- strated in Figure 2(a). They are in general agreement during the period of 1995-2005. The difference between the two data sets generally ranges from -10 DU to 10 DU. Variation of UV irradiance with total ozone was illu- strated in Figure 2(b). It shows that the negative correla- tion between daily UV dose and total ozone is not sig- nificant, which can be attributed to the cloud effect. In Comparison between Brewer#115 (Calibrated) and TOMS V8 Total O3, 1995-2005 150 170 190 210 230 250 270 290 310 330 350 31-Jan-9315-Jun-9428-Oct-9511-Mar-9724-Jul-986-Dec-9919-Apr-011-Sep-0214-Jan-0428-May-05 10-Oct-06 Date Total Ozone (in Dobson Unit) Cali. DATA TOMS (a)  T. J. WANG ET AL. Copyright © 2011 SciRes. ACS 13 6000 5000 4000 3000 2000 1000 0 UV daily dose (J/m2) 320300280260240220200 Total ozone ( DU ) (b) y = 0.0358x - 43.544 -35 -25 -15 -5 5 15 25 1995/1/1 1995/7/1 1996/1/1 1996/7/1 1997/1/1 1997/7/1 1998/1/1 1998/7/1 1999/1/1 1999/7/1 2000/1/1 2000/7/1 2001/1/1 2001/7/1 2002/1/1 2002/7/1 2003/1/1 2003/7/1 2004/1/1 2004/7/1 2005/1/1 2005/7/1 Date Monthly total ozone anormaly(D.U) (c) Figure 2. (a) Total ozone measured by Brewer during 1995-2005; (b) Variation of UV irradiance with total ozone; (c) Varia- tion and trend of monthly total ozone anomaly series. cloudless sky, the absorption of UV due to ozone is dominated, leading to UV reduction with total ozone enhancement. The clear sky UV and total ozone rela- tionship has been discussed by Lam [2], where, one per- cent increase in total ozone is associated with one per- cent decrease in surface UV irradiance in Hong Kong. Here, we pay much attention to the trend of total ozone on UV long term variability. To eliminate the influence of seasonal signal on trend analysis, the time series of monthly anomaly of total ozone was constructed using  T. J. WANG ET AL. Copyright © 2011 SciRes. ACS 14 the method similar to UV data(see Figure 2(c)). It shows that total ozone has a trend of increase during the study period. Simple linear regression shows that the increas- ing rate is 4.23 DU/10 yr. The trend of total ozone en- hancement may result in trend of UV reduction. 3.2.2. Cl o u ds Clouds can absorb, reflect and scatter portions of incom- ing radiation, the more prominent effect is the reduction of UV amount reaching the ground. Since clouds change greatly in spatial and temporal, they will introduce tre- mendous variability into surface UV radiation. The vari- ation of UV daily dose with cloud amount at day time was shown on Figure 3(a). During the cloudy days (cloud amount > = 4), UV shows decline with cloud amount. However, for clear days (cloud amount < 4), the anti-correlation between UV and cloud amount is not significant. This suggests that cloud amount is not the only dominating factor effecting UV. In fact, UV irra- diance also depends strongly on cloud types. It has been reported that attenuation of UV radiation by cirrus is weak and broken clouds can sometimes increase UV irradiation by reflection from their sides [9]. Due to the lack of cloud type data, the effect of clouds on UV radia- tion can not be further investigated. Here, the cloudy and clear days are cataloged and UV irradiance under these two conditions was estimated. Here, the clear days were selected with UV diurnal profiles having a smooth bell shape and the cloud amount being less than 3. The results are shown in Table 1, which indicate that the annual mean UV daily dose in cloudy days decrease 3.5% to 44.5% compared to clear days during 1995-2005. Con- sidering the total data sets, UV irradiance is negatively correlated with cloud amount. The monthly cloud amount anomaly was shown on Figure 3(b), which ex- hibits a trend of decrease with the rate of 0.56/10 yr. The trend of cloud amount reduction will lead to the UV in- crease trend. 3.2.3. Aerosol Opti cal Depth Aerosol can affect UV radiation through extinction and scattering process. It was reported that increased air Table 1. Annual mean UV daily dose under clear and cloudy conditions. Year Clear days UV (J/m2) Cloudy days UV (J/m2) Reduction rate (%) 1995 3112.838 2515.687 -19.2 1996 3335.21 2398.401 -28.1 1997 3013.153 2241.636 -25.6 1998 4128.601 2292.941 -44.5 1999 2782.365 2684.82 -3.5 2000 4155.097 3115.136 -25.0 2001 3271.7 2624.202 -19.8 2002 2916.931 2353.281 -19.3 2003 3067.99 2482.839 -19.1 2004 2920.975 2635.289 -9.8 2005 3552.64 2536.069 -28.6 6000 5000 4000 3000 2000 1000 0 UV daily dose (J/m 2 ) 86420 Cloud amount (a)  T. J. WANG ET AL. Copyright © 2011 SciRes. ACS 15 y = -0.0047x + 5.7693 y = -0.0041x + 0.2702 -4 -2 0 2 4 6 8 1611 1621 26 3136 4146 5156 61 66 71 76 81 8691 96101106111116121126131 Date Monthly average cloud amount in day and abomornly Cloud amount in day Anormaly Linear (Cloud amount in day) Linear (Anormaly) (b) Figure 3. (a) Variation of UV irradiance with cloud; (b) Monthly average cloud amount in day during the day during 1995-2005. pollution, as exemplified by high aerosol loading, are capable of reducing the erythemal solar irradiance at the ground as much as 30-40% [10]. Here, the aerosol opti- cal depth at 320.0nm is regularly retrieved and recorded through Brewer Spectrophotometer measurement. The average optical depth is 0.58 with a standard deviation of 0.29 during 1995-2005. Figure 4(a) is the scattering plots of UV radiation and AOD. Calculations show that UV irradiance is negatively correlated with AOD. Al- though the correlation coefficient 0.124 is not very high, it reaches 95% confidence level due to large number of sample. To investigate the influence of air pollution on UV dose, clear days (cloud amount < 4) were selected. Then UV data with solar zenith angle (45 ± 5 degree) and total ozone (270±20DU) were filtered. The scatting plot of UV and AOD under clear sky was shown on Figure 4(b). Calculations suggest that 1% AOD increase will lead 6000 5000 4000 3000 2000 1000 0 UV daily dose(J/m2) 3.02.52.01.51.00.50.0 Aerosol o p tical de p th (a)  T. J. WANG ET AL. Copyright © 2011 SciRes. ACS 16 2500 2000 1500 1000 UV daily dose under clear sky (J/m 2 ) 0.80.70.60. 50.40.30. 2 Aerosl O p tical De p th ( AOD , 320nm ) UV=2413.2 - 887.3AOD (b) 2.5 2.0 1.5 1.0 0.5 Aerosol Optical Depth(AOD) 01/01/1996 01/01/1998 01/01/2000 01/01/2002 01/01/2004 Date (c) Figure 4. (a) Variation of UV irradiance with AOD; (b) Variation of UV irradiance with AOD under clear conditions; (c) AOD measured by Brewer during 1995-2005. to 0.2% UV decrease. Figure 4(c) gives the increasing rate of AOD during 1995-2005. The significant increas- ing rate of 0.33/10 yr was exhibited from the AOD series, which will lead to the decreasing trend of UV. As discussed above, measurements have shown that both total ozone and AOD exhibit trend of enhancement during 1995- 2005. On the o ther hand, reduction of cloud amount has also been observed. It is believed that in- crease of total ozone as well as AOD and decrease of cloud amount will have compensative effect on UV radi- ation, which may explain the insignificant trend of UV observed in Hong Kong.  T. J. WANG ET AL. Copyright © 2011 SciRes. ACS 17 4. Conclusions Ground-based spectral ultraviolet radiation measurement has been carried out by Brewer spectrophotometer #115 at Hong Kong since January 1995 . The annual mean UV daily dose is 2644±262 J/m2. The maxima of 3311 J/m2 and minima of 2415 J/m2 were measured in 2000 and 2002, respectively. In general, the observed UV was 10% lower than that from TOMS Version 8. The 26 month periodic, related to the quasi-biennial oscillation of gen- eral circulation, was resolved from the monthly UV anomaly series by use of wavelet analysis. Compared to the clear days, the annual mean UV daily dose decrease 3.5% to 44.5% under the cloudy weather conditions. It was found that 1% AOD increase will lead to 0.2% UV decrease in clear sky. Investigations show that UV radia- tion did not exhibit significant trend during the period of 1995-2005. However, the changing rates of -0.56/10 yr, 4.23 DU/10 yr and 0.33/10 yr were observed for cloud amount, total ozone and AOD, respectively. It is believed that the compensative effect between the increase of UV resulting from the reduction of clouds and the decrease of UV due to the enhancement of total ozone and AOD plays important roles in the long term UV variability in Hong Kong. 5. Acknowledgement This project was supported by the National Key Basic Research Development Program of China (2010CB 428503, 2011CB403406) and the Research Grant Coun- cil of Hong Kong. Thanks to Hong Kong Observatory for providing cloud data. We also thank United States, NASA, Goddard Space Flight Center for making the TOMS data publicly available. 6. References [1] H. Slaper, M. Velders, J. S. Daniel, F. R. Degruijl and J. C. Vanderleun, “Estimates of ozone depletion and skin cancer incidence to examine the Vienna convention achievement,” Nature, Vol. 384, No. 6606, 1996, pp. 256-258. [2] K. S. Lam, A. J. Ding, L. Y. Chan, T. Wang, and T. J. Wang, “Ground Based Measurements of Total Ozone and UV Radiation by the Brewer Spectrophotomer #115 at Hong Kong,” Atmospheric Environment, Vol. 36, 2002, pp. 2003-2012. [3] Y. W. Chan, “A study of the characteristics of ultraviolet radiation in Hong Kong,” Radiation Protection Dosime- try, Vol. 91, No. 1-3, 2000, pp. 173-176. [4] C. K. Chui, “An introduction to wavelets,” Academic Press, 1992, p. 266. [5] J. J. Benedetto and M. W. Frazier, “Wavelets: mathemat- ics and applications,” CRC Press, 1994, p. 575. [6] G. Kaiser, “A friendly guide to wavelets,” Birkhaser, 1994, p. 300. [7] WMO, “Scientific assessment of ozone depletion,” Glob- al Ozo ne Res. Monit. Project, Geneva, 2002 p. 47498. [8] W. R. Burrows, M. Vallee and J. B. Wardle, “The Cana- dian Operational Procedure for Forecasting Total Ozone and UV Radiation, Meteorological Applications,” Vol.1, pp. 247-265. [9] R. E. Hester and R. M. Harrison, “Cause and environ- mental implications of increased UV-B radiation,” Pub- lished by the Royal Society o Chemistry, Thomas Gra- ham House. 20-22, 2000. [10] G. G. Palancar and B. M. Toselli, “Effects of metrology and tropospheric aerosols on UV-B radiation: a 4-year study, ” Atmospheric Environment, Vol. 38, 2004, pp. 2749-2757. [11] K. Buttner, “Physik. Bioklimat, quoted in M. L. Nack & Green, A. E. S., 1974. Influence of clouds, haze, and smog on the middle ultraviolet reaching the ground,” Appl. Optics, Vol. 13, No. 10, 1938, pp. 2405-2415. [12] F. Carvalho and D. Henriques, “Use of Brewer Ozone Spectrophotometer for Aerosol Optical Depth Measure- ments on Ultraviolet Region,” Adv. Space Res, Vol. 25, No. 5, 2000, pp. 997-1006. [13] den Outer, P. N. Slaper and R. B. Tax, “UV radiation in the Netherlands: Assessing long-term variability and trends in relation to ozone and clouds,” Journal of Geo- physical Research, Vol. 110, No. D02203, 2005. doi:10.1029/2004JD004824,2005 [14] J. Grobner and C. Meleti, “Aerosol optical depth in the UVB and visible wavelength range from Brewer spec- trophotometer direct irradiance measurements: 1991-2002,” Journal of Geophysical Research, Vol. 109, No. D09202, 2004. doi:10.1029/2003JD004409,2004 [15] F. Marenco, A. Di Sarra and D. J. Luisi, “Methodology for determining aerosol optical depth from Brewer 300-320 nm ozone measurements,” Applied Optics, Vol. 41, No. 9, pp. 1805-1814, 2002. |