 Sociology Mind 2013. Vol.3, No.4, 278-283 Published Online October 2013 in SciRes (http://www.scirp.org/journal/sm) http://dx.doi.org/10.4236/sm.2013.34037 Copyright © 2013 SciRes. 278 Cheque Cashing Places: Preying on Areas with High Crime Joel G. Ray*, Talia Boshari, Piotr Gozdyra, Maria Isabella Creatore, Flora I. Matheson The Centre for Research on Inner City Health, St. Michael’s Hospital, University of Toronto, Toronto, Canada Email: *rayj@smh.ca Received July 23rd, 2013; revised August 22nd, 2013; accepted September 2nd, 2013 Copyright © 2013 Joel G. Ray et al. This is an open access article distributed under the Creative Commons At- tribution License, which permits unrestricted use, distribution, and reproduction in any medium, provided the original work is properly cited. With the closure of mainstream bank branches in low-income neighbourhoods, cheque cashing places (CCPs) grew exponentially in the past decade. CCP users tend to be those in need of quick cash or who frequently live from pay cheque to pay cheque. CCPs appear to target low-income vulnerable consum- ers—the so-called “unbanked”. Such individuals are more likely to reside in high-crime areas. We hy- pothesized that CCPs are more prevalent in neighbourhoods with high crime rates, and that this might be a function of strategic marketing by CCPs, rather than merely an indicator of economic disparity. We ex- plored the relation between the density of CCPs in each census tract in Toronto and its association with both any crime and also violent crime. The findings indicate that CCPs are more abundant in areas of high crime, and especially, violent crime, and this appears to be independent of measures of material depriva- tion and residential instability. While the CCP industry has strategically focused on customers of low so- cioeconomic status, it is plausible that they also focus on high-crime areas as well. Keywords: Cheque Cashing Place; Cheque Cashing Outlet; Crime; Violent Crime Introduction As mainstream US and Canadian financial institutions evolved, there were closures of various bank outlets in lower income neighbourhoods. Cheque cashing places (CCPs) appeared as a new entity, filling the niche once occupied by local banks (Eskin, 1995). Because banks do not offer accounts to persons with a criminal record or an unstable credit line, CCPs became the only viable option for some (FCAC Ipsos-Reid, 2005; Ramsay, 2000). CCPs appear to target low-income “vulnerable consum- ers”—the “unbanked” as they are called (Scarborough Research, 2006); namely, single parent mothers, the elderly and young males under the age of 25 (Eskin, 1995; Ramsay, 2000). The majority of alternative financial sector consumers reside in low income neighbourhoods (Dollar Financial Corp., 2011; Eskin, 1995; FCAC Ipsos-Reid, 2005). CCPs cater to consumers in need of quick cash, or who are frequently living from pay cheque to pay cheque, especially of government cheques (Bates & Lassonde, 2008) that are issued to cover the costs of rent, for example. The alternative financial sector industry, which has grown in popularity since the early 1980s, was virtually unre- gulated until the introduction of bills such as the Ontario “Payday Loans act, 2008” (Legislative Assembly of Ontario, 2008) and other US state licensing1. The City of Toronto, a major economic hub in Canada, also bears one of the largest concentrations of low income residents, traditionally a reflection of its high influx of new immigrants and the prospect of economic opportunities (Social Policy Analy- sis and Research, 2011). In 2006, 25% of all Toronto residents were living below the before-tax low income cut-off, with many receiving social assistance (Social Policy Analysis and Re- search, 2011). The current trends are likely to substantially increase by 2025. Low income neighbourhoods are primarily populated by visible minorities, recent immigrants and young residents living in multi-unit properties (Charron, 2009). The high density of young residents, combined with high alcohol consumption, high unemployment and presence of gangs make some of these areas particularly susceptible to high crime rates (Savoie, 2008). It is plausible that CCPs are strategically assigned to socially unstable areas, where banks are lacking and the rate of crime is higher. We hypothesized that CCPs appear in greater concen- trations within neighbourhoods with high crime rates, and that this is independent of traditional neighbourhood indicators of low socioeconomic status. Methods We completed a population-based study of the entire City of Toronto, Canada. As the independent variable of interest, we explored all crime, as well as violent crime—the latter defined as the use or threatened use of violence against a person, in- cluding homicide, attempted murder, assault, sexual assault and robbery. We used all police-reported crime statistics for the year 2006, from the Uniform Crime Reporting Survey, com- piled by the Canadian Centre for Justice Statistics2. Crimes were characterized as the number of events in each of the 520 census tracts (CT), which are small, relatively stable geo- *Corresponding author. 1See Appendix A in http://assets.aarp.org/rgcenter/consume/d16910_check_cash.pdf. 2See http://www.statcan.gc.ca/cgi-b in/imdb/p2SV.pl?Fun ction=getSurvey&SDD S=3302&lang=en&db=imdb&adm=8&dis=2. 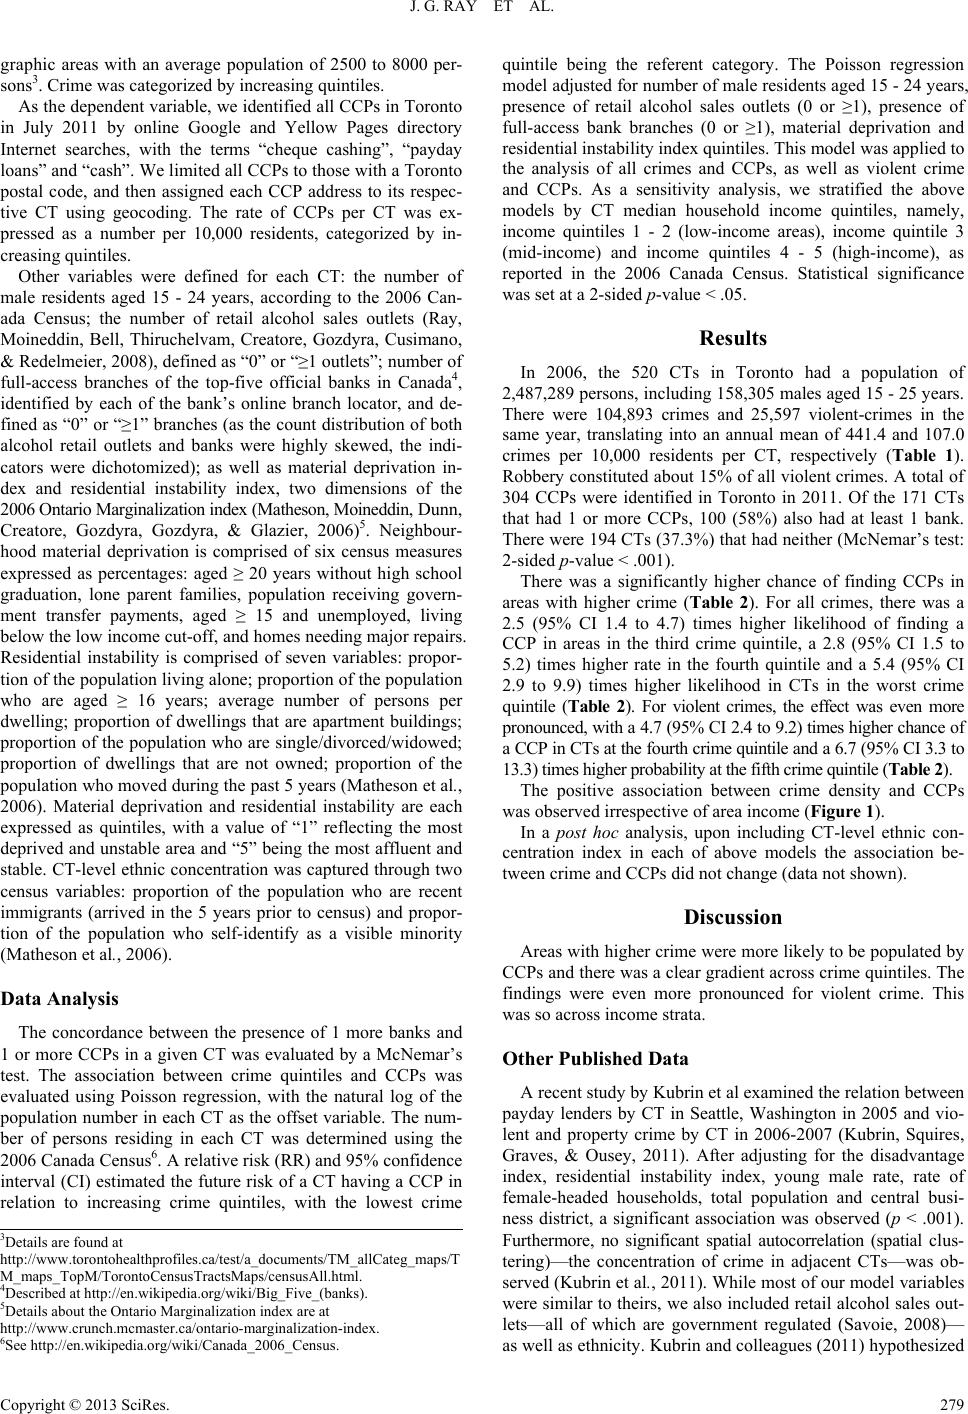 J. G. RAY ET AL. Copyright © 2013 SciRes. 279 graphic areas with an average population of 2500 to 8000 per- sons3. Crime was categorized by increasing quintiles. As the dependent variable, we identified all CCPs in Toronto in July 2011 by online Google and Yellow Pages directory Internet searches, with the terms “cheque cashing”, “payday loans” and “cash”. We limited all CCPs to those with a Toronto postal code, and then assigned each CCP address to its respec- tive CT using geocoding. The rate of CCPs per CT was ex- pressed as a number per 10,000 residents, categorized by in- creasing quintiles. Other variables were defined for each CT: the number of male residents aged 15 - 24 years, according to the 2006 Can- ada Census; the number of retail alcohol sales outlets (Ray, Moineddin, Bell, Thiruchelvam, Creatore, Gozdyra, Cusimano, & Redelmeier, 2008), defined as “0” or “≥1 outlets”; number of full-access branches of the top-five official banks in Canada4, identified by each of the bank’s online branch locator, and de- fined as “0” or “≥1” branches (as the count distribution of both alcohol retail outlets and banks were highly skewed, the indi- cators were dichotomized); as well as material deprivation in- dex and residential instability index, two dimensions of the 2006 Ontario Marginalization index (Matheson, Moineddin, Dunn, Creatore, Gozdyra, Gozdyra, & Glazier, 2006)5. Neighbour- hood material deprivation is comprised of six census measures expressed as percentages: aged ≥ 20 years without high school graduation, lone parent families, population receiving govern- ment transfer payments, aged ≥ 15 and unemployed, living below the low income cut-off, and homes needing major repairs. Residential instability is comprised of seven variables: propor- tion of the population living alone; proportion of the population who are aged ≥ 16 years; average number of persons per dwelling; proportion of dwellings that are apartment buildings; proportion of the population who are single/divorced/widowed; proportion of dwellings that are not owned; proportion of the population who moved during the past 5 years (Matheson et al., 2006). Material deprivation and residential instability are each expressed as quintiles, with a value of “1” reflecting the most deprived and unstable area and “5” being the most affluent and stable. CT-level ethnic concentration was captured through two census variables: proportion of the population who are recent immigrants (arrived in the 5 years prior to census) and propor- tion of the population who self-identify as a visible minority (Matheson et al., 2006). Data Analysis The concordance between the presence of 1 more banks and 1 or more CCPs in a given CT was evaluated by a McNemar’s test. The association between crime quintiles and CCPs was evaluated using Poisson regression, with the natural log of the population number in each CT as the offset variable. The num- ber of persons residing in each CT was determined using the 2006 Canada Census6. A relative risk (RR) and 95% confidence interval (CI) estimated the future risk of a CT having a CCP in relation to increasing crime quintiles, with the lowest crime quintile being the referent category. The Poisson regression model adjusted for number of male residents aged 15 - 24 years, presence of retail alcohol sales outlets (0 or ≥1), presence of full-access bank branches (0 or ≥1), material deprivation and residential instability index quintiles. This model was applied to the analysis of all crimes and CCPs, as well as violent crime and CCPs. As a sensitivity analysis, we stratified the above models by CT median household income quintiles, namely, income quintiles 1 - 2 (low-income areas), income quintile 3 (mid-income) and income quintiles 4 - 5 (high-income), as reported in the 2006 Canada Census. Statistical significance was set at a 2-sided p-value < .05. Results In 2006, the 520 CTs in Toronto had a population of 2,487,289 persons, including 158,305 males aged 15 - 25 years. There were 104,893 crimes and 25,597 violent-crimes in the same year, translating into an annual mean of 441.4 and 107.0 crimes per 10,000 residents per CT, respectively (Table 1). Robbery constituted about 15% of all violent crimes. A total of 304 CCPs were identified in Toronto in 2011. Of the 171 CTs that had 1 or more CCPs, 100 (58%) also had at least 1 bank. There were 194 CTs (37.3%) that had neither (McNemar’s test: 2-sided p-value < .001). There was a significantly higher chance of finding CCPs in areas with higher crime (Table 2). For all crimes, there was a 2.5 (95% CI 1.4 to 4.7) times higher likelihood of finding a CCP in areas in the third crime quintile, a 2.8 (95% CI 1.5 to 5.2) times higher rate in the fourth quintile and a 5.4 (95% CI 2.9 to 9.9) times higher likelihood in CTs in the worst crime quintile (Table 2). For violent crimes, the effect was even more pronounced, with a 4.7 (95% CI 2.4 to 9.2) times higher chance of a CCP in CTs at the fourth crime quintile and a 6.7 (95% CI 3.3 to 13.3) times higher probability at the fifth crime quintile (Table 2). The positive association between crime density and CCPs was observed irrespective of area income (Figure 1). In a post hoc analysis, upon including CT-level ethnic con- centration index in each of above models the association be- tween crime and CCPs did not change (data not shown). Discussion Areas with higher crime were more likely to be populated by CCPs and there was a clear gradient across crime quintiles. The findings were even more pronounced for violent crime. This was so across income strata. Other Published Data A recent study by Kubrin et al examined the relation between payday lenders by CT in Seattle, Washington in 2005 and vio- lent and property crime by CT in 2006-2007 (Kubrin, Squires, Graves, & Ousey, 2011). After adjusting for the disadvantage index, residential instability index, young male rate, rate of female-headed households, total population and central busi- ness district, a significant association was observed (p < .001). Furthermore, no significant spatial autocorrelation (spatial clus- tering)—the concentration of crime in adjacent CTs—was ob- served (Kubrin et al., 2011). While most of our model variables were similar to theirs, we also included retail alcohol sales out- lets—all of which are government regulated (Savoie, 2008)— as well as ethnicity. Kubrin and colleagues (2011) hypothesized 3Details are found at http://www.torontohealthp rofiles.ca/test/a_documents/TM_allCateg_maps/T M_maps_TopM/TorontoCensusTractsMaps/censusAll.html. 4Described at http://en.wikipedia.org/wiki/Big_Five_(banks). 5Details about the Ontario Marginalization index are at http://www.crunch.mcmaster.ca/ontario-marginalization-index. 6See http://en.wikipedia.org/wiki/Canada_2006_Census. 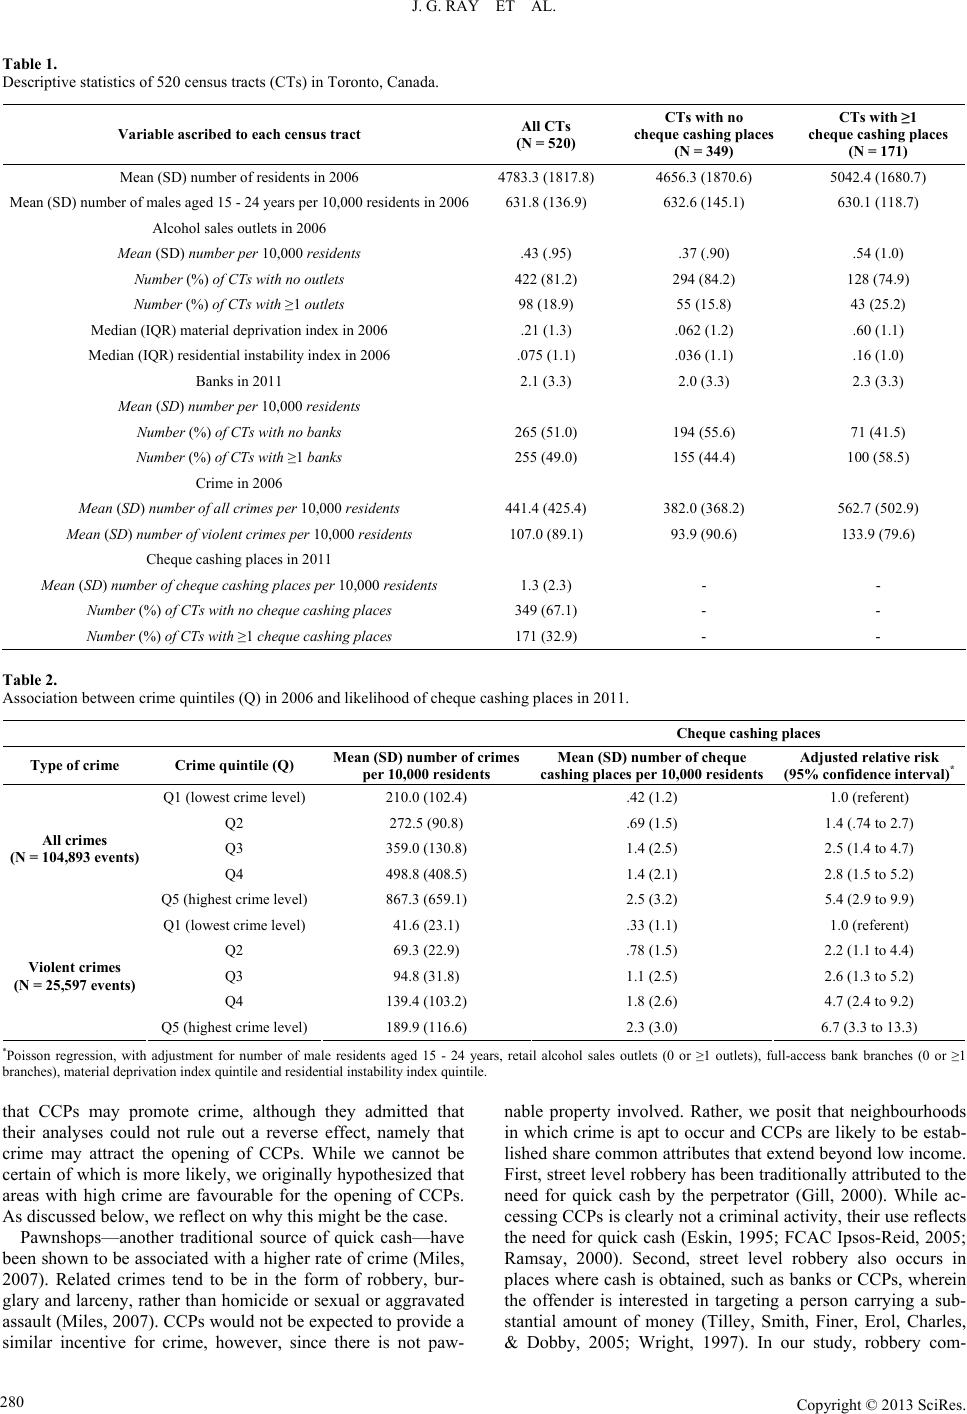 J. G. RAY ET AL. Copyright © 2013 SciRes. 280 Table 1. Descriptive statistics of 520 census tracts (CTs) in Toronto, Canada. Variable ascribed to each census tract All CTs (N = 520) CTs with no cheque cashing places (N = 349) CTs with ≥1 cheque cashing places (N = 171) Mean (SD) number of residents in 2006 4783.3 (1817.8) 4656.3 (1870.6) 5042.4 (1680.7) Mean (SD) number of males aged 15 - 24 years per 10,000 residents in 2006631.8 (136.9) 632.6 (145.1) 630.1 (118.7) Alcohol sales outlets in 2006 Mean (SD) number per 10,000 residents .43 (.95) .37 (.90) .54 (1.0) Number (%) of CTs with no outlets 422 (81.2) 294 (84.2) 128 (74.9) Number (%) of CTs with ≥1 outlets 98 (18.9) 55 (15.8) 43 (25.2) Median (IQR) material deprivation index in 2006 .21 (1.3) .062 (1.2) .60 (1.1) Median (IQR) residential instability index in 2006 .075 (1.1) .036 (1.1) .16 (1.0) Banks in 2011 2.1 (3.3) 2.0 (3.3) 2.3 (3.3) Mean (SD) number per 10,000 residents Number (%) of CTs with no banks 265 (51.0) 194 (55.6) 71 (41.5) Number (%) of CTs with ≥1 banks 255 (49.0) 155 (44.4) 100 (58.5) Crime in 2006 Mean (SD) number of all crimes per 10,000 residents 441.4 (425.4) 382.0 (368.2) 562.7 (502.9) Mean (SD) number of violent crimes per 10,000 residents 107.0 (89.1) 93.9 (90.6) 133.9 (79.6) Cheque cashing places in 2011 Mean (SD) number of cheque cas hing places per 10,000 residents 1.3 (2.3) - - Number (%) of CTs with no cheque cashing places 349 (67.1) - - Number (%) of CTs with ≥1 cheque cashi ng places 171 (32.9) - - Table 2. Association between crime quintiles (Q) in 2006 and likelihood of cheque cashing places in 2011. Cheque cashing places Type of crime Crime quintile (Q) Mean (SD) number of crimes per 10,000 residents Mean (SD) number of cheque cashing places per 10,000 residents Adjusted relative risk (95% confidence interval)* Q1 (lowest crime level) 210.0 (102.4) .42 (1.2) 1.0 (referent) Q2 272.5 (90.8) .69 (1.5) 1.4 (.74 to 2.7) Q3 359.0 (130.8) 1.4 (2.5) 2.5 (1.4 to 4.7) Q4 498.8 (408.5) 1.4 (2.1) 2.8 (1.5 to 5.2) All crimes (N = 104,893 events) Q5 (highest crime level) 867.3 (659.1) 2.5 (3.2) 5.4 (2.9 to 9.9) Q1 (lowest crime level) 41.6 (23.1) .33 (1.1) 1.0 (referent) Q2 69.3 (22.9) .78 (1.5) 2.2 (1.1 to 4.4) Q3 94.8 (31.8) 1.1 (2.5) 2.6 (1.3 to 5.2) Q4 139.4 (103.2) 1.8 (2.6) 4.7 (2.4 to 9.2) Violent crimes (N = 25,597 events) Q5 (highest crime level) 189.9 (116.6) 2.3 (3.0) 6.7 (3.3 to 13.3) *Poisson regression, with adjustment for number of male residents aged 15 - 24 years, retail alcohol sales outlets (0 or ≥1 outlets), full-access bank branches (0 or ≥1 branches), material deprivation index quintile and residential instability index quintile. that CCPs may promote crime, although they admitted that their analyses could not rule out a reverse effect, namely that crime may attract the opening of CCPs. While we cannot be certain of which is more likely, we originally hypothesized that areas with high crime are favourable for the opening of CCPs. As discussed below, we reflect on why this might be the case. Pawnshops—another traditional source of quick cash—have been shown to be associated with a higher rate of crime (Miles, 2007). Related crimes tend to be in the form of robbery, bur- glary and larceny, rather than homicide or sexual or aggravated assault (Miles, 2007). CCPs would not be expected to provide a similar incentive for crime, however, since there is not paw- nable property involved. Rather, we posit that neighbourhoods in which crime is apt to occur and CCPs are likely to be estab- lished share common attributes that extend beyond low income. First, street level robbery has been traditionally attributed to the need for quick cash by the perpetrator (Gill, 2000). While ac- cessing CCPs is clearly not a criminal activity, their use reflects the need for quick cash (Eskin, 1995; FCAC Ipsos-Reid, 2005; Ramsay, 2000). Second, street level robbery also occurs in places where cash is obtained, such as banks or CCPs, wherein the offender is interested in targeting a person carrying a sub- stantial amount of money (Tilley, Smith, Finer, Erol, Charles, & Dobby, 2005; Wright, 1997). In our study, robbery com- 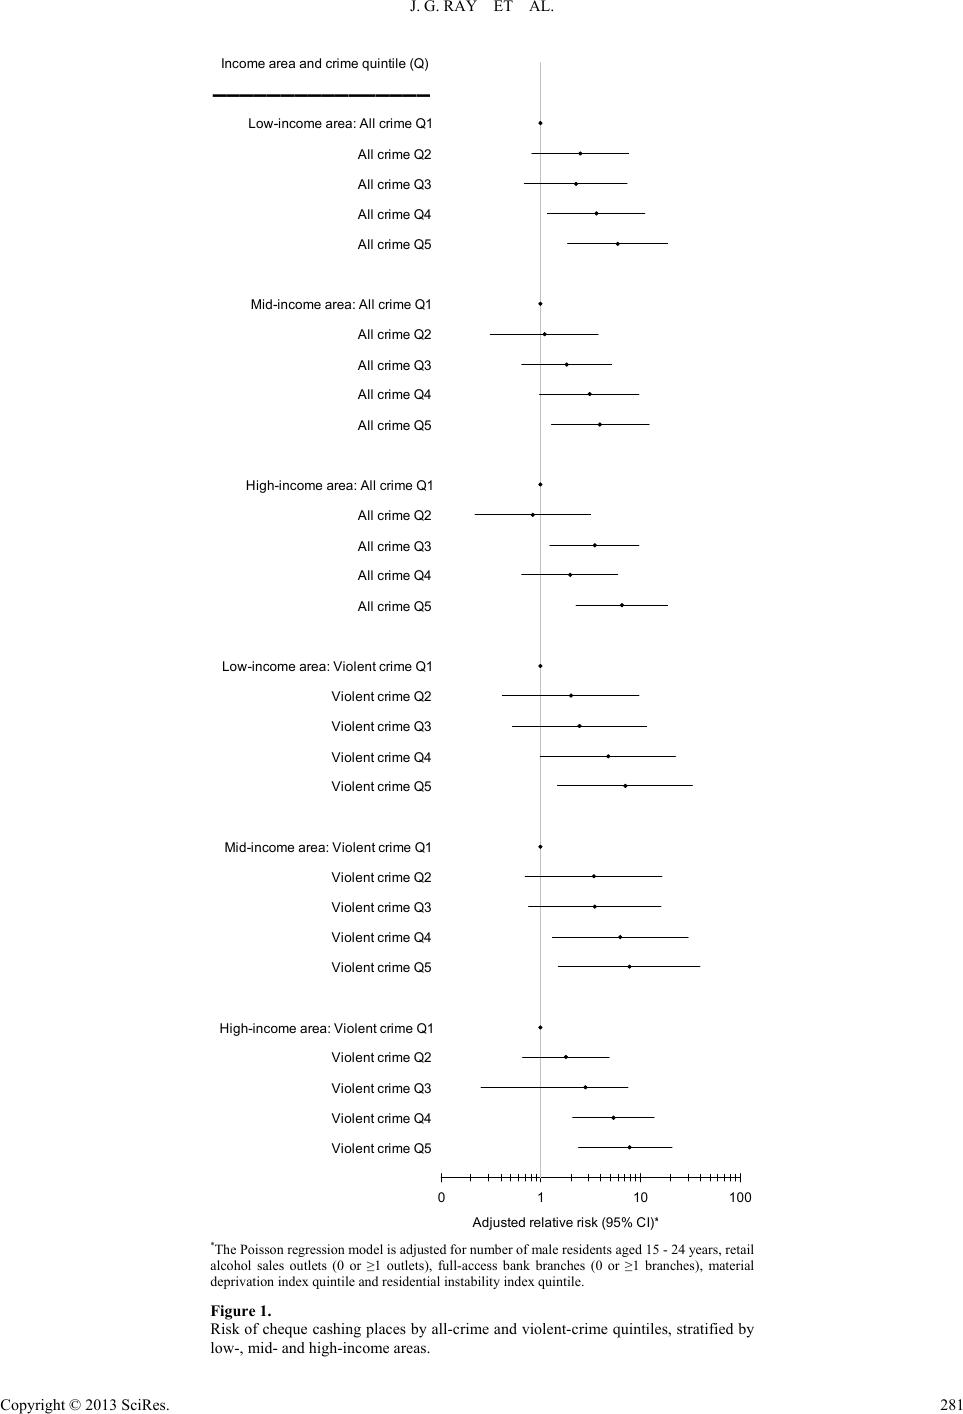 J. G. RAY ET AL. Copyright © 2013 SciRes. 281 0110 100 Violent crime Q5 Violent crime Q4 Violent crime Q3 Violent crime Q2 High-income area: Violent crime Q1 Violent crime Q5 Violent crime Q4 Violent crime Q3 Violent crime Q2 Mid-income area: Violent crime Q1 Violent crime Q5 Violent crime Q4 Violent crime Q3 Violent crime Q2 Low-income area: Violent crime Q1 All crime Q5 All crime Q4 All crime Q3 All crime Q2 High-income area: All crime Q1 All crime Q5 All crime Q4 All crime Q3 All crime Q2 Mid-income area: All crime Q1 All crime Q5 All crime Q4 All crime Q3 All crime Q2 Low-income area: All crime Q1 ▬▬▬▬▬▬▬▬▬▬▬▬▬▬▬▬ Income area and crime quintile (Q) Adjusted relative risk (95% CI) *The Poisson regression model is adjusted for number of male residents aged 15 - 24 years, retail alcohol sales outlets (0 or ≥1 outlets), full-access bank branches (0 or ≥1 branches), material deprivation index quintile and residential instability index quintile. Figure 1. Risk of cheque cashing places by all-crime and violent-crime quintiles, stratified by low-, mid- and high-income areas.  J. G. RAY ET AL. Copyright © 2013 SciRes. 282 prised about 15% of all violent crimes, offering one explanation for the stronger link between violent crime and CCPs observed herein. However, there is a more subtle but interesting explanation for why CCPs are more prevalent in high-crime areas. Crime and CCPs are both prevalent in socially marginalized areas, and this may not solely be a reflection of economic disparity. Our analysis adjusted for indicators of low income and social disor- ganization (Shaw & McKay, 1969), and our stratified analysis suggested that the relation remained in high income areas (Fig- ure 1). Rather, we posit that those who are more likely to be victims of violent crime—younger males and females living in low income areas (Truman, 2010)—are essentially the same group identified as users of CCPs. These potential victims of crime, namely, those with low social capital, are also the tar- geted customers of CCPs. Therefore, CCPs may be strategically placed where customers abound. Data suggest that alternative financial service providers like CCPs serve the financial needs of such clients by filling a void created by the absence of traditional financial institutions—the so-called spatial void hypothesis (Smith, Wackes, & Smith, 2009). We observed that 41.5% of CTs with at least 1 CCP did not have a bank in that CT. As businesses, CCPs are strategi- cally placed (Eskin, 1995), often in lower- and moderate-in- come inner city neighbourhoods, where there has been a visible decline in bank branches (Fox & Woodall, 2006). Between 1994 and 2000, the CCP industry doubled in size, and it then doubled again over the next 5 years (Fox et al., 2006). They have entered the mainstream as regulated businesses with tar- geted customers and with a strategy for growth (Buckland & Martin, 2005). About half of CCP customers use CCP outlets once or twice a month, while 29% use CCPs once a week (Fox et al., 2006). In the US, the mean family net worth of CCP loan borrowers is $23,000, compared to $470,000 among families who did not take out a payday loan (Logan & Weller, 2009). Despite their high fees, CCPs are convenient, in terms of location and hours of operation, and, unlike banks, CCPs only require a single piece of identification. Because banks also require their cus- tomers to have a sufficient off-setting account balance, they apply a hold period to a cheque of up to 5 days before cashing it (Fox et al., 2006). Despite their convenience, CCPs may repre- sent a form of “deviant” banking, in lieu of their high fees. On average, they require a flat fee, and an additional 2.99% of the cheque value (Bates et al., 2008). In the US, such fees increased by 75% between 1997 and 2006 (Fox et al., 2006). By cashing a cheque immediately, a CCP provides a short-term loan, but whose annualized interest rate varies between 100% to 600% (Buckland et al., 2005). For a single person receiving social assistance in Ontario at the maximum of $560 per month, the net result of routinely using a CCP is an annual loss of ap- proximately $237 (Ramsay, 2000). On average, it cost about $25 to cash a $1000 Social Security check in America in 2006 (Fox et al., 2006). In the US, more than 10 million adults living in households are unbanked, meaning that they lack any rela- tionship with a depository financial institution (Fox et al., 2006). Unbanked citizens are more likely to be single, female, younger in age, of lower income or to hold a blue collar job, and are more apt to use fringe financial outlets for ordinary financial transactions (Fox et al., 2006). Thus, CCPs may be targeting socially and economically marginalized individuals, and crime may act as an incentive to station a CCP in a neighbourhood. Limitations and Strengths While we captured the ethnic mix of the CTs studied and in- cluded it in a post hoc analysis, Toronto’s multi-ethnic compo- sition may differ from some US cities. Race may be an impor- tant confounder, since victims of violent crime in the US are more likely to be of Black or Hispanic ancestry (Sampson & Lauritsen, 1997), and CCPs appear to be more concentrated in areas heavily populated by ethnic minorities (Smith et al., 2009). We only evaluated crime events documented through police reports, such that white collar crime, cyber crime and organized crime might be missed; however, it is less conceivable that white collar crime would be related to the location of CCPs. We also did not have information to indicate when a CCP first opened, since we only had a cross-sectional account of those listed in mid-2011. Finally, our crime data were from 2006, while our data on CCPs were from 2011. Implications In Chicago, as the number of coffee shops in a neighbour- hood increased, there was a clear decline in the rate of both homicides and street robberies (Papachristos, Smith, Scherer, & Fugiero, 2011). The coffee shop effect was thought to be a reflection of local gentrification. In the case of CCPs, they may be reflective of the very opposite effect. Are CCPs symbolic of the crime tendency of a neighbour- hood, like graffiti gang symbols (Ferrell, 1993)? Perhaps the presence of CCPs can be included in the list of items on an environmental audit of an area, wherein police and local citi- zens walk though their neighbourhood and identify items that are perceived to be compatible with crime or instability. Would increasing focus on neighbourhoods with high CCPs provide a strategy to consider more services that promote fi- nancial independence for local residents? Unfortunately, there also appears to be a lack of financial literacy among low in- come residents. For example, many are unaware that cashing a government cheque that is under $1500 is free of charge at any mainstream bank (Bates et al., 2008; Savoie, 2008) and that banks offer very affordable services. More than 40% of areas with 1 or more CCPs do not have a bank. Therefore, to reduce the success of alternative financial sector businesses like CCPs, banks need to conduct more outreach in low income neighbour- hoods to increase awareness of banking services, and to con- sider opening branches in neighbourhoods that are under-served. In addition, such areas may benefit from the introduction of a neighbourhood kiosk to assist local residents in opening a bank account, and teaching them basic money management strategies and monthly budgeting. Conclusion We showed that CCPs are more abundant in areas of high crime, and especially, violent crime, and this appeared to be independent of direct measures of material deprivation and resi- dential instability. While the CCP industry has strategically focused on customers of low socioeconomic status, it is plausi- ble that they also focus on high-crime areas as well. This paper adds to a body of literature suggesting that the CCP industry uses various strategic means to corner a niche market of un- banked consumers.  J. G. RAY ET AL. Copyright © 2013 SciRes. 283 REFERENCES Bates, L., & Lassonde, J. (2008). Fees for cashing government cheques. Toronto, Ontario: Law Commission of Ontario. Buckland, J., & Martin, T. (2005). Two-tier banking: The rise of fringe banks in Winnipeg’s inner city. Canadian Journal of Urban Re- search, 14, 158-181. Charron, M. (2009). Neighbourhood characteristics and the distribu- tion of police-reported crime in the city of Toronto. Ottawa, Ontario: Canadian Centre for Justice Statistics. Dollar Financial Corp. (2011). Berwyn, PA. Eskin, S. B. (1995). Check cashing: A model statute. Washington DC: AARP Public Policy Institute Research Group. FCAC Ipsos-Reid (2005). Public experience with financial services and awareness of the FCAC. Ottawa, Ontario. Ferrell, J. (1993). Crimes of style: Urban graffiti and the politics of criminality. New York: Garland. Fox, J. A., & Woodall, P. (2006) Cashed out: Consumers pay steep pre- mium to “bank” at check cashing outlets. Washington DC: Consu- mer Federation of America. Gill, M. (2000). Commercial robbery: Offenders’ perspectives on secu- rity and crime prevention. London: Blackstone Press. Kubrin, C. E., Squires, G. D., Graves, S. M., & Ousey, G. C. (2011). Does fringe banking exacerbate neighborhood crime rates? Crimi- nology & Public Policy, 10, 437-466. http://dx.doi.org/10.1111/j.1745-9133.2011.00719.x Legislative Assembly of Ontario (2008). Bill 48, payday loans act. Toronto, Ontario: Legislative Assembly of Ontario. Logan, A., & Weller, C. E. (2009). Who borrows from payday lenders? An analysis of newly available data. Washington DC: Center for American Progress. Matheson, F. I., Moineddin, R., Dunn, J. R., Creatore, M. I., Gozdyra, P., Gozdyra, P., & Glazier, R. H. (2006). Urban neighborhoods, chronic stress, gender and depression. Social Science & Medicine, 63, 2604- 2616. http://dx.doi.org/10.1016/j.socscimed.2006.07.001 Miles, T. J. (2007). Markets for stolen property: Pawnshops and crime. Chicago: University of Chicago Law School. Papachristos, A. V., Smith, C. M., Scherer, M. L., & Fugiero, M. A. (2011). More coffee, less crime? The relationship between gentrifi- cation and neighborhood crime rates in Chicago, 1991 to 2005. City & Community, 10, 215-240. Ramsay, I. (2000). Access to credit in the alternative consumer credit market. Ottawa, Ontario: Industry Canada. Office of Consumer Af- fairs. Ray, J. G., Moineddin, R., Bell, C. M., Thiruchelvam, D., Creatore, M. I., Gozdyra, P., Cusimano, M., & Redelmeier, D. A. (2008). Alcohol sales and risk of serious assault. PLoS. Me d ic in e , 5, e104. http://dx.doi.org/10.1371/journal.pmed.0050104 Sampson, R. J., & Lauritsen, J. L. (1997). Racial and ethnic disparities in crime and criminal justice in the United States. Crime and Justice, 21, 374. Savoie, J. (2008). Neighbourhood characteristics and the distribution of crime: Edmonton, halifax and thunder bay. Ottawa, Ontario: Ca- nadian Centre for Justice Statistics: Statistics Canada. Scarborough Research (2006). Unbanked consumers: Unique opportu- nities for financial marketers. A complimentary report from scar- borough research. New York. Shaw, C. R., & McKay, H. D. (1969). Juvenile delinquency and urban areas: A study of rates of delinquents in relation to differential char- acteristics of local communities in American cities. Chicago: Univer- sity of Chicago Press. Smith, M. M., Wackes, J., & Smith, T. E. (2009). Alternative financial service providers and the spatial void hypothesis: The case of New Jersey and Delaware. Philadelphia, PA: Federal Reserve Bank of Philadelphia. Social Policy Analysis and Research (2011). Profile of low income in the city of Toronto. Toronto, Ontario: Social Development, Finance and Administration Division. Tilley, N., Smith, J., Finer, S., Erol, R., Charles, C., & Dobby, J. (2005). Problem solving street crime: Practical lessons from the street crime initiative. London, UK: Home Office Research, Development and Statistics Directorate. Truman, J. I. (2010). National crime victimization survey. Washington DC: United States Department of Justice. Office of Justice Programs. Bureau of Justice Statistics. Wright, R. (1997). Armed robbers in action: Stickups and street culture. Boston: Northeastern University Press.
|