Paper Menu >>
Journal Menu >>
 Journal of Software Engineering and Applications, 2011, 1, 69-80 doi:10.4236/jsea.2011.41008 Published Online January 2011 (http://www.scirp.org/journal/jsea) Copyright © 2011 SciRes. JSEA Qualitative System Dynamics as a Tool in Accessible Design Anthony S. White School of Engineering and Information Sciences, Middlesex University, London, UK Email: a.white@mdx.ac.uk Received October 13th, 2010; revised November 15th, 2010; accepted November 20th, 2010 ABSTRACT A description of the Systems Dynamics paradigm is given and the reduced Qualitative System Dynamics (QSD) form explained. A simple example is given to illustrate the diagram construction. The principles of states (levels), rates and feedback loops are outlined. The QSD method is used to address the problem of accessibility by using human control of automation as an example, and applying the QSD method to evaluate the effects of the researcher and user in the de- sign of an accessible artefact. This simple automation model illustrates what can be found out from such a picture, in this indicating how the feedback from users has an influence on the time to deliver su ch designs. Keywords: Qualitative System Dynamics, Computer Interac tion, Accessibility, User Feedback, Software Design 1. Introduction Systems methodology has developed considerably since it was introduced by biologists in the 1920’s. There are now a number of different systems methodologies. All of these are somewhat dependent on the type of system be- ing analysed. For ‘Hard Systems’ the modelling tech- niques used by engineers are sophisticated and usually very accurate. For ‘Soft Systems’, where there is a large amount of human intervention, the model and techniques are generally much weaker in their predictive power [1] but may give great insight into the causal relationships between important concepts. Apart from Total Systems Intervention (TSI) devised by Flood and Jackson [2], which includes all of the known techniques, there are at least six major systems techniques that are used to ana- lyse business systems. These techniques are: System Dynamics (SD) Viable System Diagnosis (VSD) Strategic Assumption Surfacing and Testing (SAST) Interactive Planning (IP) Soft Systems Methodology (SSM) Critical System Heuristics (CSH) In this array of techniques System Dynamics has a place that has some unique features, particularly in rep- resenting time variation and indicating the important feedback parameters. This paper will outline methods used in SD to show how they can add some benefit to research in accessibility identifying causal relationships and how research can be progressed. First a review of research methods currently used in accessibility will be given. This will be followed by a description of SD and particularly Qualitative SD, a technique that can be used early on in a project. Some example of SD use in accessibility type projects will be given and finally some recommendations made. 2. Research Methods 2.1. General Research Methods Creswell [3] aggregated and re-formulated Crotty’s [4] framework into three steps for designing a research pro- gramme: Define knowledge claims adopted by researcher; Define strategies that can be employed due to its prop- erness to the research question; Define methods of data collection and analysis. The researcher in the early stage defines their philoso- phical perspectives, so an assumption regarding the re- search outcome is made and how to reach this outcome should be identified. Creswell [3] points out that “The researcher makes a claim about what is knowledge, how to know it, what values go into, how to write about it and the process of studying it”. Clarke [5] classified research traditions in information systems in general, into three main categories: 1) Conventional scientific research (or positivist), this  Qualitative System Dynamics as a Tool in Accessible Design Copyright © 2011 SciRes. JSEA 70 is where a researcher starts using theory then proposes a hypothesis that should be tested to provide feedback about proposed theory; 2) Interpretivist research, assuming that reality can be differently interpreted depending on many factors in ad- dition to the researcher’s perspective; and 3) Engineering research, where research focusing on achieving a desired outcome is engineering rather than science. Clarke did extend the Orlikowski and Baroudi [6] cla- ssification where they proposed three categories of re- search epistemology based on examining large amount of information systems research. These categories are: posi- tivist, interpretive and finally critical where the role of social critique arises. The inductive logic of qualitative studies has been cri- ticised by Popper [7]. According to this logic, the re- searcher starts from an empirical study to collect a real dataset and end with generalising the research findings. Popper pointed out that the inductive study cannot be considered as justified as it is developed on experience. Popper [7] did state that there is a need to define certain “principles of induction” since that statement is “logical- ly justified by another statement”. Based on Creswell, knowledge claimed is an assump- tion related to reaching the outcome of such a study and the knowledge captured. Different alternatives are indi- cated as a knowledge claim according to Creswell [3]. 1) Post positivism is defined as “science” or “scientif- ic” research. It is a deterministic philosophy of investi- gating causes that determine outcome. The Post positivist measures the reality in real world cautiously. A research- er initiates the study with a theory and then uses data collected to accept or reject that theory. 2) Constructivism is based on a subjective involve- ment of researchers; researchers believed to have holistic perspective, which represents a complexity of reality instead of assuming a small set of ideas. They place themselves in the research and employ their background to explain the situation. A participant’s perspective has an obvious role to help de- fine implication’. 3) Participatory approaches assume that the investi- gation should propose an action agenda to address the change needed and argue constructivism approach for that. Cooperation of participants is based on this ap- proach and such participation does extend to involve data collection and the data analysis phases. Visual illustra- tion of the addressed issues coupled with participants and actions needed are developed. 4) Pragmatic approaches where knowledge is cap- tured based on the situation, actions and effects rather than theoretical assumptions applied in post positivism. A mixed method is a combination of closed and open ended measures is commonly employed to understand the problem statement pragmatically. 2.2. Research Used in Accessibility Adams [8] makes the point that today access to informa- tion technology is a prerequisite for full inclusion to so- ciety. A major barrier to this is the ease with which peo- ple can operate computers. This ease of use depends cru- cially on the Human Computer Interface (HCI). Early workers in the field, Newall & Card [9] put forward the view of HCI as a “hard” science. They provided an en- gineering style theory of the user, introducing the GOMS methodology [10]. An example of this in use is given by Parsons et al. [11]. Carroll & Campbell [12] criticized this approach as too empirical and advocated a more tra- ditional scientific approach. With the current availability of eye-tracking and EEG equipment this approach will become more likely than in the past due to the use of this equipment for control of robotic devices [13,14]. The second different view of how the user interacted with the machine was that of a design science, a view promul- gated by Carroll & Campbell [12] who formulated arte- fact theory as an alternative view to Goals, Operations, Methods and Selection (GOMS). Wright & Monk [15] attributed the problem of traditional hypothesis-test ex- periments to the lack of generality of results gained through these methods. They advocated observation as a method. The method is called observation-intervention pairs. This can be seen as a craft based exercise [16]. The third methodology is to see HCI as an engineering dis- cipline [17,18]. In this approach problems are solved by specifying and implementing designs. Such engineering knowledge is formal, codified and operational, defined by a set of engineering principles as in other engineering disciplines. Key ideas that have informed the progress of HCI and accessibility research are the concepts of cognitive sci- ence and the idea that mental models are held by the user [19]. The first engineering model of a human operator was devised by Craik [20] who looked at the use of hu- man control systems. The original work on mental mod- els by Johnson-Laird [21] has now been extended, for example, to provide the Human Processor Model [10], ACT-R [22] and the Queuing Network-Model of the Human Processor [23]. This last model has been used successfully to model human driver response in a driving simulator. These models predict how the operator res- ponds under certain conditions. Detailed measured phys- ical responses can now be used to validate these models. Sasse [16] compares a number of empirical user model studies. Criticism of these studies is mainly about the over-reliance on performance data and a lack of ecologi- cal validity of the findings stemming from the use of ar- 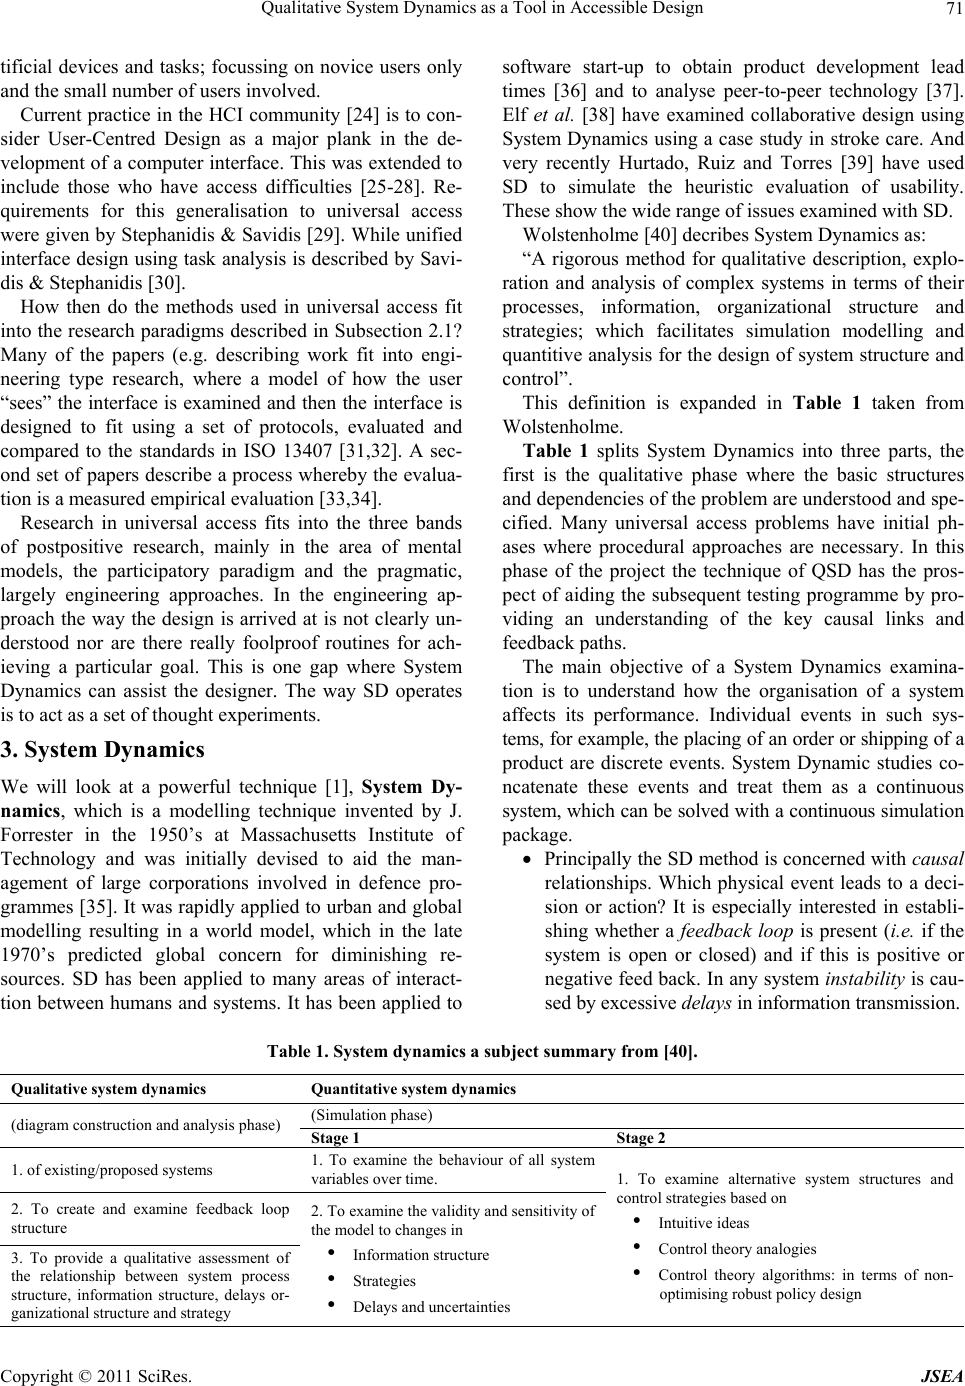 Qualitative System Dynamics as a Tool in Accessible Design Copyright © 2011 SciRes. JSEA 71 tificial devices and tasks; focussing on novice users only and the small number of users involved. Current practice in the HCI community [24] is to con- sider User-Centred Design as a major plank in the de- velopment of a computer interface. This was extended to include those who have access difficulties [25-28]. Re- quirements for this generalisation to universal access were given by Stephanidis & Savidis [29]. While unified interface design using task analysis is described by Savi- dis & Stephanidis [30]. How then do the methods used in universal access fit into the research paradigms described in Subsection 2.1? Many of the papers (e.g. describing work fit into engi- neering type research, where a model of how the user “sees” the interface is examined and then the interface is designed to fit using a set of protocols, evaluated and compared to the standards in ISO 13407 [31,32]. A sec- ond set of papers describe a process whereby the evalua- tion is a measured empirical evaluation [33,34]. Research in universal access fits into the three bands of postpositive research, mainly in the area of mental models, the participatory paradigm and the pragmatic, largely engineering approaches. In the engineering ap- proach the way the design is arrived at is not clearly un- derstood nor are there really foolproof routines for ach- ieving a particular goal. This is one gap where System Dynamics can assist the designer. The way SD operates is to act as a set of thought experiments. 3. System Dynamics We will look at a powerful technique [1], System Dy- namics, which is a modelling technique invented by J. Forrester in the 1950’s at Massachusetts Institute of Technology and was initially devised to aid the man- agement of large corporations involved in defence pro- grammes [35]. It was rapidly applied to urban and global modelling resulting in a world model, which in the late 1970’s predicted global concern for diminishing re- sources. SD has been applied to many areas of interact- tion between humans and systems. It has been applied to software start-up to obtain product development lead times [36] and to analyse peer-to-peer technology [37]. Elf et al. [38] have examined collaborative design using System Dynamics using a case study in stroke care. And very recently Hurtado, Ruiz and Torres [39] have used SD to simulate the heuristic evaluation of usability. These show the wide range of issues examined with SD. Wolstenholme [40] decribes System Dynamics as: “A rigorous method for qualitative description, explo- ration and analysis of complex systems in terms of their processes, information, organizational structure and strategies; which facilitates simulation modelling and quantitive analysis for the design of system structure and control”. This definition is expanded in Table 1 taken from Wolstenholme. Table 1 splits System Dynamics into three parts, the first is the qualitative phase where the basic structures and dependencies of the problem are understood and spe- cified. Many universal access problems have initial ph- ases where procedural approaches are necessary. In this phase of the project the technique of QSD has the pros- pect of aiding the subsequent testing programme by pro- viding an understanding of the key causal links and feedback paths. The main objective of a System Dynamics examina- tion is to understand how the organisation of a system affects its performance. Individual events in such sys- tems, for example, the placing of an order or shipping of a product are discrete events. System Dynamic studies co- ncatenate these events and treat them as a continuous system, which can be solved with a continuous simulation package. Principally the SD method is concerned with causal relationships. Which physical event leads to a deci- sion or action? It is especially interested in establi- shing whether a feedback loop is present (i.e. if the system is open or closed) and if this is positive or negative feed back. In any system instability is cau- sed by excessive delays in information transmission. Table 1. System dynamics a subject summary from [40]. Qualitative system dynamics Quantitative system dynamics (diagram construction and analysis phase) (Simulation phase) Stage 1 Stage 2 1. of existing/proposed systems 1. To examine the behaviour of all system variables over time. 1. To examine alternative system structures and control strategies based on • Intuitive ideas • Control theory analogies • Control theory algorithms: in terms of non- optimising robust policy design 2. To create and examine feedback loop structure 2. To examine the validity and sensitivity of the model to changes in • Information structure • Strategies • Delays and uncertainties 3. To provide a qualitative assessment of the relationship between system process structure, information structure, delays or- ganizational structure and strategy 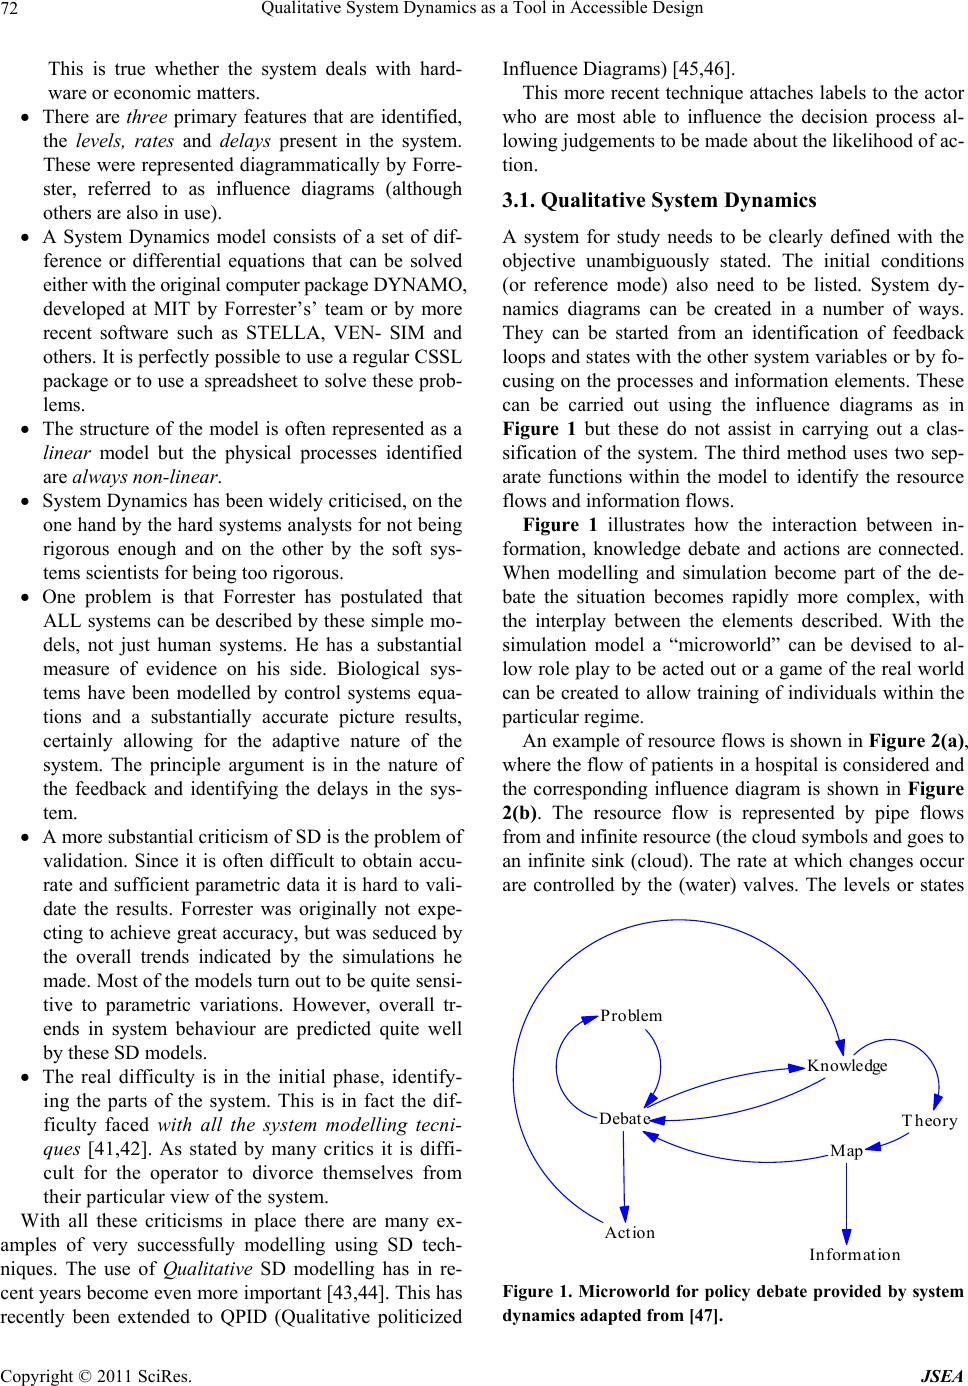 Qualitative System Dynamics as a Tool in Accessible Design Copyright © 2011 SciRes. JSEA 72 This is true whether the system deals with hard- ware or economic matters. There are three primary features that are identified, the levels, rates and delays present in the system. These were represented diagrammatically by Forre- ster, referred to as influence diagrams (although others are also in use). A System Dynamics model consists of a set of dif- ference or differential equations that can be solved either with the original computer package DYNAMO, developed at MIT by Forrester’s’ team or by more recent software such as STELLA, VEN- SIM and others. It is perfectly possible to use a regular CSSL package or to use a spreadsheet to solve these prob- lems. The structure of the model is often represented as a linear model but the physical processes identified are always non-linear. System Dynamics has been widely criticised, on the one hand by the hard systems analysts for not being rigorous enough and on the other by the soft sys- tems scientists for being too rigorous. One problem is that Forrester has postulated that ALL systems can be described by these simple mo- dels, not just human systems. He has a substantial measure of evidence on his side. Biological sys- tems have been modelled by control systems equa- tions and a substantially accurate picture results, certainly allowing for the adaptive nature of the system. The principle argument is in the nature of the feedback and identifying the delays in the sys- tem. A more substantial criticism of SD is the problem of validation. Since it is often difficult to obtain accu- rate and sufficient parametric data it is hard to vali- date the results. Forrester was originally not expe- cting to achieve great accuracy, but was seduced by the overall trends indicated by the simulations he made. Most of the models turn out to be quite sensi- tive to parametric variations. However, overall tr- ends in system behaviour are predicted quite well by these SD models. The real difficulty is in the initial phase, identify- ing the parts of the system. This is in fact the dif- ficulty faced with all the system modelling tecni- ques [41,42]. As stated by many critics it is diffi- cult for the operator to divorce themselves from their particular view of the system. With all these criticisms in place there are many ex- amples of very successfully modelling using SD tech- niques. The use of Qualitative SD modelling has in re- cent years become even more important [43,44]. This has recently been extended to QPID (Qualitative politicized Influence Diagrams) [45,46]. This more recent technique attaches labels to the actor who are most able to influence the decision process al- lowing judgements to be made about the likelihood of ac- tion. 3.1. Qualitative System Dynamics A system for study needs to be clearly defined with the objective unambiguously stated. The initial conditions (or reference mode) also need to be listed. System dy- namics diagrams can be created in a number of ways. They can be started from an identification of feedback loops and states with the other system variables or by fo- cusing on the processes and information elements. These can be carried out using the influence diagrams as in Figure 1 but these do not assist in carrying out a clas- sification of the system. The third method uses two sep- arate functions within the model to identify the resource flows and information flows. Figure 1 illustrates how the interaction between in- formation, knowledge debate and actions are connected. When modelling and simulation become part of the de- bate the situation becomes rapidly more complex, with the interplay between the elements described. With the simulation model a “microworld” can be devised to al- low role play to be acted out or a game of the real world can be created to allow training of individuals within the particular regime. An example of resource flows is shown in Figure 2(a), where the flow of patients in a hospital is considered and the corresponding influence diagram is shown in Figure 2(b). The resource flow is represented by pipe flows from and infinite resource (the cloud symbols and goes to an infinite sink (cloud). The rate at which changes occur are controlled by the (water) valves. The levels or states Problem Debate Action Map Knowledge Theory Inform ation Figure 1. Microworld for policy debate provided by system dynamics adapted from [47]. 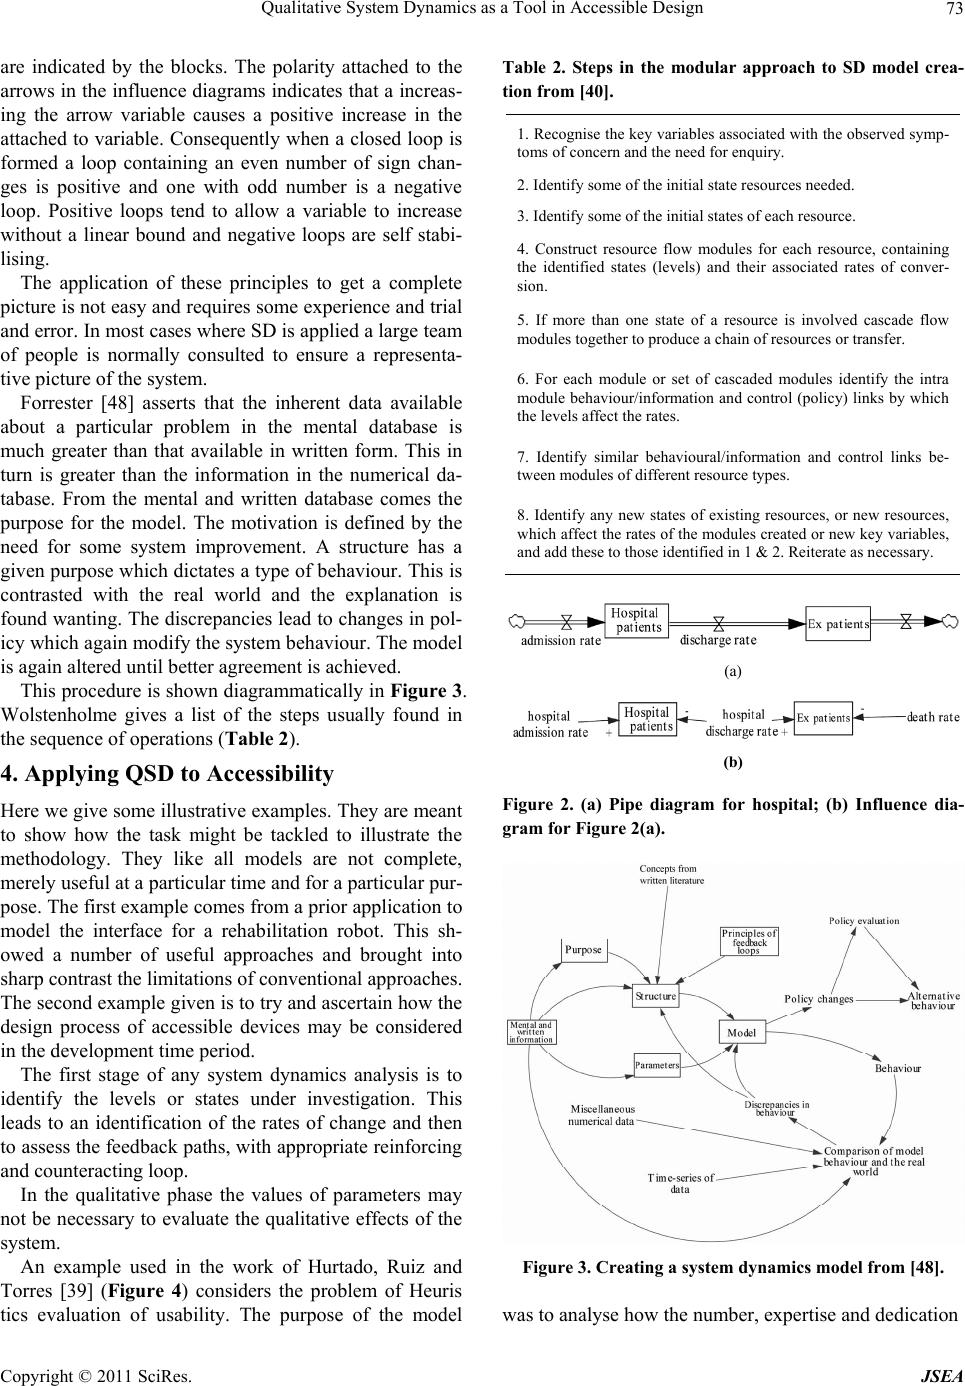 Qualitative System Dynamics as a Tool in Accessible Design Copyright © 2011 SciRes. JSEA 73 are indicated by the blocks. The polarity attached to the arrows in the influence diagrams indicates that a increas- ing the arrow variable causes a positive increase in the attached to variable. Consequently when a closed loop is formed a loop containing an even number of sign chan- ges is positive and one with odd number is a negative loop. Positive loops tend to allow a variable to increase without a linear bound and negative loops are self stabi- lising. The application of these principles to get a complete picture is not easy and requires some experience and trial and error. In most cases where SD is applied a large team of people is normally consulted to ensure a representa- tive picture of the system. Forrester [48] asserts that the inherent data available about a particular problem in the mental database is much greater than that available in written form. This in turn is greater than the information in the numerical da- tabase. From the mental and written database comes the purpose for the model. The motivation is defined by the need for some system improvement. A structure has a given purpose which dictates a type of behaviour. This is contrasted with the real world and the explanation is found wanting. The discrepancies lead to changes in pol- icy which again modify the system behaviour. The model is again altered until better agreement is achieved. This procedure is shown diagrammatically in Figure 3. Wolstenholme gives a list of the steps usually found in the sequence of operations (Table 2). 4. Applying QSD to Accessibility Here we give some illustrative examples. They are meant to show how the task might be tackled to illustrate the methodology. They like all models are not complete, merely useful at a particular time and for a particular pur- pose. The first example comes from a prior application to model the interface for a rehabilitation robot. This sh- owed a number of useful approaches and brought into sharp contrast the limitations of conventional approaches. The second example given is to try and ascertain how the design process of accessible devices may be considered in the development time period. The first stage of any system dynamics analysis is to identify the levels or states under investigation. This leads to an identification of the rates of change and then to assess the feedback paths, with appropriate reinforcing and counteracting loop. In the qualitative phase the values of parameters may not be necessary to evaluate the qualitative effects of the system. An example used in the work of Hurtado, Ruiz and Torres [39] (Figure 4) considers the problem of Heuris tics evaluation of usability. The purpose of the model Table 2. Steps in the modular approach to SD model crea- tion from [40]. 1. Recognise the key variables associated with the observed symp- toms of concern and the need for enquiry. 2. Identify some of the initial state resources needed. 3. Identify some of the initial states of each resource. 4. Construct resource flow modules for each resource, containing the identified states (levels) and their associated rates of conver- sion. 5. If more than one state of a resource is involved cascade flow modules together to produce a chain of resources or transfer. 6. For each module or set of cascaded modules identify the intra module behaviour/information and control (policy) links by which the levels affect the rates. 7. Identify similar behavioural/information and control links be- tween modules of different resource types. 8. Identify any new states of existing resources, or new resources, which affect the rates of the modules created or new key variables, and add these to those identified in 1 & 2. Reiterate as necessary. (a) (b) Figure 2. (a) Pipe diagram for hospital; (b) Influence dia- gram for Figure 2(a). Figure 3. Creating a system dynamics model from [48]. was to analyse how the number, expertise and dedication  Qualitative System Dynamics as a Tool in Accessible Design Copyright © 2011 SciRes. JSEA 74 of evaluators affects the behaviour of the method over time, producing a single set of detected usability prob- lems. The qualitative part of the SD model illustrates the reinforcing and balancing loops found in the method. The principal result of the numerical evaluation is a limit to the problems that can be found. Overall the simulation allows the investigators to try out the effects of different decision processes on the overall success. 4.1. Human Monitoring of Automation A qualitative model [49] (Figure 5) was used to inform a research programme in rehabilitation robotics. 1) Recognise the key variables associated with the ob- served symptoms of concern and the need for enquiry. The main requirement is overall system reliability. This has main contributions from the machine reliability, which can be designed into the system and human super- visory capability (HSC). Both of these contribute posi- tively to the overall system capability. HSC is itself a function of mental workload, stress and, as we have seen above, on the length of time since the last machine fail- ure. As this time increases the HSC deteriorates. The main purpose was to evaluate how the various machine and human attributes affected the over-all reliability. Some progress was made in the direction of obtaining quantitative data. 2) Identify some of the initial state resources needed. The mental workload depends on external inputs (EI); the lack of a good model (LGM); human produced noise (HPN); lack of interpretation of criteria (LIC); human motor noise (HMN) and variable system properties (VSP). All of these contribute positively to mental workload. 3) Identify some of the initial states of each resource. The initial condition of the operator is that they are fresh and coping with the pressure. The model examines how this condition is changed. Stress contributes to the increase of motor noise as does fatigue. Fatigue also in- creases human produced noise. Training can reduce the effects of a poor mental model of the system. Fatigue is increased by time on the job and by an excessive previ- ous work pattern. 4) Construct resource flow modules for each re- source, containing the identified states (levels) and their associated rates of conversion. The overall model is shown in Figure 5. The model is constructed top down from the required main problem system reliability. 5) If more than one state of a resource is involved cascade flow modules together to produce a chain of resources or transfe r. 6) For each module or set of cascaded modules iden- tify the intra module behaviour/information and control (policy) links by which the levels a ffect the rates. This could not be achieved totally in this case due to incomplete information, but could lead to a succession of relevant experiments. 7) Identify similar behavioural/information and con- trol links between modules of different resource types. All the factors that affect mental workload affect it in the same way increasing the load either by human motor noise or vigilance effects for example. 8) Identify any new states of existing resources, or new resources, which affect the rates of the modules created or new key variables, and add these to those identified in 1 & 2 Reiterate as necessary. Good design is an example of an addition to the origi- nal concepts used elsewhere. It is a design that provides an effective working system for the user and may have greater commercial benefit as well as being sustainable. Good design is improved by comprehensive require- ments while good design reduces the effects of poor dis- play and reduces conflicting tasks. In turn these increase LIC and HPN respectively. Good design reduces variable system properties and is informed by human supervisory capabilities. This model provides a series of pathways to enable system designers to see how parts of the system interact with one another. How could this model be developed further? Some of the pathways have no data as yet that could be used to provide a numerical model. The effect of excessive work and of cumulative time on the job on fatigue is fairly well studied and could be represented. The higher level elements of this model have consid- erable work already produced as detailed in [50]. Training can alter mental models and some dynamic data is available [51]. Experimental data required Problem aggregation limit Problem single proportion variable costs Number of evaluators Usability problems found Ev aluation capacity Usability problems to be found Ev aluato rs expertise + + + + + + + + + - overlapp ing - + + Figure 4. Heuristic model of hurtado et al.. [39].  Qualitative System Dynamics as a Tool in Accessible Design Copyright © 2011 SciRes. JSEA 75 Figure 5. Human monitoring of automation QSD model. These include the effect of design on workload para- meters and the effect of good design on variable system properties. The effect of poor displays is well known for static cases but not well studied for dynamic case. 4.2. Researcher/User Interaction with Accessibility Design The initial phase of any product development life-cycle- consists of the birth of the idea, which is the recognition that a potential product can satisfy some underlying need of society. What follows is based on the pioneering work of Roberts [52]. The user need for a product relates first to the satisfaction of physical needs of the user and later to their psychological needs. The usefulness of any pro- duct (and the ideas behind it) varies with time (Figure 6). Prior to some point in time there is no perceived need for that product. Researchers and other decision makers possess know- ledge that they have gained from the outside world (Fig- ure 7). This information is distorted, biased and de- layed by the environment. In addition to this it may take them some time to reach a point where they can make sense of this information. In dealing with this problem, we have to allow for the whole psychological nature of perception. What may be a good idea for one person may be so appealing to another. It is not just a factor of the environment but also of their past experience and their needs, goals and capabilities. Any organisation or indi- viduals’ perception of the need for a concept depends on the ideas intrinsic value. However that is measured. Al- though the new concept may be developed and a working product developed from this research it may not be ac- cepted by the user, certainly not immediately. In this version of the process we were interested in the effect of timing of user feedback on the design process and whether we could obtain any measure of the impor- tance of such timing. Initially the research has not been done and a concept is not there to be turned into a use- able product. The two parts of the process are related since they deal with how people respond to situations, in this case the reaction to a perceived problem (Figure 7) and proposed solutions (Figure 8). These are connected by the design process which can be simply modelled as in Figure 9. The researcher has a level of recognition of the pro- blem value. This is increased by the rate of recognition of Figure 6. Underlying need for a product.  Qualitative System Dynamics as a Tool in Accessible Design Copyright © 2011 SciRes. JSEA 76 Figure 7. QSD model of researcher perception. Figure 8. QSD model of user perception. Figure 9. QSD model of relation of design to researcher and user perception.  Qualitative System Dynamics as a Tool in Accessible Design Copyright © 2011 SciRes. JSEA 77 the problem value (in whatever measures we wish to use). This rate of change is informed by the intrinsic value of the problem (in this case the problem of accessibility to the computer), and by the level itself. There is a delay in the recognition process, which varies from researcher to researcher and from problem to problem. A projected fu- ture value of the problem, for example depending on the number of likely users and what legislation may come into force depends on the existing level and on the proje- ction horizon of the researcher. This itself depends on the willingness of the researcher to accept risks and to the planning period, may be the next grant period only but may be a national trend decision. This leads to an esti- mated future value of the problem as recognized by the researcher after a delay. The level of the current solution value by the user in Figure 7 is increased by the rate of recognition, which it- self is dependent on the capability of the user, a function of training, and the level appreciated by the user with a delay. This affects the projected future solution value by the user. This depends on the projected horizon of the user, a function of the users’ willingness to accept risk and the awareness period of the user. The estimated future value of the solution as appreci- ated by the user is subject to a further delay due to the time it takes to recognise the benefits of the solution. When the researcher (Figure 9) has recognised the problem the designer, if it is the same person will de- velop design solutions at a rate dependent on the level of the original value, the design experience of the designer, the standards appertaining and feedback from the users, all subject to delays in recognising these effects. Only a fraction of the virtues of these solutions are recognised by the user and it will take some time before these vir- tues become apparent. 4.3. Lessons to be Learned from the Models The full value of the problem may never be recognised by the researcher if the delay is too large. The real value of the problem may never become apparent if the plan- ning horizon of the researcher is too limited by a short planning period or if they are unwilling to take sufficient risks. Our appreciation of real research targets may be unrealised by too short project deadlines. The user on the other hand may not be able to appreciate the solution if their capability is too limited. This can be improved with the right sort and timeliness of training. The delay can be reduced with regular updates of information to the user community from researchers. The full potential of the proposed solution can be disseminated to the user by ex- panding their horizon, by education and community sup- port. The solution model proposed in Figure 8 implies that the solution is only generated after the problem has been fully recognised. This means that early information feed- back from the users will allow for a more rapid and com- plete generation of solutions. Staring to generate solu- tions before the problem is fully appreciated may gener- ate fuller solutions but may in fact hinder the gen- eration of a better i.e. more complete solution. This would need to be numerically modelled to answer the question fully. 5. Procedure for QSD in Accessibility The following section lays out the practical approach to Qualitative Systems Dynamics that can be used in acces- sibility research. Two very useful books by Anderson & Johnson [53] and by Kim [54] may be consulted to gain further insight. Define the accessibility problem to be solved. Decide which variables best describe the problem under consideration; list them all as far as you can ascertain their influence. Use nouns as far as possible and be positive or neu- tral rather than negative to allow the right sense of influence to be decided (e.g. attention span; visual acuity). Identify how these variable influence/interact with each other to affect the problem specified. Identify reinforcing loops or stabilising loops beha- viour within the system. Select a time horizon and visualise how these va- riables might behave over time. Sketch the likely responses. Compare this with any evidence you have about the way the problem is recognized. Iterate the connections and effects until you are confident you have identified key parameters and connective behaviour. Examine “what if” choices that may be possible to remove or improve the problem. 6. Why should We Use Qualitative System Dynamics and What does it Offer Universal Access The first reason is that it offers a unique perspective on the process of understanding the problem, particularly allowing the practitioner to explain their ideas to the user [55]. This approach can eliminate possible design solutions before considerable effort has been spent on them. It can lead to a shared group understanding of the is- sues from both the practitioners and customer focus us- ing a diagrammatic form that is easily understood by all. Richardson and Andersen [56] give examples of how this is achieved in practice for social problems. This last point seems to the author as the crucial aspect  Qualitative System Dynamics as a Tool in Accessible Design Copyright © 2011 SciRes. JSEA 78 missing from rival schemes of deriving usability models such as cognitive walkthroughs. These issues of under- standing the customer focus rely normally on how well the designer can explain their concepts before they have really understood the problem. Often users feel they have not been able to part of the problem analysis and there- fore do not take ownership of the solutions offered. To sum up: QSD has a common core of concepts applicable to all universal access problems i.e. the idea of stocks, flows and feedback with the relevant causal relationships. This will lead practitioners to develop expertise by repetition of process applied to different examples in universal ac- cess, using a common methodology. It shares communication directly with the user or im- portant stakeholders, a key concept in the failure of many examples of current practice in IT. It allows identification, uniquely, as a routine, of the unintended consequences. It facilitates subsequent quantitative modelling to mea- sure performance if required. 7. Conclusions All problems that require solving have time effects. The main feature of QSD is that the perceived measures of an idea or concept have to be considered when examining how these ideas can be implemented. What has been illu- strated here is that the techniques of Qualitative System Dynamics can be used in problems such as accessibility with the benefit of allowing various policy decisions to be investigated. Simple time dependent models of re- search can be proposed that will allow parameters to be investigated in a rigorous causal methodology. The ex- amples shown here illustrate some simple decisions that can be taken to improve the accessibility of interface de- sign. REFERENCES [1] J. Mingers and L. White, “A Review of the Recent Con- tribution of Systems Thinking to Operational Research and Management,” 2009. http://www.kar.kent.ac.uk/2231 2/1/EJOR_system_Apr_6_sent.doc [2] R. L. Flood and M. C. Jackson, “Creative Problem Solv- ing,” Wiley, Chichester, 1991. [3] J. W. Creswell, “Research Design: Qualitative, Quantita- tive and Mixed Methods Approaches,” Sage Publications, Thousand Oaks, 2003. [4] M. Crotty, “Foundations of Social Research: Meaning and Perspective in the Research Process,” Sage, Thou- sand Oaks, 1998. [5] R. Clarke, “Appropriate Research Methods for Electronic Commerce,” 2007. http://www.anu.edu.au/people/Roger. Clarke/EC/ResMeth.html [6] W. J. Orlikowski and J. J. Baroudi, “Studying Informa- tion Technology in Organizations: Research Approaches and Assumptions,” Information Systems Research, Vol. 2, 1991, pp. 1-28. [7] K. Popper, “The Logic of Scientific Discovery,” Taylor and Francis, United Kingdom, 2008. [8] R. Adams, “Decision and Stress: Cognition and E-Acce- ssibility in the Information Workplace,” Universal Access in the Information Society (UAIS), Vol. 5, 2007, pp. 363- 379. doi:10.1007/s10209-006-0061-9 [9] A. Newell and S. K. Card, “The Prospects for Psycholog- ical Science in Human-Computer Interaction,” Hu- man-Computer Interaction, Vol. 1, No. 3, September 1985, pp. 209-242. doi:10.1207/s15327051hci0103_1 [10] S. Card, T. P. Moran and A. Newell, “The Psychology of Human Computer Interaction,” Lawrence Erlbaum, Hills- dale, 1983. [11] B. Parsons, A. White, P. Warner and R. Gill, “Validation Methods for an Accessible User Interface for a Rehabili- tation Robot,” Universal Access in the Information So- ciety (UAIS), Vol. 5, No. 3, October 2006, pp. 306-324. doi: 10.1007/s10209-006-0051-y [12] J. M. Carroll and R. L. Campbell, “Artifacts as Psycho- logical Theories: The Case of Human Computer Interac- tion,” Behaviour and Information Technology, Vol. 8, 1989, pp. 247-256. [13] F. Popescu, Y. Badower, S. Fazli, G. Dornhege and K. Müller, “EEG-Based Control of Reaching to Visual Tar- gets,” Dynamical Principles for Neuroscience and Intelli- gent Biomimetic Devices—Abstracts of the EPFL-LATSIS Symposium, 2006, pp. 123-124. [14] T. Carlson and Y. Demeris, “Using Visual Attention to evaluate Collaborative Control Architectures for Human Robot Interaction,” Proceedings of New Frontiers in Human Robot Interaction, ASIB Edinburgh, 2009, pp. 38-43. [15] P. C. Wright and A. F. Monk, “A Cost-Effective Evalua- tion Method for Use by Designers,” International Journal of Man-Machine Studies, Vol. 35, No. 6, December 1991, pp. 891-912. doi:10.1016/S0020-7373(05)80167-1 [16] M. A. Sasse, “Eliciting and Describing Users’ Models of Computer Systems,” Ph.D. Thesis, University of Bir- mingham, Birmingham, 1997. [17] W. B. Rouse, “Human-Computer Interaction in the Con- trol of Dynamic Systems,” Computing Surveys, Vol. 13, No.1, 1981, pp. 71-99. doi:10.1145/356835.356839 [18] J. Long and J. Dowell, “Conceptions of the Discipline of HCI: Craft, Applied Science, and Engineering,” Pro- ceedings of the fifth Conference of the British Computer Society, Human-Computer Interaction Specialist Group on People and Computers V, February 1990, Nottingham, pp. 9-32. [19] R. Adams, “User Modelling & Monitoring,” In: C. Ste- phanidis, Ed., The Universal Access Handbook, CRC Press Taylor & Francis Group, New York, June 2009. [20] K. Craik, “Theory of the Human Operator in Control Sys-  Qualitative System Dynamics as a Tool in Accessible Design Copyright © 2011 SciRes. JSEA 79 tems1: The Operator as a Human System,” British Jour- nal of Psychology, Vol. 38, 1947, pp. 56-61. [21] P. N. Johnson-Laird, “Mental Models,” Cambridge Uni- versity Press, Cambridge, 1983. [22] J. R. Anderson and C. Lebiere, “Atomic Components of Thought,” Lawrence Erlbaum, Hillsdale, 1998. [23] Y. Liu, R. Feyen and O. Tsimhoni, “Queuing Network- Model Human Processor (QN_MHP): A Computational Architecture for Multitasking Performance in Human- Machine Systems,” ACM Transactions on Computer- Human Interaction, Vol. 13, No. 1, 2006, pp. 37-70. [24] J. Preece, “Human-Computer Interaction,” Addison- Wesley, Reading, 1999. [25] B. Shneiderman, “Universal Usability,” Communications of the ACM, Vol. 43, No. 5, May 2000, pp. 85-91. doi:10. 1145/332833.332843 [26] A. Newell and P. Gregor, “User Sensitive Inclusive De- sign—In Search of a New Design,” Proceedings on the 2000 Conference on Universal Usability (CUU’00), 2000, pp. 39-44. doi:10.1145/355460.355470 [27] S. Stephanidis, “User Interfaces for All: New Perspe- ctives into Human-Computer Interaction,” In: C. Stepha- nidis, Ed., User Interfaces for All—Concepts, Methods, and Tools, Lawrence Erlbaum Associates, Mahwah, 2001, pp. 3-17. [28] P. Gregor and P. A. Newell, “Designing for Dynamic Di- versity-Making Accessible Interfaces for Older People,” WUAUC’01, Portugal, 2001, pp.90-92. [29] S. Stephanidis and A. Savidis, “Universal Access in the Information Society,” Universal Access in the Informa- tion Society (UAIS), Vol. 1, No. 1, 2001, pp. 40-55. [30] A. Savidis and C. Stephanidis, “Unified User Interface Design: Designing Universally Accessible Interactions,” Interacting with Computers, Vol. 16, No. 2, April 2004, pp. 243-270. doi:10.1016/j.intcom.2003.12.003 [31] A. Newell, A. Dickinson, M. J. Smith and P. Gregor, “Designing a Portal for Older Users: A Case Study of an Industrial/Academic Collaboration,” ACM Transactions on Computer-Human Interaction, Vol. 13, No. 3, Sep- tember 2006, pp. 347-375. doi:10.1145/1183456.1183459 [32] M. Vigo, A. Kobsa, M. Arrue and J. Abascal, “User- Tailored Web Accessibility Evaluations,” Proceedings of the eighteenth conference on Hypertext and hypermedia (HT’07), Manchester, 10-12 September 2007, pp. 95-104. doi:10.1145/1286240.1286267 [33] D. J. Ward and D. J. C. Mackay, “Fast Hands-Free Writ- ing by Gaze Direction,” Nature, Vol. 418, 2002, pp. 838- 840. doi:10.1038/418838a [34] T. Lang, “Comparing Website Accessibility Evaluation Methods and Learning’s from Usability Evaluation Me- thods,” 2003. http://www.peakusability.com.au/pdf/ web- site-accessibility.pdf [35] J. Forrester, “Industrial Dynamics,” MIT Press, Boston, 1961. [36] O. Hilmola, P. Helo and L. Ojala, “The Value of Product Development Lead Time in Software Startup,” System Dynamics Review, Vol. 19, No. 1, 2003, pp. 75-82. doi:10. 1002/sdr.255 [37] O. Pavlov and K. Saeed, “A Resource-Based Analysis of Peer-to-Peer Technology,” System Dynamics Review, Vol. 20, No. 3, 2004, pp. 237-262. doi:10.1002/sdr.297 [38] M. Elf, M. Putilova, L. von Koch and K. Őhrn, “Using System Dynamics for Collaborative Design: A Case Study,” BMC Health Service Research, Vol. 7, 2007, pp. 123. doi:10.1186/1472-6963-7-123 [39] N. Hurtado, M. Ruiz and J. Torres, “Using a Dynamic Model to Simulate the Heuristic Evaluation of Usability,” Human Computer Interaction—Interact 2009, Vol. 5727, 2009, pp. 912-915. doi: 10.1007/978-3-642-03658- 3_109 [40] E. F. Wolstenholme, “A Current Overview of System Dy- namics,” Transactions of the Institute of Measurement and Control, Vol. 114, No. 4, 1989, pp. 171-179. doi:10.1177/ 014233128901100402 [41] M. Pidd, “Computer Simulation,” Wiley, Chichester, 1998. [42] T. Cooper, “Critical Management, Critical Systems The- ory and System Dynamics,” Systemic Practice & Action Research, Vol. 5, No. 3, June 2003, pp. 237-249. [43] E. F. Wolstenholme, “System Enquiry,” Wiley, Chi- chester, 1990. [44] R. G. Coyle, “Qualitative and Quantitative Modelling in System Dynamics: Some Research Questions,” System Dynamics Review, Vol. 16, No. 3, 2000, pp. 225-244. doi:10.1002/1099-1727(200023)16:3<225::AID-SDR195 >3.0.CO;2-D [45] J. H. Powell and J. Bradford, “The Security-Strategy In- terface: Using Qualitative Process Models to Relate the Security Function to 0 Business Dynamics,” Security Journal, Vol. 10, 2003, pp. 151-160. doi:10.1016/S0955- 1662(98)00020-4 [46] W. G. Liddell and J. H. Powell, “Agreeing Access Policy in a General Medical Practice: A Case Study,” System Dynamics Revi ew, Vol. 20, No. 1, 2004, pp.49-75. doi:10. 1002/sdr.283 [47] J. Morecroft, “Strategic Microworlds and System Dyna- mics Modelling,” Transactions of the Institute of Mea- surement and Control, Vol. 114, No. 4, 1989, pp. 180-186. doi:10.1177/014233128901100403 [48] J. Forrester, “Policies, Decisions and Information Sources for Modelling,” European Journal of Operational Re- search, Vol. 59, 1992, pp. 42-63. doi:10.1016/0377-2217 (92)900 06-U [49] A. S. White, “A Qualitative Systems Dynamic Model of Human Monitoring of Automated Systems,” Proceedings of the System Dynamics Conference, 2003. [50] R. Parasuraman, “Vigilance, Monitoring and Search,” In: Boff, Kaufman, Thomas, Eds, Handbook of Perception and Human Performance, Wiley, New York, 1986. [51] J. D. Lee and T. F. Sanquist, “Maritime Automation,” In: R. Parasuraman, M. Mouloua, Eds., Automation and Human Performance, Erlbaum, 1996. [52] E. B. Roberts, “The Dynamics of Research and Devel-  Qualitative System Dynamics as a Tool in Accessible Design Copyright © 2011 SciRes. JSEA 80 opment,” Harper & Row, New York, 1964. [53] V. Anderson and L. Johnson, “Systems Thinking Basics,” Pegasus, Cambridge, 1997. [54] D. H. Kim, “Systems Thinking Tools,” Pegasus, Cam- bridge, 2000. [55] E. F. Wolstenholme, “Qualitative v. Quantitative Modell- ing: The Evolvolving Balance,” International Systems Dynamics Conference, 1998. http://www.Systemdynamics. org/conferences/1998/PROCEED/00071.PDF [56] G. P. Richardson and D. F. Andersen, “Teamwork in Group Model Building,” 1995. http:// www.albany.edu/~ gpr/Teamwork.pdf |