Paper Menu >>
Journal Menu >>
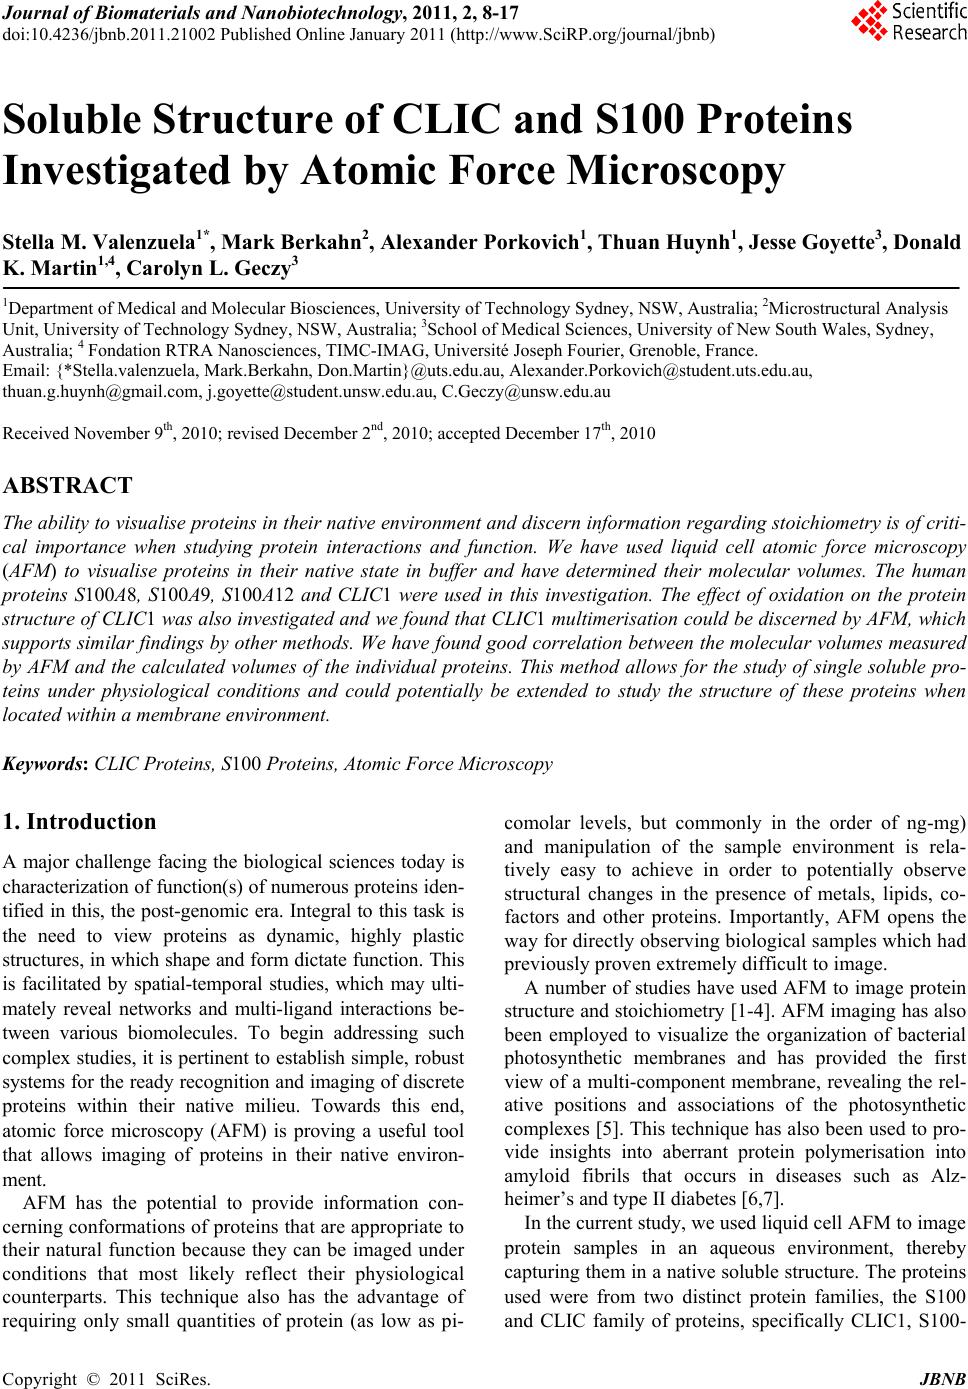 Journal of Biomaterials and Nanobiotechnology, 2011, 2, 8-17 doi:10.4236/jbnb.2011.21002 Published Online January 2011 (http://www.SciRP.org/journal/jbnb) Copyright © 2011 SciRes. JBNB Soluble Structure of CLIC and S100 Proteins Investigated by Atomic Force Microscopy Stella M. Valenzuela1*, Mark Berkahn2, Alexander Porkovich1, Thuan Huynh1, Jesse Goyette3, Donald K. Martin1,4, Carolyn L. Geczy3 1Department of Medical and Molecular Biosciences, University of Technology Sydney, NSW, Australia; 2Microstructural Analysis Unit, University of Technology Sydney, NSW, Australia; 3School of Medical Sciences, University of New South Wales, Sydney, Australia; 4Fondation RTRA Nanosciences, TIMC-IMAG, Université Joseph Fourier, Grenoble, France. Email: {*Stella.valenzuela, Mark.Berkahn, Don.Martin}@uts.edu.au, Alexander.Porkovich@student.uts.edu.au, thuan.g.huynh@gmail.com, j.goyette@student.unsw.edu.au, C.Geczy@unsw.edu.au Received November 9th, 2010; revised December 2nd, 2010; accepted December 17th, 2010 ABSTRACT The ability to visualise proteins in their native environment and discern information regarding stoichiometry is of criti- cal importance when studying protein interactions and function. We have used liquid cell atomic force microscopy (AFM) to visualise proteins in their native state in buffer and have determined their molecular volumes. The human proteins S100A8, S100A9, S100A12 and CLIC1 were used in this investigation. The effect of oxidation on the protein structure of CLIC1 was also investigated and we found that CLIC1 multimerisation could be discerned by AFM, which supports similar findings by other methods. We have found good correlation between the molecular volumes measured by AFM and the calculated volumes of the individual proteins. This method allows for the study of single soluble pro- teins under physiological conditions and could potentially be extended to study the structure of these proteins when located within a membrane environment. Keywords: CLIC Proteins, S100 Proteins, Atomic Force Microscopy 1. Introduction A major challenge facing the biological sciences today is characterization of function(s) of numerous proteins iden- tified in this, the post-genomic era. Integral to this task is the need to view proteins as dynamic, highly plastic structures, in which shape and form dictate function. This is facilitated by spatial-temporal studies, which may ulti- mately reveal networks and multi-ligand interactions be- tween various biomolecules. To begin addressing such complex studies, it is pertinent to establish simple, robust systems for the ready recognition and imaging of discrete proteins within their native milieu. Towards this end, atomic force microscopy (AFM) is proving a useful tool that allows imaging of proteins in their native environ- ment. AFM has the potential to provide information con- cerning conformations of proteins that are appropriate to their natural function because they can be imaged under conditions that most likely reflect their physiological counterparts. This technique also has the advantage of requiring only small quantities of protein (as low as pi- comolar levels, but commonly in the order of ng-mg) and manipulation of the sample environment is rela- tively easy to achieve in order to potentially observe structural changes in the presence of metals, lipids, co- factors and other proteins. Importantly, AFM opens the way for directly observing biological samples which had previously proven extremely difficult to image. A number of studies have used AFM to image protein structure and stoichiometry [1-4]. AFM imaging has also been employed to visualize the organization of bacterial photosynthetic membranes and has provided the first view of a multi-component membrane, revealing the rel- ative positions and associations of the photosynthetic complexes [5]. This technique has also been used to pro- vide insights into aberrant protein polymerisation into amyloid fibrils that occurs in diseases such as Alz- heimer’s and type II diabetes [6,7]. In the current study, we used liquid cell AFM to image protein samples in an aqueous environment, thereby capturing them in a native soluble structure. The proteins used were from two distinct protein families, the S100 and CLIC family of proteins, specifically CLIC1, S100- 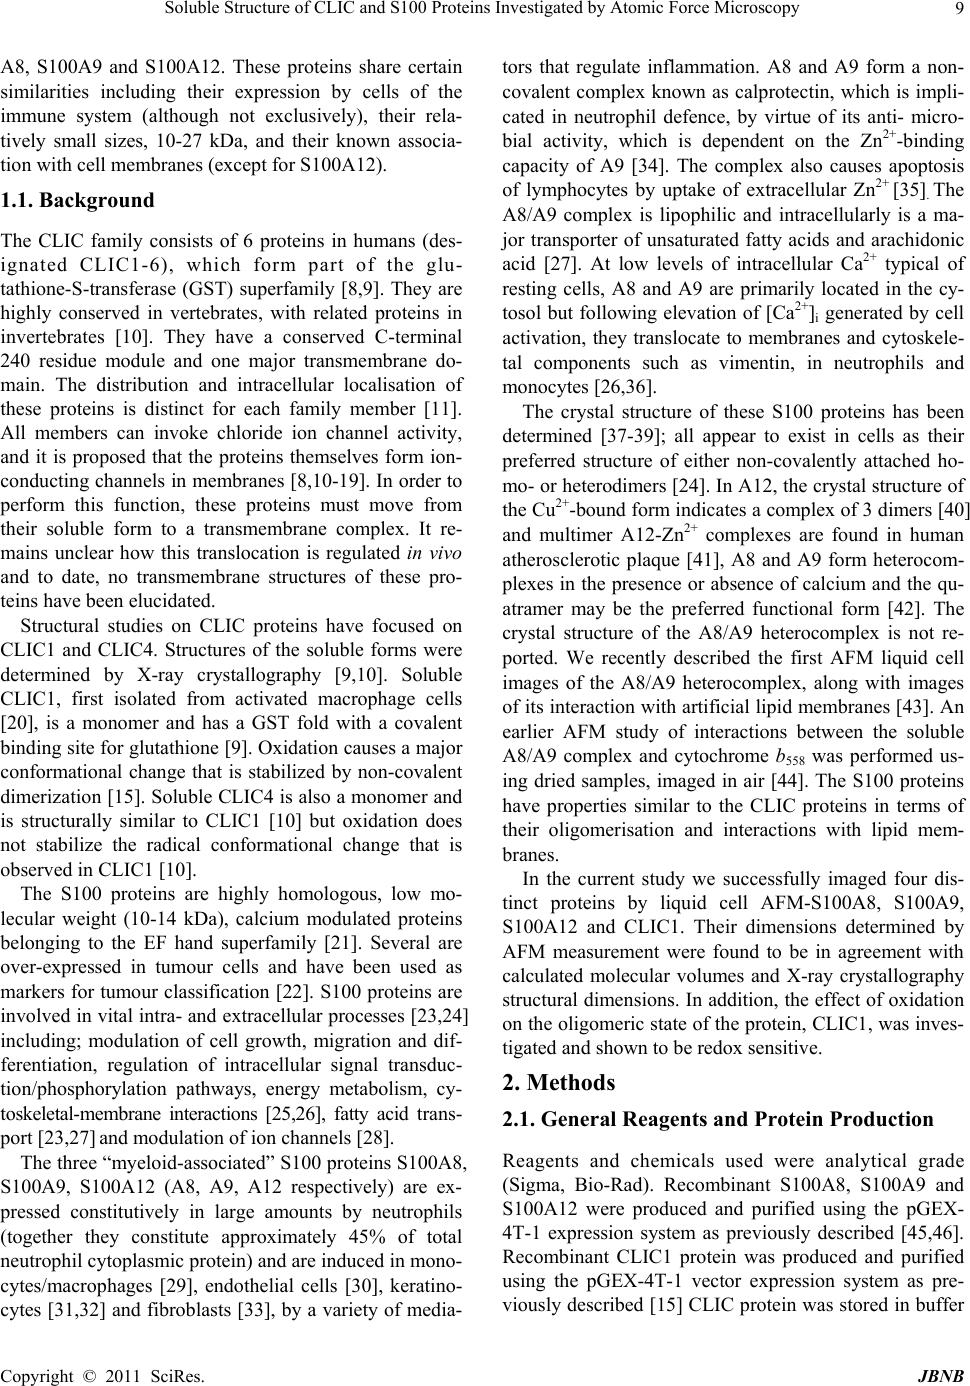 Soluble Structure of CLIC and S100 Proteins Investigated by Atomic Force Microscopy Copyright © 2011 SciRes. JBNB 9 A8, S100A9 and S100A12. These proteins share certain similarities including their expression by cells of the immune system (although not exclusively), their rela- tively small sizes, 10-27 kDa, and their known associa- tion with cell membranes (except for S100A12). 1.1. Background The CLIC family consists of 6 proteins in humans (des- ignated CLIC1-6), which form part of the glu- tathione-S-transferase (GST) superfamily [8,9]. They are highly conserved in vertebrates, with related proteins in invertebrates [10]. They have a conserved C-terminal 240 residue module and one major transmembrane do- main. The distribution and intracellular localisation of these proteins is distinct for each family member [11]. All members can invoke chloride ion channel activity, and it is proposed that the proteins themselves form ion- conducting chan nels in membranes [8,10-19]. I n order to perform this function, these proteins must move from their soluble form to a transmembrane complex. It re- mains unclear how this translocation is regulated in vivo and to date, no transmembrane structures of these pro- teins have been elucidated. Structural studies on CLIC proteins have focused on CLIC1 and CLIC4. Structures of the soluble forms were determined by X-ray crystallography [9,10]. Soluble CLIC1, first isolated from activated macrophage cells [20], is a monomer and has a GST fold with a covalent binding site for glutathione [9]. Oxidation causes a major conformational change that is stabilized by non-covalent dimerization [15]. Soluble CLIC4 is also a monomer and is structurally similar to CLIC1 [10] but oxidation does not stabilize the radical conformational change that is observed in CLIC1 [10]. The S100 proteins are highly homologous, low mo- lecular weight (10-14 kDa), calcium modulated proteins belonging to the EF hand superfamily [21]. Several are over-expressed in tumour cells and have been used as markers for tumour classification [22]. S100 proteins are involved in vital intra- and extracellular processes [23,24] including; modulation of cell growth, migration and dif- ferentiation, regulation of intracellular signal transduc- tion/phosphorylation pathways, energy metabolism, cy- toskeletal-membrane interactions [25,26], fatty acid trans- port [23,27] and modulation of ion channels [28]. The three “myeloid-associated” S100 proteins S100A8, S100A9, S100A12 (A8, A9, A12 respectively) are ex- pressed constitutively in large amounts by neutrophils (together they constitute approximately 45% of total neutrophil cytoplasmic protein) and are induced in mono- cytes/macrophages [29], endothelial cells [30], keratino- cytes [31,32] and fibroblasts [33], by a variety of media- tors that regulate inflammation. A8 and A9 form a non- covalent complex known as calprotectin, which is impli- cated in neutrophil defence, by virtue of its anti- micro- bial activity, which is dependent on the Zn2+-binding capacity of A9 [34]. The complex also causes apoptosis of lymphocytes by uptake of extracellular Zn2+ [35]. The A8/A9 complex is lipophilic and intracellularly is a ma- jor transporter of unsaturated fatty acids and arachidonic acid [27]. At low levels of intracellular Ca2+ typical of resting cells, A8 and A9 are primarily located in the cy- tosol but following elevation of [Ca2+]i generated by cell activation, they translocate to membranes and cytoskele- tal components such as vimentin, in neutrophils and monocytes [26,36]. The crystal structure of these S100 proteins has been determined [37-39]; all appear to exist in cells as their preferred structure of either non-covalently attached ho- mo- or heterodimers [24]. In A12, the crystal structure of the Cu2+-bound form indicates a complex of 3 dimers [40] and multimer A12-Zn2+ complexes are found in human atherosclerotic plaque [41], A8 and A9 form heterocom- plexes in the presence or absence of calcium and the qu- atramer may be the preferred functional form [42]. The crystal structure of the A8/A9 heterocomplex is not re- ported. We recently described the first AFM liquid cell images of the A8/A9 heterocomplex, along with images of its interaction with artificial lipid membranes [43]. An earlier AFM study of interactions between the soluble A8/A9 complex and cytochrome b558 was performed us- ing dried samples, imaged in air [44]. The S100 proteins have properties similar to the CLIC proteins in terms of their oligomerisation and interactions with lipid mem- branes. In the current study we successfully imaged four dis- tinct proteins by liquid cell AFM-S100A8, S100A9, S100A12 and CLIC1. Their dimensions determined by AFM measurement were found to be in agreement with calculated molecular volumes and X-ray crystallography structural dimensions. In addition, the effect of oxidation on the oligomeric state of the protein, CLIC1, was inves- tigated and shown to be redox sen sitive. 2. Methods 2.1. General Reagents and Protein Production Reagents and chemicals used were analytical grade (Sigma, Bio-Rad). Recombinant S100A8, S100A9 and S100A12 were produced and purified using the pGEX- 4T-1 expression system as previously described [45,46]. Recombinant CLIC1 protein was produced and purified using the pGEX-4T-1 vector expression system as pre- viously described [15] CLIC protein was stored in buffer  Soluble Structure of CLIC and S100 Proteins Investigated by Atomic Force Microscopy Copyright © 2011 SciRes. JBNB 10 containing 1 mM of the reducing agent dithiothreitol (DTT). 2.2. Atomic Force Microscopy All images were acquired in buffer at room temperature using a Nanoscope IIIA MultiMode AFM equipped with an Extender™ electronics module (Veeco Instruments, Santa Barbara, CA, USA). An E type scanner was used, having a maximum scan area of 12.5 µm2 and vertical height range of 3.4 µm. The NP-S series of narrow- legged, V-shaped, 100 µm long oxide-sharpened silicon nitride cantilevers, with integrated tips (Veeco Instru- ments) and a nominal spring constant, k, of 0.36 N/m were used. The AFM was driven in ‘Tapping mode™’ (TM-AFM) at the typical cantilever resonance frequency (near 9 kHz) in a liquid cell environment at ambient temperature. The piezo Z range was reduced to around 500 nm whilst scanning. The scan speeds ranged from 1 to 4 Hz with high gains deployed throughout. The Mul- tiMode AFM is isolated from acoustic noise by an isola- tion chamber and from mechanical vibration by bungee shock cord suspension. For imaging, proteins were diluted in working buffer (140 mM KCl, 10 mM Hepes, 0.1 mM CaCl2, pH 6.5) to a final concentration of 1 mg/mL. The protein (50 µL) was then spotted onto a circular disc of freshly cleaved mica (ProSciTech) that had been super-glued to hydro- phobic waxy parafilm (ProSciTech), which was in turn super-glued to a 12 mm magnetic metal disc (which at- taches to the sample holde r of the Multimode AFM). The protein samples were then placed under a small Petri dish for 15 minutes with distilled water spread around the perimeter in order to saturate the environment and mini- mise evaporation. The protein sample was then rinsed 3 times with 100 µL of working buffer, with a final 50 µL of working buffer added prior to mounting the disc on the AFM. 2.3. Oxidation Experiments To examine the effect of hydrogen peroxide treatment on CLIC1, a 20 mM stock solution of hydrogen peroxide was prepared immediately before use then added to give a final concentration of 2 mM to typically 20-50 ul of the purified protein (2 mg/ml) in 140 mM KCl, 10 mM Hepes, 0.1 mM CaCl2, pH 6.5 and incubated overnight at +4˚C. After in cubation the protein wa s prepared for AFM imaging as described above. 2.4. Image Analysis Measurements of protein “spots” on mica substrate were carried out using Nanoscope IIIA software (Veeco In- struments, Santa Barbara, CA, USA). The cross-section tool was used to measure the height (h) and the diameter (d) at half-maximal height of the proteins. This was done in order to compensate for the artificially induced overestimation of the protein width. Samples with dimensions <0.5 nm were disregarded as they were deemed too small to represent intact protein. The Experi- mental Molecular Volume (VExp) of the proteins was calculated using the following formula which calculates the volume of a spherical cap [1]: VExp = (hπ/6)(3r2 + h2) (1) Where h and r are the height and radius of the protein particle, respectively. The Molecular Volume based on molecular weight (VCal) was calculated using the following equation: VCal = (M/NA)(V1 + dV2) (2) Where M is the molecular weight of the protein, NA is Avogadro’s Number (6.022 × 10²³), V1 and V2 are the partial specific volumes of particle and water (0.74 cm3 g–1 and 1 cm3 g–1 water, respectively), and d is the extent of protein hydration (0.4 mol H2O/mol protein) [1]. 3. Results 3.1. AFM Imaging of the S100 Proteins in Buffer Imaging of the S100 proteins was undertaken in buffer using tapping-mode, liquid-cell AFM. The 3 proteins were imaged individually under the same conditions at room temperature. Images collected were from at least 3 independent preparations of the protein samples spotted onto mica on different days. All 3 proteins gave unique error mode images and protein heights and widths were easily discernable from the cross section images (Figures 2-4). It was found that the populations of protein parti- cles were heterogeneous in size. Molecular volumes were calculated for each protein {S100A8 (n = 44); S100A9 (n = 24); S100A12 (n = 52)}, using Equation 1 (Methods) and a frequency distribution of volumes was produced (see Figure 1). Molecular volumes representing large aggregates of protein were excluded from the frequency distribution data. S100A8 (comprises 93 amino acids; mass, 10834.51 Da) adsorbed onto mica formed spherical cap-shaped spots, of heterogeneous size, ranging from 1.2 to 3.5 nm in height and 7.0 to 16.2 nm diameter (at half height). Figure 2, panel B, is the image of a representative S100A8 spot with dimensions measuring 8.2 nm diame- ter (at half height) and a height of 1.5 nm. Using these dimensions, the experimental molecular volume is 41.4 nm3. The X-ray crystal structure reported by Ishikawa et al (2000) demonstrated that the protein in solution exists 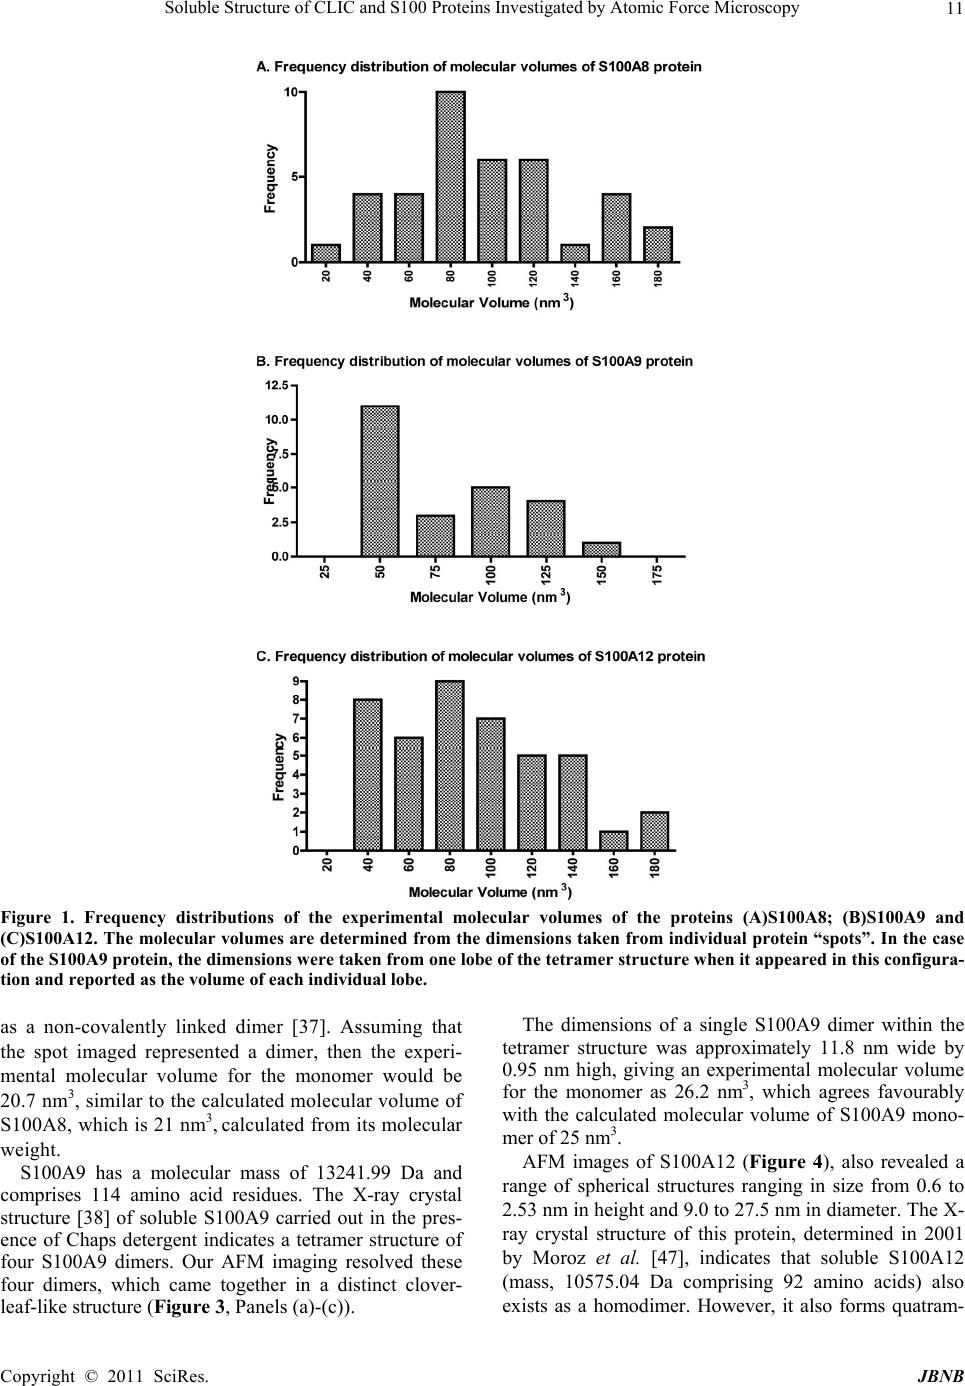 Soluble Structure of CLIC and S100 Proteins Investigated by Atomic Force Microscopy Copyright © 2011 SciRes. JBNB 11 Figure 1. Frequency distributions of the experimental molecular volumes of the proteins (A)S100A8; (B)S100A9 and (C)S100A12. The molecular volumes are determined from the dimensions taken from individual protein “spots”. In the case of the S100A9 protein, the dimensions were taken from one lobe of the tetramer structure when it appeared in this configura- tion and reported as the volume of each individual lobe. as a non-covalently linked dimer [37]. Assuming that the spot imaged represented a dimer, then the experi- mental molecular volume for the monomer would be 20.7 nm3, similar to the calculated molecular volume of S100A8, which is 21 nm3, calculated from its molecular weight. S100A9 has a molecular mass of 13241.99 Da and comprises 114 amino acid residues. The X-ray crystal structure [38] of soluble S100A9 carried out in the pres- ence of Chaps detergent indicates a tetramer structure of four S100A9 dimers. Our AFM imaging resolved these four dimers, which came together in a distinct clover- leaf-like structure (Figure 3, Panels (a)- (c)). The dimensions of a single S100A9 dimer within the tetramer structure was approximately 11.8 nm wide by 0.95 nm high, giving an experimental molecular volume for the monomer as 26.2 nm3, which agrees favourably with the calculated molecular volume of S100A9 mono- mer of 25 nm3. AFM images of S100A12 (Figure 4), also revealed a range of spherical structures ranging in size from 0.6 to 2.53 nm in height and 9.0 to 27.5 nm in diameter. The X- ray crystal structure of this protein, determined in 2001 by Moroz et al. [47], indicates that soluble S100A12 (mass, 10575.04 Da comprising 92 amino acids) also exists as a homodimer. However, it also forms quatram- 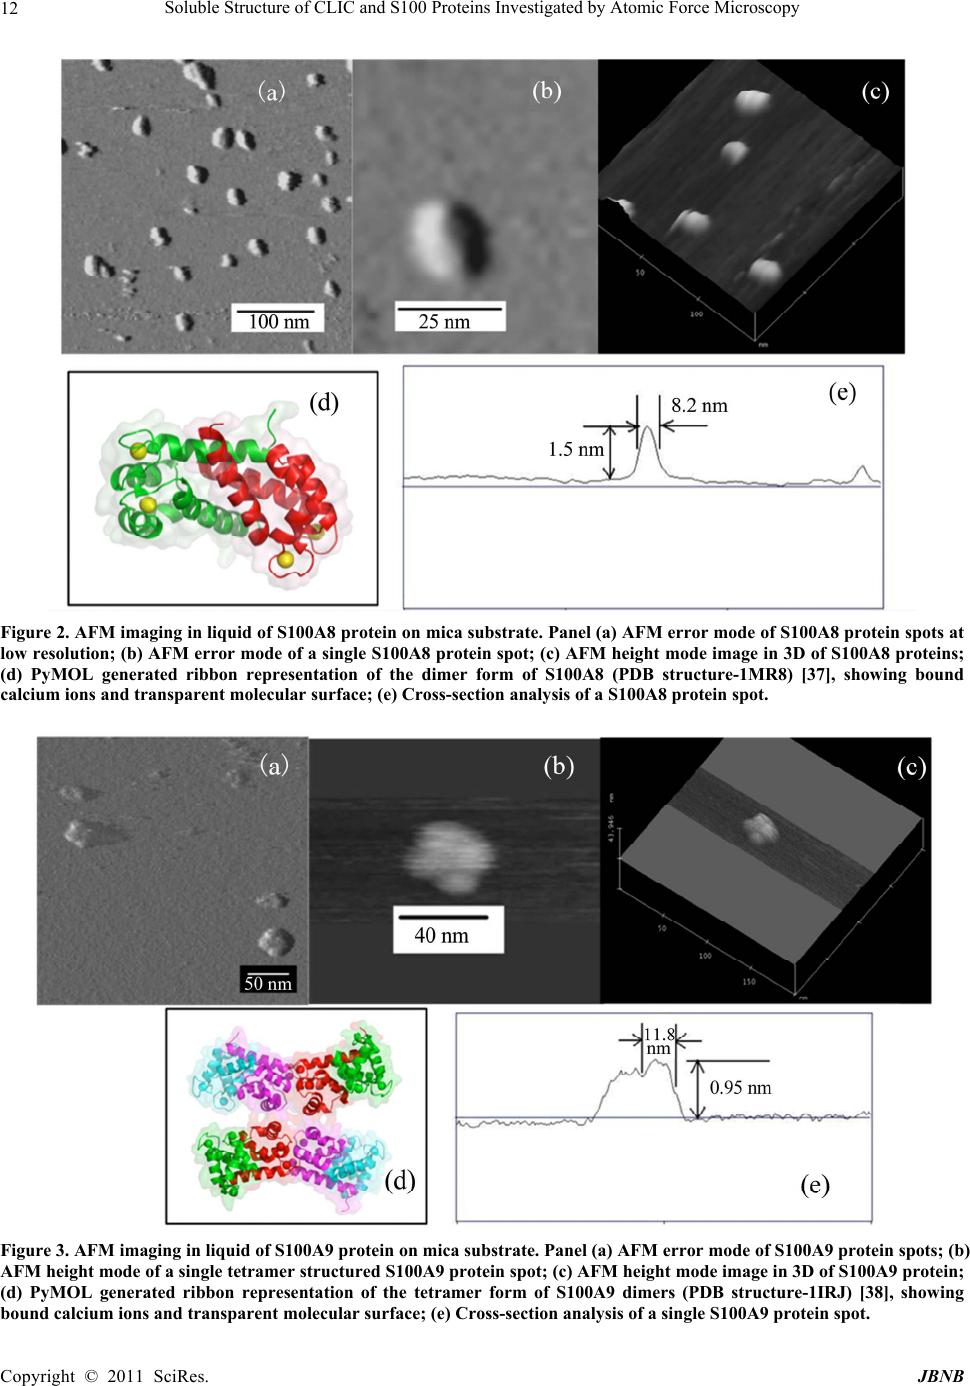 Soluble Structure of CLIC and S100 Proteins Investigated by Atomic Force Microscopy Copyright © 2011 SciRes. JBNB 12 Figure 2. AFM imaging in liquid of S100A8 protein on mica substrate. Panel (a) AFM error mode of S100A8 protein spots at low resolution; (b) AFM error mode of a single S100A8 protein spot; (c) AFM height mode image in 3D of S100A8 proteins; (d) PyMOL generated ribbon representation of the dimer form of S100A8 (PDB structure-1MR8) [37], showing bound calcium ions and transparent molecular surface; (e) Cross-section analysis of a S100A8 protein spot. Figure 3. AFM imaging in liquid of S100A9 protein on mica substrate. Panel (a) AFM error mode of S100A9 protein spots; (b) AFM height mode of a single tetramer structured S100A9 protein spot; (c) AFM height mode image in 3D of S100A9 protein; (d) PyMOL generated ribbon representation of the tetramer form of S100A9 dimers (PDB structure-1IRJ) [38], showing bound calcium ions and transparent molecular surface; (e) Cross-section analysis of a single S100A9 protein spot. 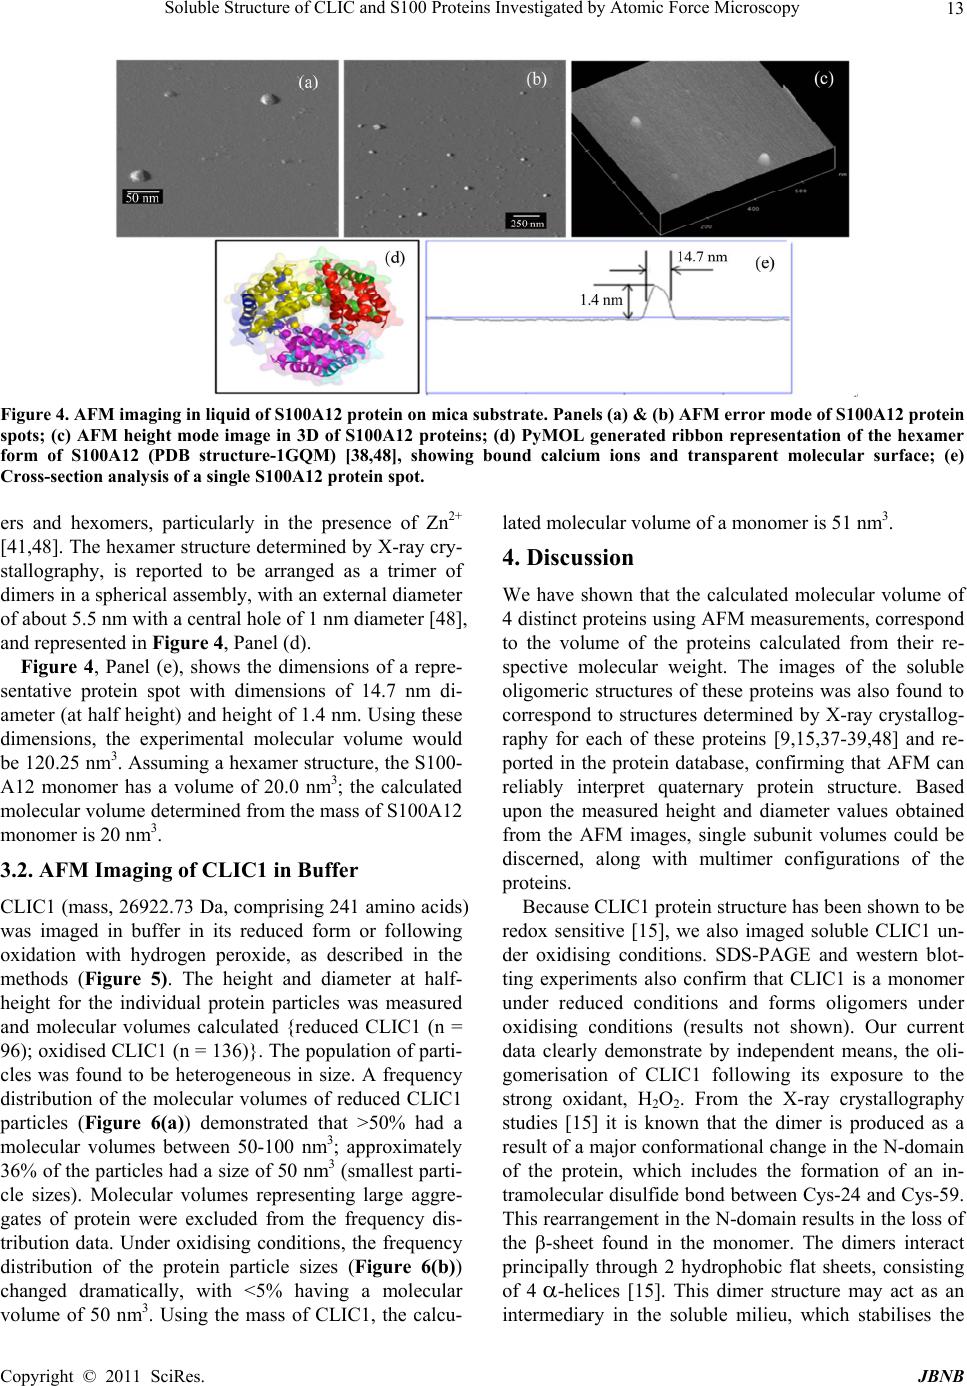 Soluble Structure of CLIC and S100 Proteins Investigated by Atomic Force Microscopy Copyright © 2011 SciRes. JBNB 13 Figure 4. AFM imaging in liquid of S100A12 protein on mica substrate. Panels (a) & (b) AFM error mode of S100A12 protein spots; (c) AFM height mode image in 3D of S100A12 proteins; (d) PyMOL generated ribbon representation of the hexamer form of S100A12 (PDB structure-1GQM) [38,48], showing bound calcium ions and transparent molecular surface; (e) Cross-section analysis of a single S100A12 protein spot. ers and hexomers, particularly in the presence of Zn2+ [41,48]. The hexamer structure determined by X-ray cry- stallography, is reported to be arranged as a trimer of dimers in a spherical assembly, with an external diameter of about 5.5 nm with a central hole of 1 nm diameter [48], and represented in Figure 4, Panel (d). Figure 4, Panel (e), shows the dimensions of a repre- sentative protein spot with dimensions of 14.7 nm di- ameter (at half height) and height of 1.4 nm. Using these dimensions, the experimental molecular volume would be 120.25 nm3. Assuming a hexamer structure, the S100- A12 monomer has a volume of 20.0 nm3; the calculated molecular volume determined from the mass of S100A12 monomer is 20 nm3. 3.2. AFM Imaging of CLIC1 in Buffer CLIC1 (mass, 26922.73 Da, comprising 241 amino acids) was imaged in buffer in its reduced form or following oxidation with hydrogen peroxide, as described in the methods (Figure 5). The height and diameter at half- height for the individual protein particles was measured and molecular volumes calculated {reduced CLIC1 (n = 96); oxidised CLIC1 (n = 136)}. The population of parti- cles was found to be heterogeneous in size. A frequency distribution of the molecular volumes of reduced CLIC1 particles (Figure 6(a)) demonstrated that >50% had a molecular volumes between 50-100 nm3; approximately 36% of the particles had a size of 50 nm3 (smallest parti- cle sizes). Molecular volumes representing large aggre- gates of protein were excluded from the frequency dis- tribution data. Under oxidising conditions, the frequency distribution of the protein particle sizes (Figure 6(b)) changed dramatically, with <5% having a molecular volume of 50 nm3. Using the mass of CLIC1, the calcu- lated molecular volume of a monomer is 51 nm3. 4. Discussion We have shown that the calculated molecular volume of 4 distinct proteins using AFM measurements, correspond to the volume of the proteins calculated from their re- spective molecular weight. The images of the soluble oligomeric structures of these proteins was also found to correspond to structures determined by X-ray crystallog- raphy for each of these proteins [9,15,37-39,48] and re- ported in the protein database, confirming that AFM can reliably interpret quaternary protein structure. Based upon the measured height and diameter values obtained from the AFM images, single subunit volumes could be discerned, along with multimer configurations of the proteins. Because CLIC1 protein structure has been shown to be redox sensitive [15], we also imaged soluble CLIC1 un- der oxidising conditions. SDS-PAGE and western blot- ting experiments also confirm that CLIC1 is a monomer under reduced conditions and forms oligomers under oxidising conditions (results not shown). Our current data clearly demonstrate by independent means, the oli- gomerisation of CLIC1 following its exposure to the strong oxidant, H2O2. From the X-ray crystallography studies [15] it is known that the dimer is produced as a result of a major co nformational chan ge in the N-domain of the protein, which includes the formation of an in- tramolecular disulfide bond between Cys-24 and Cys-59. This rearrangement in the N-domain results in the loss of the -sheet found in the monomer. The dimers interact principally through 2 hydrophobic flat sheets, consisting of 4-helices [15]. This dimer structure may act as an intermediary in the soluble milieu, which stabilises the 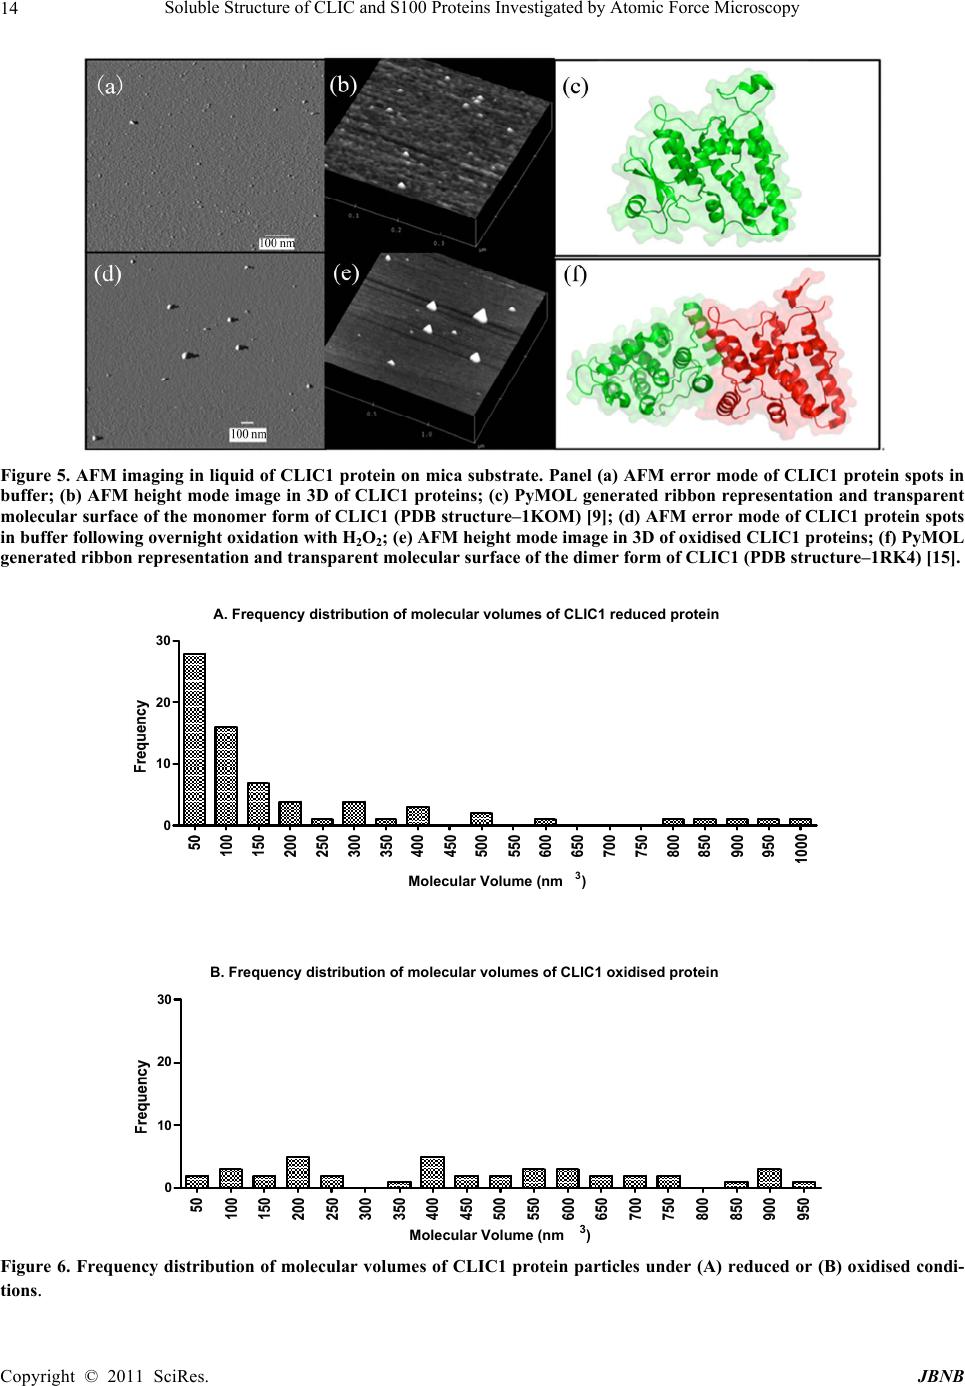 Soluble Structure of CLIC and S100 Proteins Investigated by Atomic Force Microscopy Copyright © 2011 SciRes. JBNB 14 Figure 5. AFM imaging in liquid of CLIC1 pro tein on mica substrate. Panel (a) AFM error mode of CLIC1 protein spots in buffer; (b) AFM height mode image in 3D of CLIC1 proteins; (c) PyMOL generated ribbon representation and transparent molecular surface of the monomer form of CLIC1 (PDB structure–1KOM) [9]; (d) AFM error mode of CLIC1 protein spots in buffer following overnight oxidation with H2O2; (e) AFM height mode image in 3D of oxidised CLIC1 proteins; (f) PyMOL generated ribbon representation and transparent molecular surface of the dimer form of CLIC1 (PDB structure–1RK4) [15]. A. Frequency distribution of molecular volumes of CLIC1 reduced protein 0 10 20 30 Molecular Volume (nm3) B. Frequency distribution of molecular volumes of CLIC1 oxidised protein 0 10 20 30 Molecular Volume (nm3) Figure 6. Frequency distribution of molecular volumes of CLIC1 protein particles under (A) reduced or (B) oxidised condi- tions. 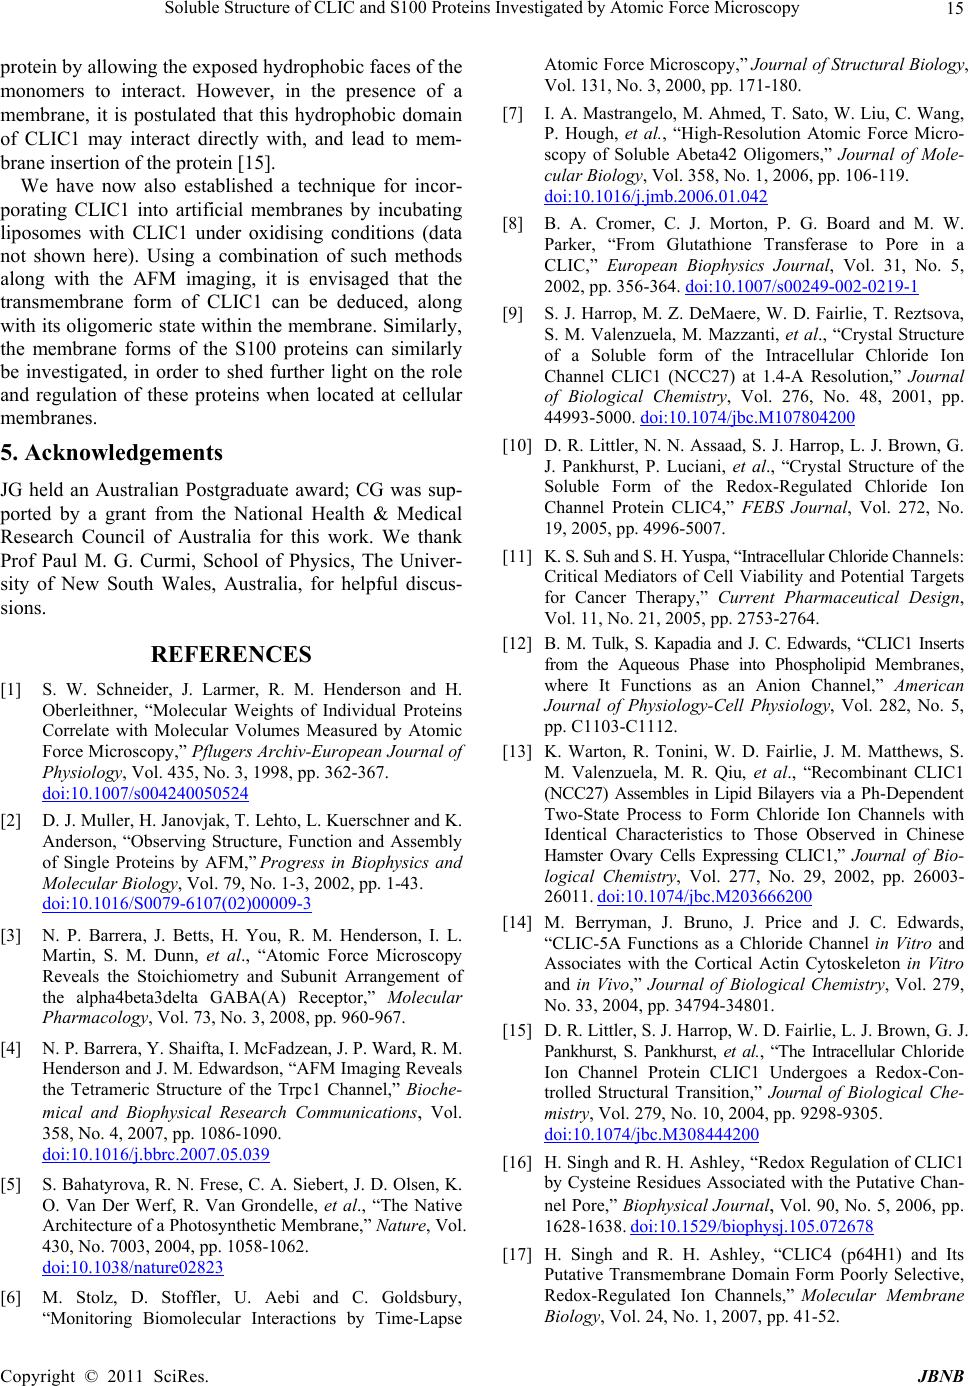 Soluble Structure of CLIC and S100 Proteins Investigated by Atomic Force Microscopy Copyright © 2011 SciRes. JBNB 15 protein by allowing the exposed hydrophobic faces of the monomers to interact. However, in the presence of a membrane, it is postulated that this hydrophobic domain of CLIC1 may interact directly with, and lead to mem- brane insertion of the protein [15]. We have now also established a technique for incor- porating CLIC1 into artificial membranes by incubating liposomes with CLIC1 under oxidising conditions (data not shown here). Using a combination of such methods along with the AFM imaging, it is envisaged that the transmembrane form of CLIC1 can be deduced, along with its oligomeric state within the membrane. Similarly, the membrane forms of the S100 proteins can similarly be investigated, in order to shed further light on the role and regulation of these proteins when located at cellular membranes. 5. Acknowledgements JG held an Australian Postgraduate award; CG was sup- ported by a grant from the National Health & Medical Research Council of Australia for this work. We thank Prof Paul M. G. Curmi, School of Physics, The Univer- sity of New South Wales, Australia, for helpful discus- sions. REFERENCES [1] S. W. Schneider, J. Larmer, R. M. Henderson and H. Oberleithner, “Molecular Weights of Individual Proteins Correlate with Molecular Volumes Measured by Atomic Force Microscopy,” Pflugers Archiv-European Journal of Physiology, Vol. 435, No. 3, 1998, pp. 362-367. doi:10.1007/s004240050524 [2] D. J. Muller, H. Janovjak, T. Lehto, L. Kuerschner and K. Anderson, “Observing Structure, Function and Assembly of Single Proteins by AFM,” Progress in Biophysics and Molecular Biology, Vol. 79, No. 1-3, 2002, pp. 1-43. doi:10.1016/S0079-6107(02)00009-3 [3] N. P. Barrera, J. Betts, H. You, R. M. Henderson, I. L. Martin, S. M. Dunn, et al., “Atomic Force Microscopy Reveals the Stoichiometry and Subunit Arrangement of the alpha4beta3delta GABA(A) Receptor,” Molecular Pharmacology, Vol. 73, No. 3, 2008, pp. 960-967. [4] N. P. Barrera, Y. Shaifta, I. McFadzean, J. P. Ward, R. M. Henderson and J. M. Edwardson, “AFM Imaging Reveals the Tetrameric Structure of the Trpc1 Channel,” Bioche- mical and Biophysical Research Communications, Vol. 358, No. 4, 2007, pp. 1086-1090. doi:10.1016/j.bbrc.2007.05.039 [5] S. Bahatyrova, R. N. Frese, C. A. Siebert, J. D. Olsen, K. O. Van Der Werf, R. Van Grondelle, et al., “The Native Architecture of a Photosynthetic Membrane,” Nature, Vol. 430, No. 7003, 2004, pp. 1058-1062. doi:10.1038/nature02823 [6] M. Stolz, D. Stoffler, U. Aebi and C. Goldsbury, “Monitoring Biomolecular Interactions by Time-Lapse Atomic Force Microscopy,” Journal of Structural Biology, Vol. 131, No. 3, 2000, pp. 171-180. [7] I. A. Mastrangelo, M. Ahme d, T. Sato, W. Liu, C. Wang, P. Hough, et al., “High-Resolution Atomic Force Micro- scopy of Soluble Abeta42 Oligomers,” Journal of Mole- cular Biology, Vol. 358, No. 1, 2006, pp. 106-119. doi:10.1016/j.jmb.2006.01.042 [8] B. A. Cromer, C. J. Morton, P. G. Board and M. W. Parker, “From Glutathione Transferase to Pore in a CLIC,” European Biophysics Journal, Vol. 31, No. 5, 2002, pp. 356-364. doi:10.1007/s00249-002-0219-1 [9] S. J. Harrop, M. Z. DeMaere, W. D. Fairlie, T. Reztsova, S. M. Valenzuela, M. Mazzanti, et al., “Crystal Structure of a Soluble form of the Intracellular Chloride Ion Channel CLIC1 (NCC27) at 1.4-A Resolution,” Journal of Biological Chemistry, Vol. 276, No. 48, 2001, pp. 44993-5000. doi:10.1074/jbc.M107804200 [10] D. R. Littler, N. N. Assaad, S. J. Harrop, L. J. Brown, G. J. Pankhurst, P. Luciani, et al., “Crystal Structure of the Soluble Form of the Redox-Regulated Chloride Ion Channel Protein CLIC4,” FEBS Journal, Vol. 272, No. 19, 2005, pp. 4996-5007. [11] K. S. Suh and S. H. Yuspa, “Intracellular Chloride Channels: Critical Mediators of Cell Viability and Potential Targets for Cancer Therapy,” Current Pharmaceutical Design, Vol. 11, No. 21, 2005, pp. 2753-2764. [12] B. M. Tulk, S. Kapadia and J. C. Edwards, “CLIC1 Inserts from the Aqueous Phase into Phospholipid Membranes, where It Functions as an Anion Channel,” American Journal of Physiology-Cell Physiology, Vol. 282, No. 5, pp. C1103-C1112. [13] K. Warton, R. Tonini, W. D. Fairlie, J. M. Matthews, S. M. Valenzuela, M. R. Qiu, et al., “Recombinant CLIC1 (NCC27) Assembles in Lipid Bilayers via a Ph-Dependent Two-State Process to Form Chloride Ion Channels with Identical Characteristics to Those Observed in Chinese Hamster Ovary Cells Expressing CLIC1,” Journal of Bio- logical Chemistry, Vol. 277, No. 29, 2002, pp. 26003- 26011. doi:10.1074/jbc.M203666200 [14] M. Berryman, J. Bruno, J. Price and J. C. Edwards, “CLIC-5A Functions as a Chloride Channel in Vitro and Associates with the Cortical Actin Cytoskeleton in Vitro and in Vivo,” Journal of Biological Chemistry, Vol. 279, No. 33, 2004, pp. 34794-34801. [15] D. R. Littler, S. J. Harrop, W. D. Fairlie, L. J. Brown, G. J. Pankhurst, S. Pankhurst, et al., “The Intracellular Chloride Ion Channel Protein CLIC1 Undergoes a Redox-Con- trolled Structural Transition,” Journal of Biological Che- mistry, Vol. 279, No. 10, 2004, pp. 9298-9305. doi:10.1074/jbc.M308444200 [16] H. Singh and R. H. Ashley, “Redox Regulation of CLIC1 by Cysteine Residues Associated with the Putative Chan- nel Pore,” Biophysical Journal, Vol. 90, No. 5, 2006, pp. 1628-1638. doi:10.1529/biophysj.105.072678 [17] H. Singh and R. H. Ashley, “CLIC4 (p64H1) and Its Putative Transmembrane Domain Form Poorly Selective, Redox-Regulated Ion Channels,” Molecular Membrane Biology, Vol. 24, No. 1, 2007, pp. 41-52.  Soluble Structure of CLIC and S100 Proteins Investigated by Atomic Force Microscopy Copyright © 2011 SciRes. JBNB 16 [18] H. Singh, M. A. Cousin and R. H. Ashley, “Functional Reconstitution of Mammalian Chloride Intracellular Ch a nn e ls ’ CLIC1, CLIC4 and CLIC5 Reveals Differential Regu- lation by Cytoskeletal Actin,” FEBS Journal, Vol. 274, No. 24, 2007, pp. 6306-6316. [19] R. Tonini, A. Ferroni, S. M. Valenzuela, K. Warton, T. J. Campbell, S. N. Breit, et al., “Functional Charac teri zati on of the NCC27 Nuclear Protein in Stable Transfected CHO-K1 Cells,” FASEB Journal, Vol. 14, No. 9, 2000, pp. 1171-1178. [20] S. M. Valenzuela, D. K. Martin, S. B. Por, J. M. Robbins, K. Warton, M. R. Bootcov, et al., “Molecular Cloning and Expression of a Chloride Ion Channel of Cell Nuclei,” Journal of Biological Chemistry, Vol. 272, No. 19, 1997, pp. 12575-12582. doi:10.1074/jbc.272.19.12575 [21] T. Ravasi, K. Hsu, J. Goyette, K. Schroder, Z. Yang, F. Rahimi, et al., “Probing the S100 Protein Family through Genomic and Functional Analysis,” Genomics, Vol. 84, No. 1, 2004, pp. 10-22. doi:10.1016/j.ygeno.2004.02.002 [22] M. Pedrocchi, B. W. Schafer, H. Mueller, U. Eppenberger and C. W. Heizmann, “Expression of Ca(2+)-Binding Proteins of the S100 Family in Malignant Human Breast- Cancer Cell Lines and Biopsy Samples,” International Journal of Cancer, Vol. 57, No. 5, 1994, pp. 684-690. [23] R. Donato, “Functional Roles of S100 Proteins, Calcium- Binding Proteins of the EF-hand Type,” Biochimica et Biophysica Acta, Vol. 1450, No. 3, 1999, pp. 191-231. [24] R. Donato, “Intracellular and Extracellular Roles of S100 proteins,” Microscopy Research and Technique, Vol. 60, No. 6, 2003, pp. 540-551. doi:10.1002/jemt.10296 [25] R. J. Passey, K. Xu, D. A. Hume and C. L. Geczy, “S100A8: Emerging Functions and Regulation,” Journal of Leukocyte Biology, Vol. 66, No. 4, 1999, pp. 549-556. [26] P. Lemarchand, M. Vaglio, J. Mauel and M. Markert, “Translocation of a Small Cytosolic Calcium-Binding Protein (MRP-8) to Plasma Membrane Correlates with Human Neutrophil Activation,” Journal of Biological Chemistry, Vol. 267, No. 27, 1992, pp. 19379-19382. [27] C. Kerkhoff, C. Sorg, N. N. Tandon and W. Nacken, “Interaction of S100A8/S100A9-Arachidonic Acid Com- plexes with the Scavenger Receptor CD36 may Facilitate Fatty acid Uptake by Endothelial Cells,” Biochemistry, Vol. 40, No. 1, 2001, pp. 241-248. [28] H. Kubista, R. Donato and A. Hermann, “S100 Calcium Binding Protein Affects Neuronal Electrical Discharge Activity by Modulation of Potassium Currents,” Neuro- science, Vol. 90, No. 2, 1999, pp. 493-508. doi:10.1016/S0306-4522(98)00422-9 [29] K. Hsu, R. J. Passey, Y. Endoh, F. Rahimi, P. Youssef, T. Yen, et al., “Regulation of S100A8 by Glucocorticoids,” Journal of Immunology, Vol. 174, No. 4, 2005, pp. 2318- 2326. [30] T. Yen, C. A. Harrison, J. M. Devery, S. Leong, S. E. Iismaa, T. Yoshimura, et al., “Induction of the S100 Chemotactic Protein, CP-10, in Murine Microvascular Endothelial Cells by Proinflammatory Stimuli,” Blood, Vol. 90, No. 12, 1997, pp. 4812-4821. [31] I. S. Thorey, J. Roth, J. Regenbogen, J. P. Halle, M. Bittner, T. Vogl, et al., “The Ca2+-Binding Proteins S100A8 and S100A9 are Encoded by Novel Injury- Regulated Genes,” Journal of Biological Chemistry, Vol. 276, No. 38, 2001, pp. 35818-35825. doi:10.1074/jbc.M104871200 [32] M. A. Grimbaldeston, C. L. Geczy, N. Tedla, J. J. Finlay-Jones and P. H. Hart, “S100A8 Induction in Keratinocytes by Ultraviolet A Irradiation is Dependent on Reactive Oxygen Intermediates,” Journal of Inves- tigative Dermatology, Vol. 121, No. 5, 2003, pp. 1168-1174. doi:10.1046/j.1523-1747.2003.12561.x [33] F. Rahimi, K. Hsu, Y. Endoh and C. L. Geczy, “FGF-2, IL-1beta and TGF-beta Regulate Fibroblast Expression of S100A8,” FEBS Journal, Vol. 272, No. 11, 2005, pp. 2811-2827. doi:10.1111/j.1742-4658.2005.04703.x [34] P. G. Sohnle, M. J. Hunter, B. Hahn and W. J. Chazin, “Zinc-Reversible Antimicrobial Activity of Recombinant Calprotectin (Migration Inhibitory Factor-Related Pr o t e i ns 8 and 14),” Journal of Infectious Diseases, Vol. 182, No. 4, 2000, pp. 1272-1275. [35] Y. Nakatani, M. Yamazaki, W. J. Chazin and S. Yui, “Regulation of S100A8/A9 (Calprotectin) Binding to Tumor Cells by Zinc Ion and Its Implication for Apop- tosis-Inducing Activity,” Mediators of Inflammation, Vol. 5, 2005, pp. 280-292. doi:10.1155/MI.2005.280 [36] C. van den Bos, J. Roth, H. G. Koch, M. Hartmann and C. Sorg, “Phosphorylation of MRP14, an S100 Protein Ex- pressed during Monocytic Differentiation, Modulates Ca(2+)-Dependent Translocation from Cytoplasm to Membranes and Cytoskeleton,” Journal of Immunology, Vol. 156, No. 3, 1996, pp. 1247-1254. [37] K. Ishikawa, A. Nakagawa, I. Tanaka, M. Suzuki and J. Nishihira, “The Structure of Human MRP8, a Member of the S100 Calcium-Binding Protein Family, by MAD Phasing at 1.9 A Resolution,” Acta Crystallographica Section D-Biological Crystallography, Vol. 56, No. 5, 2000, pp. 559-566. doi:10.1107/S0907444900002833 [38] H. Itou, M. Yao, I. Fujita, N. Watanabe, M. Suzuki, J. Nishihira, et al., “The Crystal Structure of Human MRP14 (S100A9), a Ca(2+)-Dependent Regulator Protein in In- flammatory Process,” Journal of Molecular Biology, Vol. 316, No. 2, 2002, pp. 265-276. [39] O. V. Moroz, A. A. Antson, G. G. Dodson, K. S. Wilson, I. Skibshoj, E. M. Lukanidin, et al., “Crystallization and Preliminary X-Ra y D iff r ac tion An al ys is of Hum an Calcium- Binding Protein S100A12,” Acta Crystallographica Section D-Biological Crystallography, Vol. 56, No. 2, 2000, pp. 189-191. doi:10.1107/S0907444999014936 [40] O. V. Moroz, A. A. Antson, S. J. Grist, N. J. Maitland, G. G. Dodson, K. S. Wilson, et al., “Structure of the Human S100A12-Copper Complex: Implications for Host-Parasite Defence,” Acta Crystallographica Section D-Biological Crystallography, Vol. 59, No. 5, 2003, pp. 859-867. [41] J. Goyette, W. X. Yan, E. Yamen, Y. M. Chung, S. Y. Lim, K. Hsu, et al., “Pleiotropic Roles of S100A12 in Coronary Atherosclerotic Plaque Formation and Rupture,”  Soluble Structure of CLIC and S100 Proteins Investigated by Atomic Force Microscopy Copyright © 2011 SciRes. JBNB 17 Journal of Immunology, Vol. 183, No. 1, 2009, pp. 593- 603. doi:10.4049/jimmunol.0900373 [42] N. Leukert, T. Vogl, K. Strupat, R. Reichelt, C. Sorg and J. Roth, “Calcium-Dependent Tetramer Formation of S100A8 and S100A9 is Essential for Biological Activity,” Journal of Molecular Biology, Vol. 359, No. 4, 2006, pp. 961-972. doi:10.1016/j.jmb.2006.04.009 [43] S. M. Valenzuela, M. Berkahn, D. K. Martin, T. Huynh, Z. Yang and C. L. Geczy, “Elucidating the Structure and Function of S100 Proteins in Membranes,” Proceedings of SPIE, Vol. 6036, No. 19, 2006, pp. 1-9. [44] S. Berthier, M. H. Paclet, S. Lerouge, F. Roux, S. Vergnaud, A. W. Coleman, et al., “Changing the Confor- mation State of Cytochrome b(558) Initiates NADPH Oxidase Activation-MRP8/MRP14 Regulation,” Journal of Biological Chemistry, Vol. 278, No. 28, 2003, pp. 25499-25508. [45] C. A. Harrison, M. J. Raftery, J. Walsh, P. Alewood, S. E. Iismaa, S. Thliveris, et al., “Oxidation Regulates the Inflammatory Properties of the Murine S100 Protein S100A8,” Journal of Biological Chemistry, Vol. 274, No. 13, 1999, pp. 8561-8569. doi:10.1074/jbc.274.13.8561 [46] M. Raftery, L. Collinson and C. Geczy, “Over Expression, Oxidative Refolding, and Zinc Binding of Recombinant Forms of the Murine S100 Protein MRP14 (S100A9),” Protein Expression & Purification, Vol. 15, No. 2, 1999, pp. 228-235. doi:10.1006/prep.1998.1015 [47] O. V. Moroz, A. A. Antson, G. N. Murshudov, N. J. Maitland, G. G. Dodson, K. S. Wilson, et al., “The Three- Dimensional Structure of Human S100A12,” Acta Crystallographica Section D-Biological Crystallography, Vol. 57, 2001, pp. 20-29. [48] O. V. Moroz, A. A. Antson, E. J. Dodson, H. J. Burrell, S. J. Grist, R. M. Lloyd, et al., “The Structure of S100A12 in a Hexameric Form and Its Proposed Role in Receptor Signalling,” Acta Crystallographica Section D-Biological Crystallography, Vol. 58, No. 3, 2002, pp. 407-413. doi:10.1107/S0907444901021278 |