Paper Menu >>
Journal Menu >>
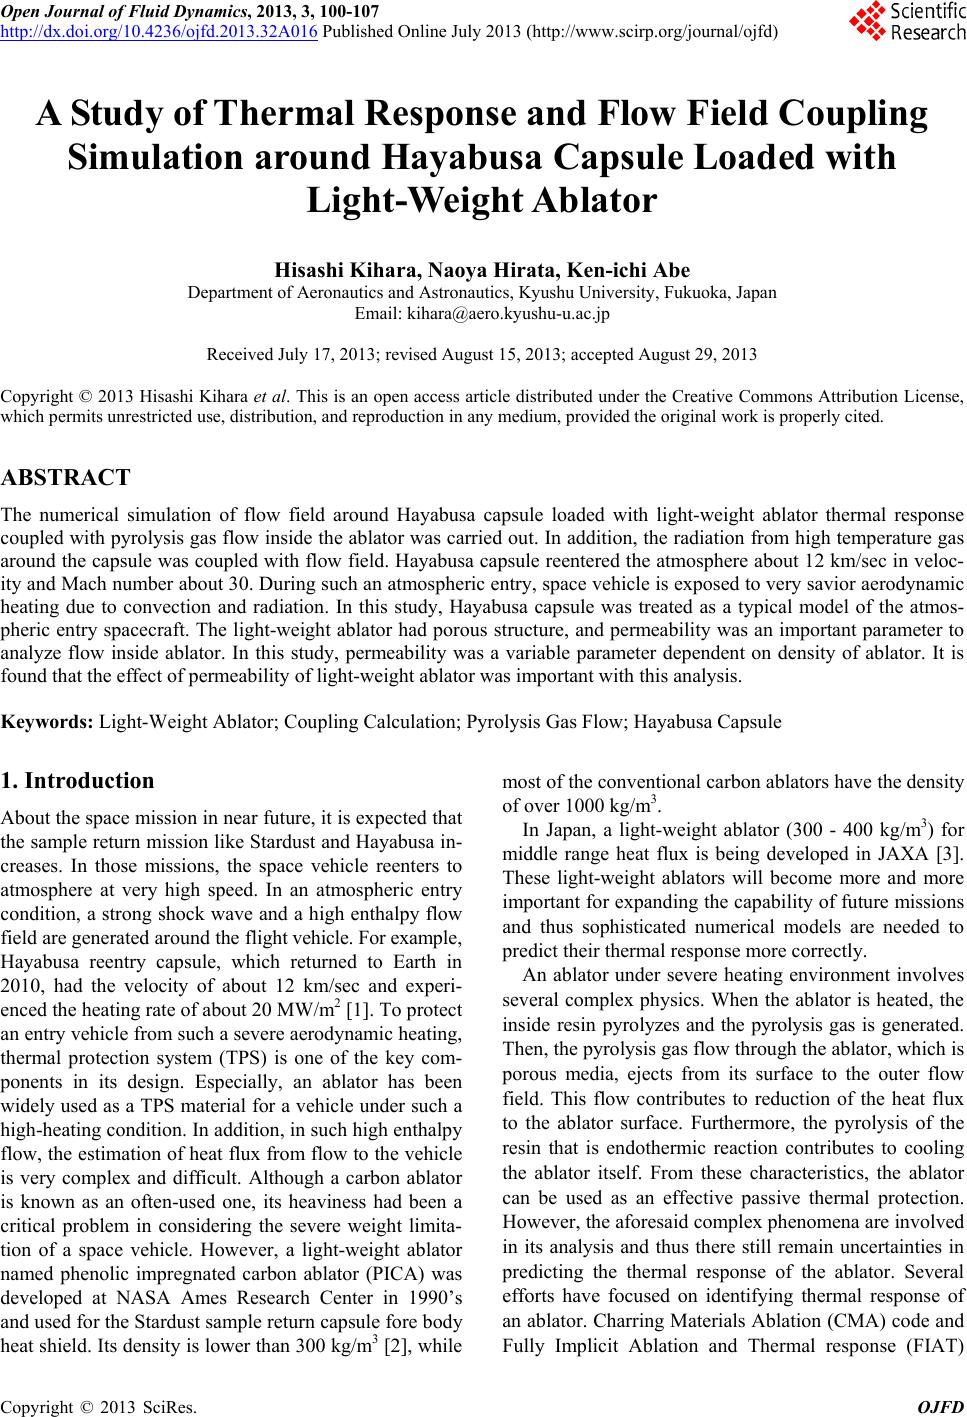 Open Journal of Fluid Dynamics, 2013, 3, 100-107 http://dx.doi.org/10.4236/ojfd.2013.32A016 Published Online July 2013 (http://www.scirp.org/journal/ojfd) A Study of Thermal Response and Flow Field Coupling Simulation around Hayabusa Capsule Loaded with Light-W eight Ablator Hisashi Kihara, Naoya Hirata, Ken-ichi Abe Department of Aeronautics and Astronautics, Kyushu University, Fukuoka, Japan Email: kihara@aero.kyushu-u.ac.jp Received July 17, 2013; revised August 15, 2013; accepted August 29, 2013 Copyright © 2013 Hisashi Kihara et al. This is an open access article distributed under the Creative Commons Attribution License, which permits unrestricted use, distribution, and reproduction in any medium, provided the original work is properly cited. ABSTRACT The numerical simulation of flow field around Hayabusa capsule loaded with light-weight ablator thermal response coupled with pyrolysis gas flow inside the ablator was carried out. In addition, the radiation from high temperature gas around the capsule was coupled with flow field. Hayabusa capsule reentered the atmosphere about 12 km/sec in veloc- ity and Mach number about 30. During such an atmospheric entry, space vehicle is exposed to very savior aerodynamic heating due to convection and radiation. In this study, Hayabusa capsule was treated as a typical model of the atmos- pheric entry spacecraft. The light-weight ablator had porous structure, and permeability was an important parameter to analyze flow inside ablator. In this study, permeability was a variable parameter dependent on density of ablator. It is found that the effect of permeability of light-weight ablator was important with this analysis. Keywords: Light-Weight Ablator; Coupling Calculation; Pyrolysis Gas Flow; Hayabusa Capsule 1. Introduction About the space mission in near future, it is expected that the sample return mission like Stardust and Hayabusa in- creases. In those missions, the space vehicle reenters to atmosphere at very high speed. In an atmospheric entry condition, a strong shock wave and a high enthalpy flow field are generated around the flight vehicle. For example, Hayabusa reentry capsule, which returned to Earth in 2010, had the velocity of about 12 km/sec and experi- enced the heating rate of about 20 MW/m2 [1]. To protect an entry vehicle from such a severe aerodynamic heating, thermal protection system (TPS) is one of the key com- ponents in its design. Especially, an ablator has been widely used as a TPS material for a vehicle under such a high-heating condition. In addition, in such high enthalpy flow, the estimation of heat flux from flow to the vehicle is very complex and difficult. Although a carbon ablator is known as an often-used one, its heaviness had been a critical problem in considering the severe weight limita- tion of a space vehicle. However, a light-weight ablator named phenolic impregnated carbon ablator (PICA) was developed at NASA Ames Research Center in 1990’s and used for the Stardust sample return capsule fore body heat shield. Its density is lower than 300 kg/m3 [2], while most of the conventional carbon ablators have the density of over 1000 kg/m3. In Japan, a light-weight ablator (300 - 400 kg/m3) for middle range heat flux is being developed in JAXA [3]. These light-weight ablators will become more and more important for expanding the capability of future missions and thus sophisticated numerical models are needed to predict their thermal response more correctly. An ablator under severe heating environment involves several complex physics. When the ablator is heated, the inside resin pyrolyzes and the pyrolysis gas is generated. Then, the pyrolysis gas flow through the ablator, which is porous media, ejects from its surface to the outer flow field. This flow contributes to reduction of the heat flux to the ablator surface. Furthermore, the pyrolysis of the resin that is endothermic reaction contributes to cooling the ablator itself. From these characteristics, the ablator can be used as an effective passive thermal protection. However, the aforesaid complex phenomena are involved in its analysis and thus there still remain uncertainties in predicting the thermal response of the ablator. Several efforts have focused on identifying thermal response of an ablator. Charring Materials Ablation (CMA) code and Fully Implicit Ablation and Thermal response (FIAT) C opyright © 2013 SciRes. OJFD  H. KIHARA ET AL. 101 program [4] simulated the internal heat conduction and the thermal decomposition in one dimension. More so- phisticated simulation code named Two-dimensional Im- plicit Thermal response and Ablation (TITAN) [5] en- abled two-dimensional simulation. On the other hand, Ahn H. et al. developed a computa- tional code named Super Charring Materials Ablation (SCMA) [6]. In SCMA code, the motion of the pyrolysis gas inside an ablator was simulated in one dimension by solving the mass and momentum equations for the gas phase. Suzuki T. et al. extended SCMA code for two dimensional simulation and named the code (SCMA2) [7]. Moreover, they coupled SCMA2 code with a CFD code using the Park’s two-temperature model and che- mical reactions with 21 species for a thermochemical nonequilibrium flow [8]. In our research group, numerical and experimental studies have been conducted for determining the thermal response of a light-weight ablator exposed to a flow field generated by an arc-heated wind tunnel, which is often used for a heating test of an ablator [9-11]. Therefore, in the present study, the thermal response simulation code is extended so that it can treat the pyrolysis gas flow as unsteady phenomena in two-dimensional axisymmetric coordinate. Besides, the CFD code is also extended so as to include more chemical species, leading to more de- tailed evaluation of the ablation-gas injection consisting of the pyrolysis gas and the carbonaceous gas generated by the surface reactions. Furthermore, the code is devel- oped for application to wider range of the flow condi- tions not only for a nitrogen flow but also for an air flow. 2. Computational Models To simulate the process of heat shield using ablator, we have to treat many complex situations like the blowing flow of pyrolysis gas from ablator, chemical reaction on the surface recession of ablator, radiation heat conduc- tion from strong shock heated gas, and interaction be- tween blowout gas and free stream, etc. To understand such complex phenomena, the coupling simulation of outer flow-field and inside of ablator was employed. 2.1. Flow-Fields Flow-field is assumed continuous and axisymmetric flow. Navier-Stokes equation extends to thermo-chemical non- equilibrium flow is adopted as governing equation. The present simulation treats 11 species (N2, O2, NO, 2 N , 2, NO+, N, O, N+, O+, e−) for free stream and 9 spe- cies (H2, C2, C3, CN, CO, H, C, H+, C+) are related to ablation gas. These 20 Species and 153 chemical reac- tions are considered [12]. O The four temperature model is employed to handle in detail thermal non-equilibrium. These are translation, rotation, vibration and electron respectively. The electro excited temperature treats as equilibrium to electron tem- perature. The energy transfers between each of the inter- nal energy modes are considered as follows: translation- rotation [13], translation-vibration [14], translation-elec- tron [15,16], rotation-vibration [13], rotation-electron [17] and vibration-electron [18]. The energy losses for vibra- tion and rotation due to the heavy particle-impact disso- ciation [16] and the electron energy loss due to the elec- tron-impact dissociation/ionization reactions are consid- ered. In addition, radiated heat transfer is not ignored, so the radiation field of high temperature gas is calculated coupled with flow field around capsule. For the calcula- tion of radiation field, the present paper employed 3-band model [19] extended to chemical nonequilibrium flow field, which is very low cost method [20]. The char layer at the ablator surface is lost due to the surface reactions and then the ablator surface recedes. The recession rate r is determined using the carbon mass loss rate: CCC CC 23 23 1nitoxi sub CNCO C char CNCOC sub sub CC CC MMM rJJ MMM MM JJ MM J (1) The shape change should be accounted in the simula- tion because the magnitude and distribution of the heat flux are very sensitive to the surface shape [21]. Thus, in order to consider the shape change due to the surface recession, the computational domains for both the ablator and the flow field are reconstructed according to the sur- face recession. In this calculation, the grid system was rebuilt at the each 1 μm recession quantity. 2.2. Thermal Response of Ablator In this simulation, the ablator is made of carbon foam material impregnated with phenolic resin. It is easy pre- dicted that the flow of pyrolysis gas inside the light- weight ablator was different because it had much vacant spaces. The permeability of virgin layer of conventional ablator has quite little compare with the permeability of light-weight ablator’s one. Therefore, it is considered the phenomena inside the ablator include the conversion from the solid to the gas phases (pyrolysis), the heat con- duction in the solid and the gas phases and the gas phase flow with convective heat transfer. The governing equa- tions inside ablator are shown as follows. Solid mass conservation: sR t (2) Solid energy conservation: Copyright © 2013 SciRes. OJFD  H. KIHARA ET AL. 102 1 s p yr ss ssg jj ET QRe aRh tx x (3) Gas mass conservation g gi j u tx R (4) Gas momentum conservation gj ji g ij iji jj uuu pf tx x (5) Gas energy conservation g g gj j g p yr iji gsg jj EEpu tx T uQRea xx Rh (6) where subscripts s and g represent the solid and the gas phases, respectively. In Equation (2), R represents the pyrolysis rate. It shows as follow [22]: virgin virgin exp ss char s B RA tT (7) In Equations (3) and (6), represent the effective- ness of reaction heat for gas phase and a 1a is for solid phases respectively. The third term in Equation (3) and fourth term in Equation (6) represents the energy ex- change between the solid and the gas phases. The fourth term in Equation (3) and fifth term in Equation (6) are the energy loss and energy gain due to the pyrolysis, re- spectively. The last term in Equations (3) and (6) are the source terms due to the reaction heat of the pyrolysis. The pyrolysis gas made from C, H, O and calculated by chemical equilibrium code [23]. The solid phase consists of char and resin and then the solid density is given by the sum of those densities: sinre char (8) Note that the char density char is constant, while the resin density sinre decreases by the pyrolysis. Similarly, the internal energy of the solid phase is divided into the parts of char and resin: sin sin s rerechar char Ee e (9) 0 sin, sinsin d rep rere eCTTh (10) 0 ,d charp charchar eCTTh (11) The specific heat is given in the form proposed by Potts [24]. This form is based on the characteristics that the specific heat of graphite. ,2 1 s ps s T CC TCc (12) where C and 1 are determined by curve fitting based on JANAF’s data sheet of graphite [25]. c The pressure of the gas phase is given by the equation of state: g g pRT (13) The internal energy of the gas phase is given by 02 1 2 ggggvgg Ee CThq (14) where . 2ii quu The thermal conductivity is determined by a curve-fit- ting method with a manufacturing data sheet on carbon fiber material. Porosity is given by virgin min * sin s re (15) where min represents the porosity in case that the resin before pyrolyzes. The friction force per unit volume f is given by 1 fKu (16) where K is the permeability tensor. 1 2 0 cossincos sin 0 sincossin cos K K K (17) is the direction along the capsule surface for light- weight ablator or the laminated direction for conven- tional ablator. 1 K is the permeability of direction, and 2 K is the normal direction of . 1 K and 2 K are measured by experiment in our laboratory. 2.3. Coupling and Conditions The analysis of Flow field and thermal response of the ablator coupling is done through the boundary condition of these two fields. The boundary conditions change time after time. The reentry trajectory determined by JAXA [26] is treated in present study. The calculation condition shows in Table 1 . Time 0sec was altitude at 200 km. The calculation was done during 40 sec to 100 sec for ablator. As the boundary condition of inflow, pseudo steady con- dition is used. Inflow boundary condition changed every 5 sec. The calculation conditions are shown in Table 1. Numerical domain is shown in Figure 1. The compu- tation mesh are 110 × 60 for flow field and 60 × 60 for ablator. 3. Result and Discussions Figure 2 shows temperatures distribution along center Copyright © 2013 SciRes. OJFD  H. KIHARA ET AL. 103 Table 1. Free stream conditions at calculated point. Fl eight time Altitude Velocity Density Temperatur S Km km/s kg/m3 K 55 77.75 11.695 2.408 × 10⁻⁵ 213.7 60 68.59 11.546 9.065 × 10⁻⁵ 226.8 65 59.94 11.061 2.897 × 10⁻⁴ 242.3 70 52.16 9.868 7.785 × 10⁻⁴ 256.4 75 45.74 7.807 1.785 × 10⁻³ 258.1 80 40.99 5.422 3.516 × 10⁻³ 247.7 x, mm y, mm -50 050100150 200 0 50 100 150 200 250 300 350 Ablator FlowField Figure 1. Numerical grid system. Distance from wall,mm Temperature, K -40 -30 -20 -10 0 0 10000 20000 30000 40000 Translation Electron Vibration Rotation Figure 2. On axis temperatures distribution at 52.16 km. xis in front of vehicle at 52.12 km in altitude and 70 sec center sh ows temperature profiles for each time al ressure distribution and mass flu a after reentry as a typical condition. We discuss about condition 52.12 km which the typical data of present simulation. The zero point of x-axis shows the initial position of capsule surface. A precursor is remarkably seen because gas becomes a very high temperature with the shock wave. The numerical domain of flow field is selected that the effect of precursor could not ignore. The translational temperature becomes about 40,000 K. It can be seen that it is the strong thermal nonequilibrium up- stream than 5 mm of initial surface. The temperature of the plateau part behind shock wave exceeds 10,000 K and the four temperatures are almost equilibrium. Figure 3 shows temperatures distribution along ows the difference in the temperature profiles along the centerline without ablator or ablator. The zero point of x-axis shows the surface of capsule. To be easy to look, only translational temperature and vibrational tempera- ture are shown here. There seems to be no difference between two conditions. However, the peak translational temperature and the temperature gradient of approach to the surface are different and this difference indicates ab- lating cooling. Figure 4 sh ong the center line using heavy ablator. The calculation started t = 40 sec cause of the heat flux is enough small to able to ignore. At t = 40 sec to 60 sec, it assumed that the heat flux and pressure interpolated by quadratic func- tion. On the other hand, it assumed that the heat flux be- came 0 at t = 100 and calculation was stopped. The peak temperature of the surface is about 3100 K at 70 sec. This value has good agreement with measured value [26] when Hayabusa reentered. Figures 5 and 6 show p x vectors of pyrolysis gas for heavy ablator and light- weight ablator at 52.16 km, respectively. The permeabil- ity of conventional heavy ablator at virgin layer is quite large so that the pyrolysis gas could not penetrate to the direction of rear wall. So the pyrolysis gas must flow out Distance From Wall, mm Temperature, K -14 -12 -10 -8 -6-4-20 5000 10000 15000 20000 25000 30000 35000 40000 45000 Translation with ablator Vibration without ablator Vibration withablator Translation without ablator Figure 3. Difference of temperatures distribution between with and without ablated flow at 52.16 km. Copyright © 2013 SciRes. OJFD  H. KIHARA ET AL. 104 Time fromreentry, sec Surface Temperature, K 40 6080 100 500 1000 1500 2000 2500 3000 3500 Figure 4. Surface temperature history at stagnation with heavy ablator. x, mm y, mm 050 100 150200 0 50 100 150 200 4.67E+07 2.34E+07 0.00E+00 Pressure, Pa Figure 5. Pressure distribution and mass flux vectors of front side only. On the other hand, the pyrolysis gas Fi pyrolysis gas at 52.16 km with heavy ablator. to inside light-weight ablator flows not only front but also rear and radial direction. The pyrolysis gas in light- weight ablator is more transmissible than heavy weight ablator. Therefore, the pressure distribution of pyrolysis- gas in light-weight type became broad. In addition, cause of the anisotropy of permeability (distribution of poro- sity) the flow to the radial direction is occurred strongly. Particularly, the flow of the shoulder part in the ablator is influenced strong by the expansion wave from the corner. The shapes of ablator surface at 100 sec are shown in gure 7. The black line is the initial line, the green line and the red line show heavy ablator and light-weight ab- x, mm y, mm 050100 150 200 0 50 100 150 200 1.44E+05 7.18E+04 0.00E+00 Pressure,Pa Figure 6. Pressure distribution and mass flux vectors of pyrolysis gas at 52.16 km with light-weight ablator. x, mm y, mm 050100 150 200 0 20 40 60 80 100 120 140 160 180 200 Light-weight Traditional heavy ablator 40 30 20 10 0 ablator 010 20 30 Figure 7. Shape change of ablator at 100 sec. tor respectively. around stagnation region is imposed. Th more than about 1000 K. The total surface recession at la The zooming up e quantity of the recession at stagnation point is large for high heat flux. However, extreme change of shape does not occur and it keeps similarity shape mainly. The recessions of surface at stagnation point at 100 sec of heavy ablator and light-weight ablator are 1.4 mm and 6.6 mm respectively. In addition, the surface temperature at 100 sec is between 1300 K and 1450 K. The surface recession does not occur dramatically in such tempera- ture region. On the other hand, there is little the surface recession at side wall. The temperature of side wall is not Copyright © 2013 SciRes. OJFD  H. KIHARA ET AL. 105 stagnation point has predicted with 2 mm from 1 mm by Suzuki et al. [26]. The present study has good agreement to heavy ablator. Figure 8 shows the history of convec- tive heat flux at stagnation point. The Solid lines show conventional heat flux and the black line shows non ab- lated wall condition for compared. The radiative equilib- rium condition is used at the surface condition. Green and red lines are heavy and light-weight respectively. The dashed line shows net heat flux with surface chemi- cal reaction that includes surface reactions (nitrization, oxization, sublimation). The effusion of pyrolysis gas works effectively to decrease heat flux. The dashed lines are higher than 30% of solid lines. We can see that the surface reaction play important role. In comparison with Flight time, sec Convective heat flux, W/m2 55 60 65 70 75 80 85 1E+06 2E+06 3E+06 4E+06 5E+06 6E+06 w/oablation Heavy ablator Light-weight ablator Figure 8. Time profiles of convective heat flux at stagnation point. Flighttime, sec Radiative heat flux, W/m2 55 60 65 70 7580 85 0 1E+06 2E+06 3E+06 w/o ablation Heavy ablator Light-weightablator Figure 9. Time profiles of radiative heat flux at stagnation point. is not so much. On the other hand, radiative heat ncluding Remarks ulation around Hay- coupled with model and it was clear that th it, the difference between heavy ablator and light-weight ablator flux (Figure 9) does not decrease using by ablating ma- terial. It rather increase slightly cause of radiation from ablating species. It can find a very slight difference be- tween heavy ablator and light-weight ablator in radia- tive heat flux. Temperature distribution along center axis at each time is shown in Figure 10. The peak temperature is 3100 K for heavy ablator and 3200 K for light-weight ablator at 70 sec. The rear wall temperature does not rise until 80 sec. Though there is no heating, the rear wall temperature is increasing at 100 sec. On other hand, the rear wall tem- perature of heavy ablator keeps initial temperature. The light-weight ablator does not have enough thickness for this condition. However, it suggests that it can prevent heat by slightly increasing the thickness of the light- weight ablator. Present study calculated until 100 sec, because the heat flux became quite small estimated in ref. [26]. 4. Co A trajectory-based flow field sim abusa capsule loaded light-weight ablator thermal response was carried out as a test case of near future mission. To validate this calculation, the conven- tional heavy ablator condition was carried out, too. The light-weight ablator in this calculation had been made and tested in our laboratory. In addition, the radiative heat flux had computed using 3-band model extended to nonequilibrium flow. To calculate flow field around capsule, present simula- tion adopted four-temperature e flow field had strong thermal nonequilibrium behind shock wave and thermo-chemical equilibrium near the x, mm Solidtemperature, K 05 10 15 20 25 30 0 500 1000 1500 2000 2500 3000 3500 Heavy 70 sec 75 sec 80 sec 100 sec 60 sec 65 sec 70 sec100 sec Light-Weight Figure 10. Temperature profiles along center axis. Copyright © 2013 SciRes. OJFD  H. KIHARA ET AL. 106 wall surface. The precursor phenomenon could see using four-temperature model. In thermal response for light-weight ablator, the state of the pyrolysis gaits movement play important roles to the flow inside of ablator. The pyrolysis gas heavy ablator flows towaear boundary surface but the pyrolysis gas in light-weight ablator flows none one- dimensionally. The pyrolysis gas flow transports energies to the direction of rear wall and it makes the apparent heat conduction higher. The difference of stagnation hebetween heavy ablator and light-weight ablator is small. Especially radi- ated heat fluxes of these are almost the same. On the other hand, theation heat flux taking account of surface reaction becomes 30% larger than convectional heat flux without surface reaction. The surface recession of light-weight ablator is few time ity. This work was partially po [1] D ial,” Journal of Spacecraft and 08, pp. 854-864. and Thermal Re- sponse Program for Spacecraft Heatshield Analysis,” Journal of Spal. 36, No. 3, 1999 pp. 475-483. n, C. Park and K. Sawada, “Response of Heatshield Heated Wind zaka, H. Kihara and K. Abe, “Experi- ber 2010, IAC-10-C2.7.7. s and rds a n at flux stagn in Material at Stagnation Point of Pioneer-Venus Probes,” Journal of Thermophysics and Heat Transfer, Vol. 16, No. 3, 2002, pp. 432-439. [7] T. Suzuki, K. Sawada, T. Yamada and Y. Inatani, “Ther- mal Response of Ablative Test Piece in Arc- Tun the mental and Numerical Studies of Spallation Particles Ejec- ted from A Light-Weight Ablator,” Proceedings of 61st International Astronautical Congress, Prague, 27 Sep- tember-1 Octo s larger than heavy ablator in addition; the heat [10 transfer is slightly higher than heavy ablator. Therefore, this study shows light-weight ablator in this paper cannot use same configuration of heavy ablator and same thick- ness but it suggests that it can prevent heat by slightly in- creasing the thickness of the lightweight ablator. 5. Acknowledgements The computation was mainly carried using the computer facilities at the Research Institute for Information Tech- nology, Kyushu Univers sup- rted by Grant-in-Aid for Scientific Research, No. 23460954, sponsored by Ministry of Education, Culture, Sports, Science and Technology, Japan. REFERENCES T. Yamada, N. Ishii, Y. Inatani and M. Honda, “Thermal Protection System of the Reentry Capsule with Superor- bital Velocity,” Institute of Space and Astronautical Sci- ence Report Source Publishing No. 17, 2003, pp. 245- 261. [2] M. A. Covington, J. M. Heinemann, H. E. Goldstein, Y.-K. Chen, I. Terrazas-Salinas, J. A. Balboni, J. Olejnic- zak and E. R. Martinez, “Performance of a Lowensity Ablative Heatshield Mater Rockets, Vol. 45, No. 4, 20 [3] T. Yamada, Y. Ishida, T. Suzuki, K. Takasaki, K. Fujita, T. Ogasawara and T. Abe, “Development of High and Low Density Ablators for Dash-II and Future Reentry Missions,” Proceedings of the 27th International Sympo- sium on Space Technology and Science, Tsukuba, 5-12 July 2009, p. e-03. [4] Y. K. Chen and F. S. Milos, “Ablation , cecraft and Rockets, Vo [5] Y. K. Chen and F. S. Milos, “Two-Dimensional Implicit Thermal Response and Ablation Program for Charring Materials,” Journal of Spacecraft and Rockets, Vol. 38, No. 4, 2001, pp. 473-481. [6] H. Ah nel,” AIAA Paper No. 2004-0341, 2004. [8] T. Suzuki, T. Sakai and T. Yamada, “Calculation of Thermal Response of Ablator under Arcjet Flow Condi- tion,” Journal of Thermophysics and Heat Transfer, Vol. 21, No. 2, 2007, pp. 257-266. [9] S. Nozawa, T. Kana ] Y. Takahashi, H. Kihara and K. Abe, “Effect of Radiative Heat Transfer in Arc-Heated Nonequilibrium Flow Simu- lation,” Journal of Physics D: Applied Physics, Vol. 43, 2010, Article ID: 185201. doi:10.1088/0022-3727/43/18/185201 [11] N. Hirata, S. Nozawa, Y. Takahashi, H. Kihara and K. Abe, “Numerical Study of Pyrolysis Gas Flow and Heat Transfer inside an Ablator,” Computational Thermal Sci- nal of Ther- ophysics and Heat Trans- ences, Vol. 4, No. 3, 2012, pp. 225-242. [12] C. Park, R. L. Jaffe and H. Partridge, “Chemical-Kinetic Parameters of Hyperbolic Earth Entry,” Jour mophysics and Heat Transfer, Vol. 15, No. 1, 2001, pp. 76-90. [13] C. Park, “Rotational Relaxation of N2 behind a Strong Shock Wave,” Journal of Therm fer, Vol. 18, No. 4, 2004, pp. 527-533. doi:10.2514/1.11442 [14] C. Park, “Problems of Rate Chemistry in the Flight Re- gimes of Aeroassisted Orbital Transfer Vehicles,” AIAA Paper 84-1730, 1985. [15] J. P. Appleton and K. N. C. Bray, “The Conservation Equations for a Nonequilibrium Plasma,” Journal of Flu- id Mechanics, Vol. 20, No. 4, 1964, pp. 659-672. [16] P. A. Gnoffo, R. N. Gupta and J. L. Sh Equations and Physical Models for Hyp inn, “Conservation ersonic Air Flows ctron and Vibra- ee, “Electron-Impact Vibrational Relaxation in High-Enthalpy and Heat in Thermal and Chemical Nonequilibrium,” National Aeronautics and Space Administration, Washington DC, 1989. [17] S. S. Lazdinis and S. L. Petrie, “Free Ele tional Temperature Nonequilibrium in High Temperature Nitrogen,” Physics of Fluids, Vol. 17, No. 8, 1974, pp. 1539-1546. [18] J.-H. L High-Temperature Nitrogen,” Journal of Thermophysics and Heat Transfer, Vol. 7, No. 3, 1993, pp. 399-405. [19] T. Sakai, “Computational Simulation of Arc Heater Flows,” Journal of Thermophysics Transfer, Vol. 21, No. 1, 2007, pp. 77-85. [20] M. Yamada, Y. Matsuda, H. Hirata, Y. Takahashi, H. Copyright © 2013 SciRes. OJFD  H. KIHARA ET AL. Copyright © 2013 SciRes. OJFD 107 umerical Simulation of Flow Field urnal of Physical and Chemical Paper 2011-3759, 2011. Kihara and K. Abe, “N [23] and Heat Transfer around HAYABUSA Reentry Cap- sule,” Proceedings of the 28th International Symposium on Space Technology and Science, Okinawa, 5-12 June 2011, p. e-38. [21] Y. K. Chen and F. S. Milos, “Loosely Coupled Simula- tion for Two-Dimensional Ablation and Shape Change,” Journal of Spacecraft and Rockets, Vol. 47, No. 5, 2010, pp. 775-785. [22] T. Kanzaka, S. Nozawa, Y. Takahashi, H. Kihara and K. Abe, “Numerical Investigation of Thermal Response of Ablator Exposed to Thermochemical Nonequilibrium Flow,” Proceediongs of the 6th Asian-Pacific Conference on Aerospace Technology and Science, Huangshan, 15-19 November 2009, B2-2. S. Gordon and B. J. McBridge, “Computer Program for Calculation of Complex Chemical Equilibrium Computa- tion and Application,” NASA Reference Publication 1311, 1994. [24] R. L. Potts, “Application of Integral Methods to Ablation Charring Erosion: A Review,” Journal of Spacecraft and Rockets, Vol. 32, No. 2, 1995, pp. 200-209. [25] M. W. Chase Jr., C. A. Davies Jr., J. R. Downey, D. J. Fru- rip, R. A. McDonald and A. N. Syverud, “JANAF Ther- mochemical Tables,” Jo Reference Data, Vol. 14, 1985, pp. 535. [26] T. Suzuki, K. Fujita, T. Yamada, Y. Inatani and N. Ishii, “Post-Flight TPS Analysis fo Hayabusa Reentry Capsul,” AIAA |