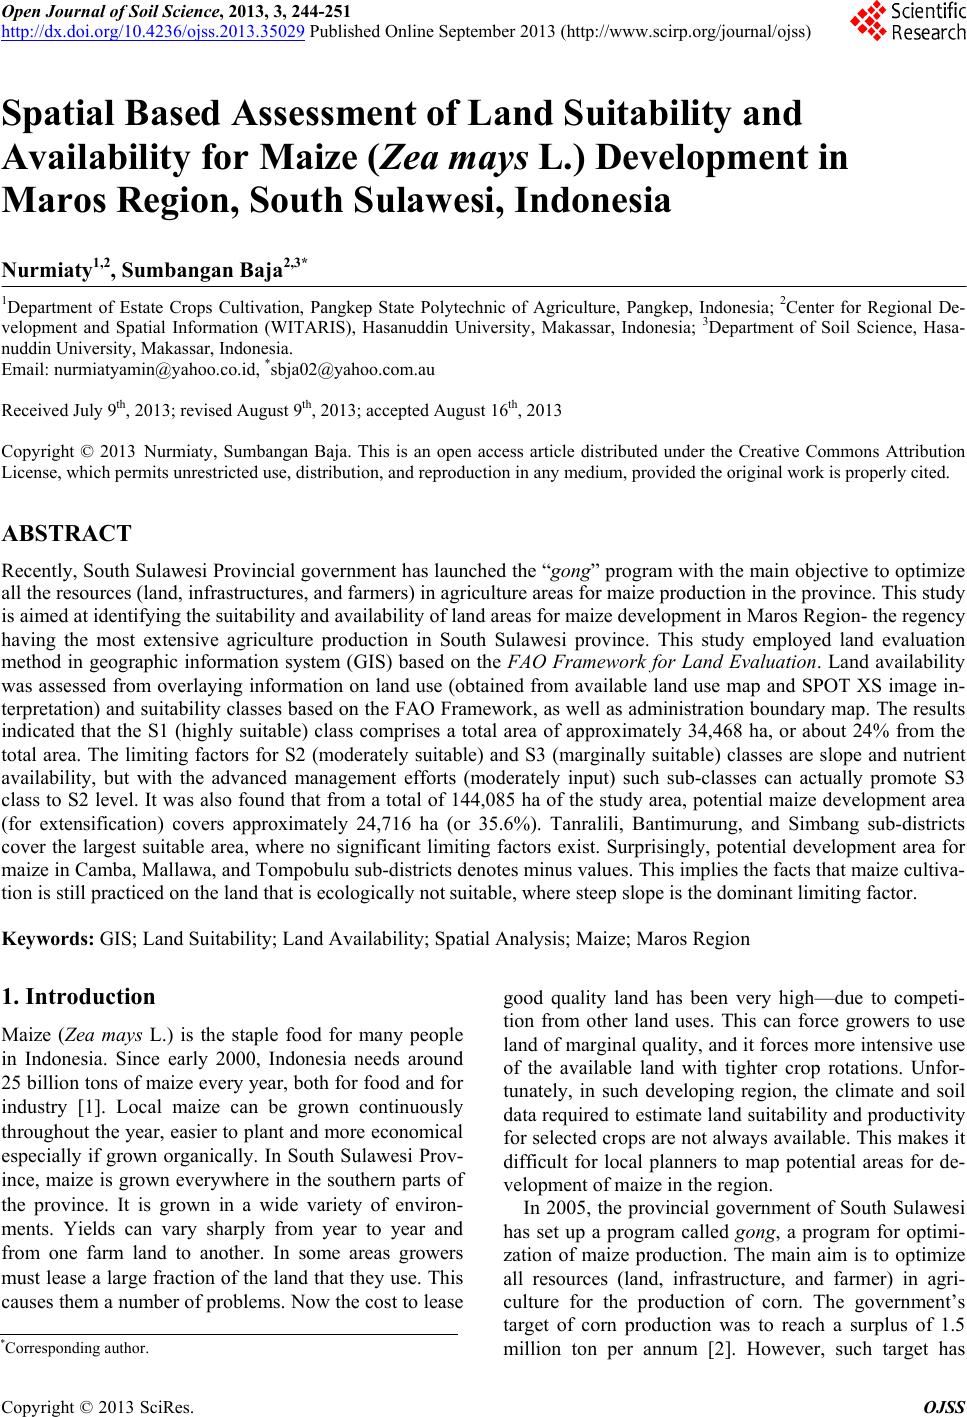
 Open Journal of Soil Science, 2013, 3, 244-251 http://dx.doi.org/10.4236/ojss.2013.35029 Published Online September 2013 (http://www.scirp.org/journal/ojss) Spatial Based Assessment of Land Suitability and Availability for Maize (Zea mays L.) Development in Maros Region, South Sulawesi, Indonesia Nurmiaty1,2, Sumbangan Baja2,3* 1Department of Estate Crops Cultivation, Pangkep State Polytechnic of Agriculture, Pangkep, Indonesia; 2Center for Regional De- velopment and Spatial Information (WITARIS), Hasanuddin University, Makassar, Indonesia; 3Department of Soil Science, Hasa- nuddin University, Makassar, Indonesia. Email: nurmiatyamin@yahoo.co.id, *sbja02@yahoo.com.au Received July 9th, 2013; revised August 9th, 2013; accepted August 16th, 2013 Copyright © 2013 Nurmiaty, Sumbangan Baja. This is an open access article distributed under the Creative Commons Attribution License, which permits unrestricted use, distribution, and reproduction in any medium, provided the original work is properly cited. ABSTRACT Recently, South Sulawesi Provincial government has launched the “gong” program with the main objective to optimize all the resources (land, infrastructures, and farmers) in agriculture areas for maize production in the province. This study is aimed at identifying the suitability and availability of land areas for maize development in Maros Region- the regency having the most extensive agriculture production in South Sulawesi province. This study employed land evaluation method in geographic information system (GIS) based on the FAO Framework for Land Evaluation. Land availability was assessed from overlaying information on land use (obtained from available land use map and SPOT XS image in- terpretation) and suitability classes based on the FAO Framework, as well as administration boundary map. The results indicated that the S1 (highly suitable) class comprises a total area of approximately 34,468 ha, or about 24% from the total area. The limiting factors for S2 (moderately suitable) and S3 (marginally suitable) classes are slope and nutrient availability, but with the advanced management efforts (moderately input) such sub-classes can actually promote S3 class to S2 level. It was also found that from a total of 144,085 ha of the study area, potential maize development area (for extensification) covers approximately 24,716 ha (or 35.6%). Tanralili, Bantimurung, and Simbang sub-districts cover the largest suitable area, where no significant limiting factors exist. Surprisingly, potential development area for maize in Camba, Mallawa, and Tompobulu sub-districts denotes minus values. This implies the facts that maize cultiva- tion is still practiced on the land that is ecologically not suitable, where steep slope is the dominant limiting factor. Keywords: GIS; Land Suitability; Land Availability; Spatial Analysis; Maize; Maros Region 1. Introduction Maize (Zea mays L.) is the staple food for many people in Indonesia. Since early 2000, Indonesia needs around 25 billion tons of maize every year, both for food and for industry [1]. Local maize can be grown continuously throughout the year, easier to plant and more economical especially if grown organically. In South Sulawesi Prov- ince, maize is grown everywhere in the southern parts of the province. It is grown in a wide variety of environ- ments. Yields can vary sharply from year to year and from one farm land to another. In some areas growers must lease a large fraction of the land that they use. This causes them a number of problems. Now the cost to lease good quality land has been very high—due to competi- tion from other land uses. This can force growers to use land of marginal quality, and it forces more intensive use of the available land with tighter crop rotations. Unfor- tunately, in such developing region, the climate and soil data required to estimate land suitability and productivity for selected crops are not always available. This makes it difficult for local planners to map potential areas for de- velopment of maize in the region. In 2005, the provincial government of South Sulawesi has set up a program called gong, a program for optimi- zation of maize production. The main aim is to optimize all resources (land, infrastructure, and farmer) in agri- culture for the production of corn. The government’s target of corn production was to reach a surplus of 1.5 million ton per annum [2]. However, such target has *Corresponding author. Copyright © 2013 SciRes. OJSS 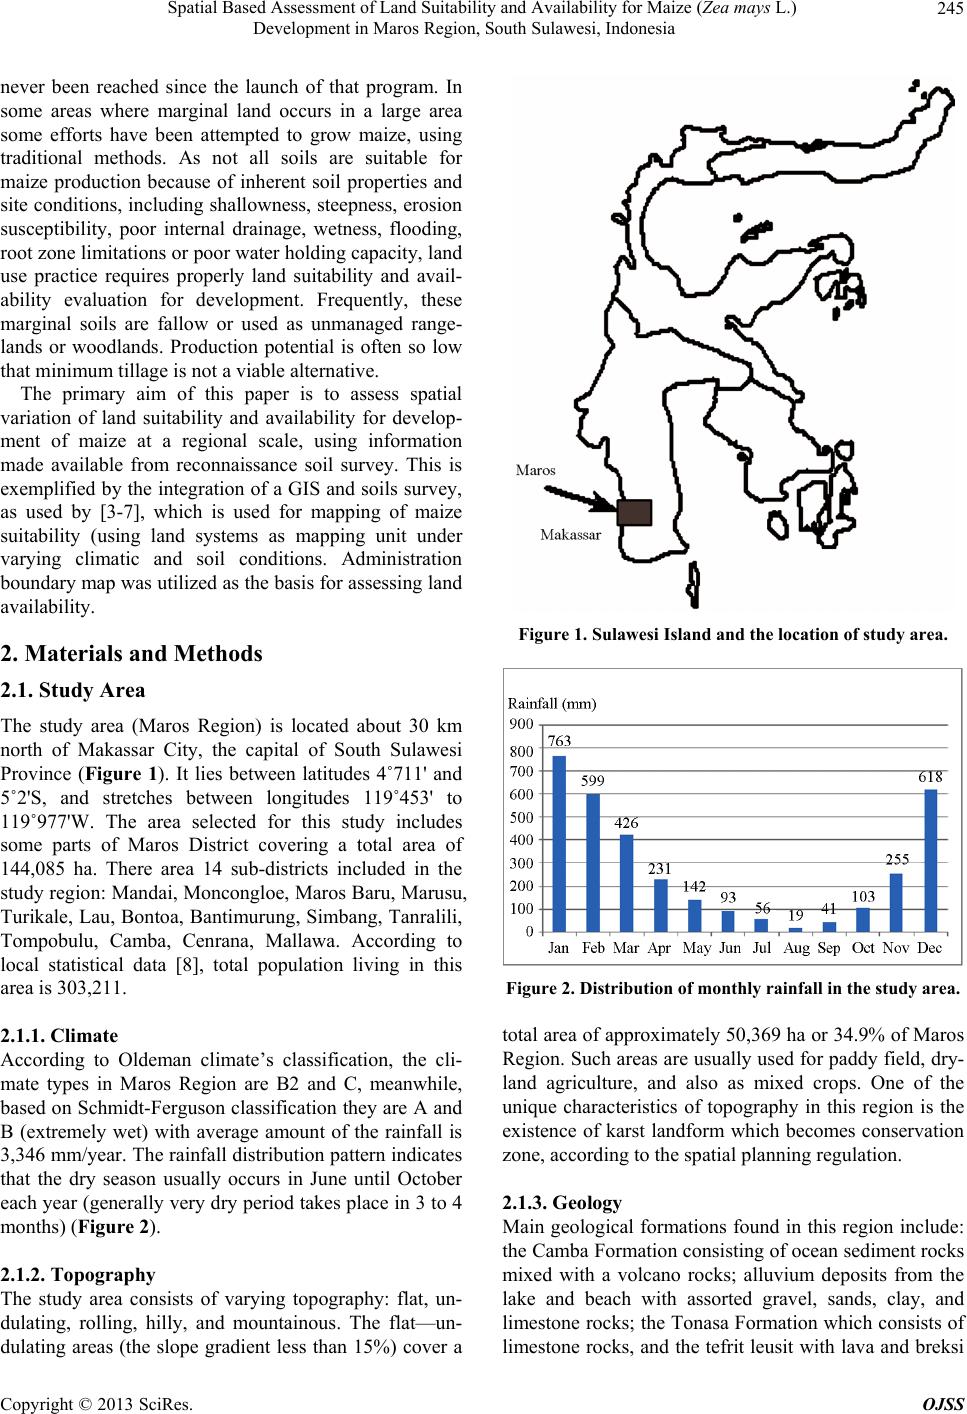 Spatial Based Assessment of Land Suitability and Availability for Maize (Zea mays L.) Development in Maros Region, South Sulawesi, Indonesia 245 never been reached since the launch of that program. In some areas where marginal land occurs in a large area some efforts have been attempted to grow maize, using traditional methods. As not all soils are suitable for maize production because of inherent soil properties and site conditions, including shallowness, steepness, erosion susceptibility, poor internal drainage, wetness, flooding, root zone limitations or poor water holding capacity, land use practice requires properly land suitability and avail- ability evaluation for development. Frequently, these marginal soils are fallow or used as unmanaged range- lands or woodlands. Production potential is often so low that minimum tillage is not a viable alternative. The primary aim of this paper is to assess spatial variation of land suitability and availability for develop- ment of maize at a regional scale, using information made available from reconnaissance soil survey. This is exemplified by the integration of a GIS and soils survey, as used by [3-7], which is used for mapping of maize suitability (using land systems as mapping unit under varying climatic and soil conditions. Administration boundary map was utilized as the basis for assessing land availability. 2. Materials and Methods 2.1. Study Area The study area (Maros Region) is located about 30 km north of Makassar City, the capital of South Sulawesi Province (Figure 1). It lies between latitudes 4˚711' and 5˚2'S, and stretches between longitudes 119˚453' to 119˚977'W. The area selected for this study includes some parts of Maros District covering a total area of 144,085 ha. There area 14 sub-districts included in the study region: Mandai, Moncongloe, Maros Baru, Marusu, Turikale, Lau, Bontoa, Bantimurung, Simbang, Tanralili, Tompobulu, Camba, Cenrana, Mallawa. According to local statistical data [8], total population living in this area is 303,211. 2.1.1. Cli m a te According to Oldeman climate’s classification, the cli- mate types in Maros Region are B2 and C, meanwhile, based on Schmidt-Ferguson classification they are A and B (extremely wet) with average amount of the rainfall is 3,346 mm/year. The rainfall distribution pattern indicates that the dry season usually occurs in June until October each year (generally very dry period takes place in 3 to 4 months) (Figure 2). 2.1.2. Topography The study area consists of varying topography: flat, un- dulating, rolling, hilly, and mountainous. The flat—un- dulating areas (the slope gradient less than 15%) cover a Figure 1. Sulawesi Island and the location of study area. Figure 2. Distribution of monthly rainfall in the study are a . total area of approximately 50,369 ha or 34.9% of Maros Region. Such areas are usually used for paddy field, dry- land agriculture, and also as mixed crops. One of the unique characteristics of topography in this region is the existence of karst landform which becomes conservation zone, according to the spatial planning regulation. 2.1.3. Geology Main geological formations found in this region include: the Camba Formation consisting of ocean sediment rocks mixed with a volcano rocks; alluvium deposits from the lake and beach with assorted gravel, sands, clay, and limestone rocks; the Tonasa Formation which consists of limestone rocks, and the tefrit leusit with lava and breksi Copyright © 2013 SciRes. OJSS 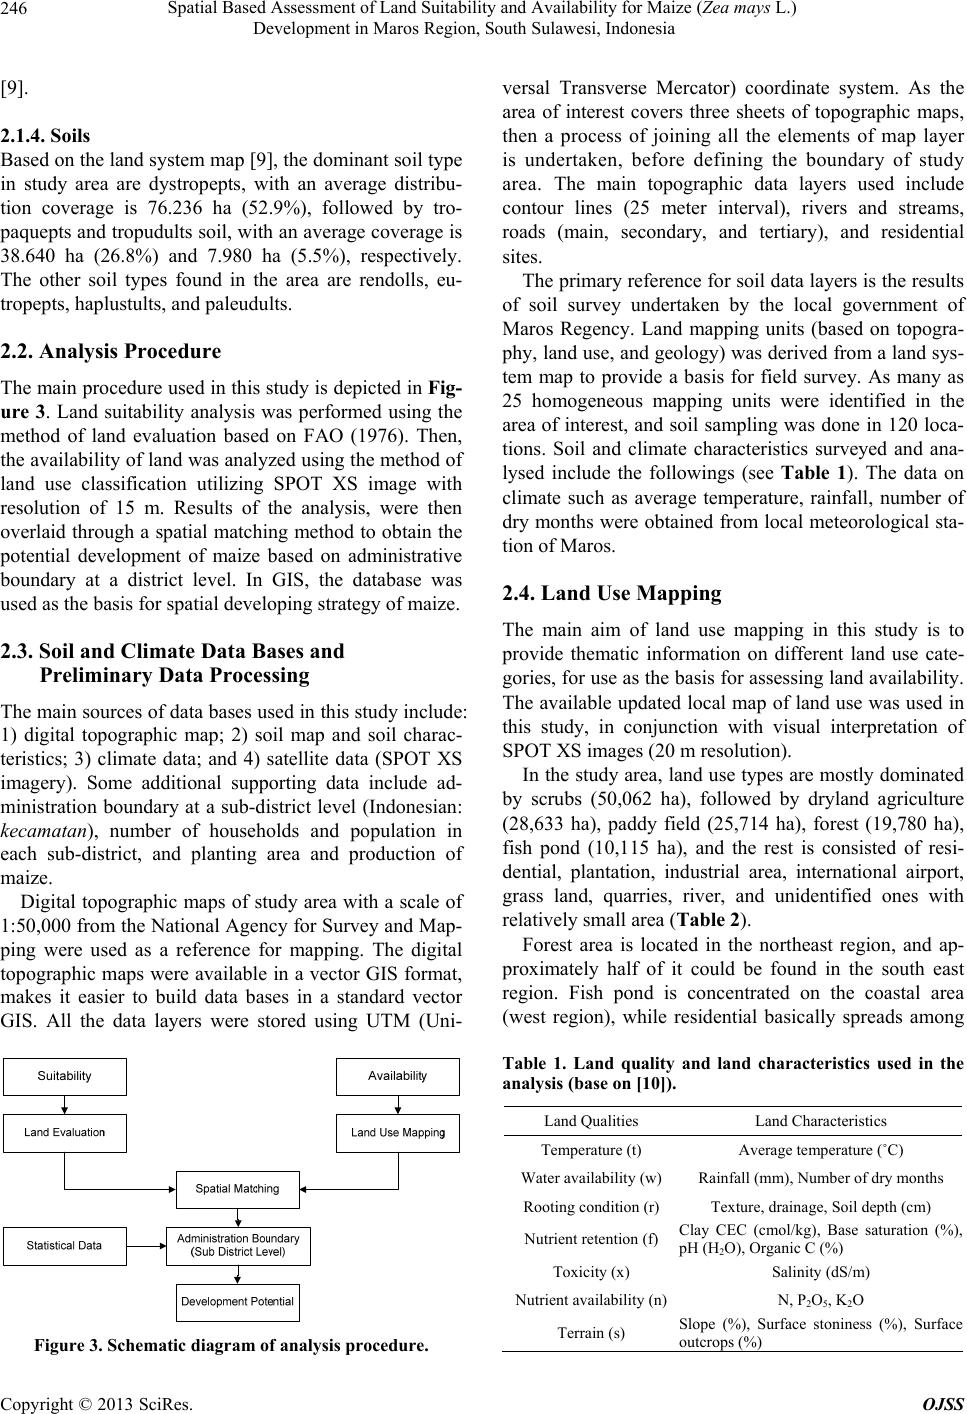 Spatial Based Assessment of Land Suitability and Availability for Maize (Zea mays L.) Development in Maros Region, South Sulawesi, Indonesia 246 [9]. 2.1.4. Soils Based on the land system map [9], the dominant soil type in study area are dystropepts, with an average distribu- tion coverage is 76.236 ha (52.9%), followed by tro- paquepts and tropudults soil, with an average coverage is 38.640 ha (26.8%) and 7.980 ha (5.5%), respectively. The other soil types found in the area are rendolls, eu- tropepts, haplustults, and paleudults. 2.2. Analysis Procedure The main procedure used in this study is depicted in Fig- ure 3. Land suitability analysis was performed using the method of land evaluation based on FAO (1976). Then, the availability of land was analyzed using the method of land use classification utilizing SPOT XS image with resolution of 15 m. Results of the analysis, were then overlaid through a spatial matching method to obtain the potential development of maize based on administrative boundary at a district level. In GIS, the database was used as the basis for spatial developing strategy of maize. 2.3. Soil and Climate Data Bases and Preliminary Data Processing The main sources of data bases used in this study include: 1) digital topographic map; 2) soil map and soil charac- teristics; 3) climate data; and 4) satellite data (SPOT XS imagery). Some additional supporting data include ad- ministration boundary at a sub-district level (Indonesian: kecamatan), number of households and population in each sub-district, and planting area and production of maize. Digital topographic maps of study area with a scale of 1:50,000 from the National Agency for Survey and Map- ping were used as a reference for mapping. The digital topographic maps were available in a vector GIS format, makes it easier to build data bases in a standard vector GIS. All the data layers were stored using UTM (Uni- Figure 3. Schematic diagram of analysis procedure. versal Transverse Mercator) coordinate system. As the area of interest covers three sheets of topographic maps, then a process of joining all the elements of map layer is undertaken, before defining the boundary of study area. The main topographic data layers used include contour lines (25 meter interval), rivers and streams, roads (main, secondary, and tertiary), and residential sites. The primary reference for soil data layers is the results of soil survey undertaken by the local government of Maros Regency. Land mapping units (based on topogra- phy, land use, and geology) was derived from a land sys- tem map to provide a basis for field survey. As many as 25 homogeneous mapping units were identified in the area of interest, and soil sampling was done in 120 loca- tions. Soil and climate characteristics surveyed and ana- lysed include the followings (see Table 1). The data on climate such as average temperature, rainfall, number of dry months were obtained from local meteorological sta- tion of Maros. 2.4. Land Use Mapping The main aim of land use mapping in this study is to provide thematic information on different land use cate- gories, for use as the basis for assessing land availability. The available updated local map of land use was used in this study, in conjunction with visual interpretation of SPOT XS images (20 m resolution). In the study area, land use types are mostly dominated by scrubs (50,062 ha), followed by dryland agriculture (28,633 ha), paddy field (25,714 ha), forest (19,780 ha), fish pond (10,115 ha), and the rest is consisted of resi- dential, plantation, industrial area, international airport, grass land, quarries, river, and unidentified ones with relatively small area (Table 2). Forest area is located in the northeast region, and ap- proximately half of it could be found in the south east region. Fish pond is concentrated on the coastal area (west region), while residential basically spreads among Table 1. Land quality and land characteristics used in the analysis (base on [10]). Land Qualities Land Characteristics Temperature (t) Average temperature (˚C) Water availability (w) Rainfall (mm), Number of dry months Rooting condition (r) Texture, drainage, Soil depth (cm) Nutrient retention (f) Clay CEC (cmol/kg), Base saturation (%), pH (H2O), Organic C (%) Toxicity (x) Salinity (dS/m) Nutrient availability (n)N, P2O5, K2O Terrain (s) Slope (%), Surface stoniness (%), Surface outcrops (%) Copyright © 2013 SciRes. OJSS  Spatial Based Assessment of Land Suitability and Availability for Maize (Zea mays L.) Development in Maros Region, South Sulawesi, Indonesia 247 Table 2. Land use types in the study area. No. Land Use Area (ha) 1 International airport 195.8 2 Forest 19,780.1 3 Industrial area 39.4 4 Unidentified 9.3 5 Residential 3,907.1 6 Plantation 3,853.5 7 Grass land 435.0 8 Paddy field 25,713.5 9 Scrubs 50,062.2 10 River 1,079.7 11 Fish pond (tambak) 10,114.8 12 Quarries 261.3 13 Dryland agriculture 28,633.2 Total area 144,084.8 the downtown area (west region, located in north section of the fish pond areas). Cropping and scrubs are found scattered from the east to middle region of Maros Re- gency (Figure 4). Previous study [11] also suggests those findings. 2.5. Land Suitability Classification Approach Land suitability classification in this study was under- taken based on the framework for land evaluation guide- lines [12], as used by [13-15]. The FAO’s land suitability scheme is divided into Order, Class, Sub Class, and Unit. Order is the global land suitability group, and is divided into S (Suitable) and N (Not Suitable). Class is the land suitability group within the Order level. Land suitability classification is undertaken based on the level of detail of the data available. For example, at a semi detailed map- ping activity the S order is divided into Highly Suitable (S1), Moderately Suitable (S2), and Marginally Suitable (S3). In the “Not Suitable” order no further division is made. Sub-Class is indicated by the type and level or degree of limitations in each division. For example, land unit having a limiting factor of rooting condition at a marginal level is indicated by a Subclass S3rc. Further, detailed divisions of Sub-Classes into Units can be made according to differentiation in soil effective depths. The effective depths of 50 - 70 cm and <50 cm, are respec- tively classified as S3rc1 and S3rc2 [16]. In the present study, suitability classification is under- taken at a class and sub-class levels according to the FAO Framework for Land Evaluation [12]. The classifi- cation at class level adopted is as follows [16,17]: ● Class S1 (highly suitable): land having no significant limitation or only have minor limitations to sustain a given land utilization type without significant reduc- tion in productivity or benefits and will not require major inputs above acceptable level. ● Class S2 (moderately suitable): land having limita- tions which in aggregate are moderately severe for sustained application of the given land utilization type; the limitations will reduce productivity or benefits and increase required inputs to the extent that the overall advantage to be gained from the use, although still attractive, will be appreciable compared to that expected from Class S1 land. ● Class S3 (marginally suitable): land having limita- tions which in aggregate are severe for sustained ap- plication of the given land utilization type and will so reduce productivity or benefits, or increase required inputs, that any expenditure will only be marginally justified. ● Class N (not suitable): land having very severe limi- tations, as the range of inputs required is unjustifiable. Matching processes between soil attributes and crop requirements (as suggested in [12]) were performed in simple overlay and spatial query methods in GIS (see [18-20]). This is to identify spatially suitability classes and subclasses, and the types and degrees of limiting factors in each soil mapping unit. Final suitability maps were then generated, where mapping units were used as a basis for identifying different suitability subclass for maize cultivation. Suitability level is given in actual and potential terms. Actual suitability is a class or subclass that is based on current soil conditions, i.e. without im- provement efforts of applying any input, and the infor- mation is based on physical environment data generated from soil or land resources surveys. Potential suitability is the level that the land unit could reach after a particular improvement. 2.6. Spatial Analysis of Possible Maize Development Areas In this study, a spatial analysis was undertaken to iden- tify the spatial matching between land suitability classes and existing land use types in the study area using a sim- ple overlay technique in GIS. An overlay technique was also applied to identify a spatial match between the result of overlay performed above (between land use and land suitability) and administration boundary (sub-district or kecamatan) layers, taking into account of existing maize cultivation area, using the following function: MDAa fPSS, EGL,= EMA (1) where: MDA(a) = Maize development area for sub- district (a), PSS = potential suitability sub-class area, EGL = existing general land use type, and EMA = existing maize area; all are expressed in ha. Copyright © 2013 SciRes. OJSS 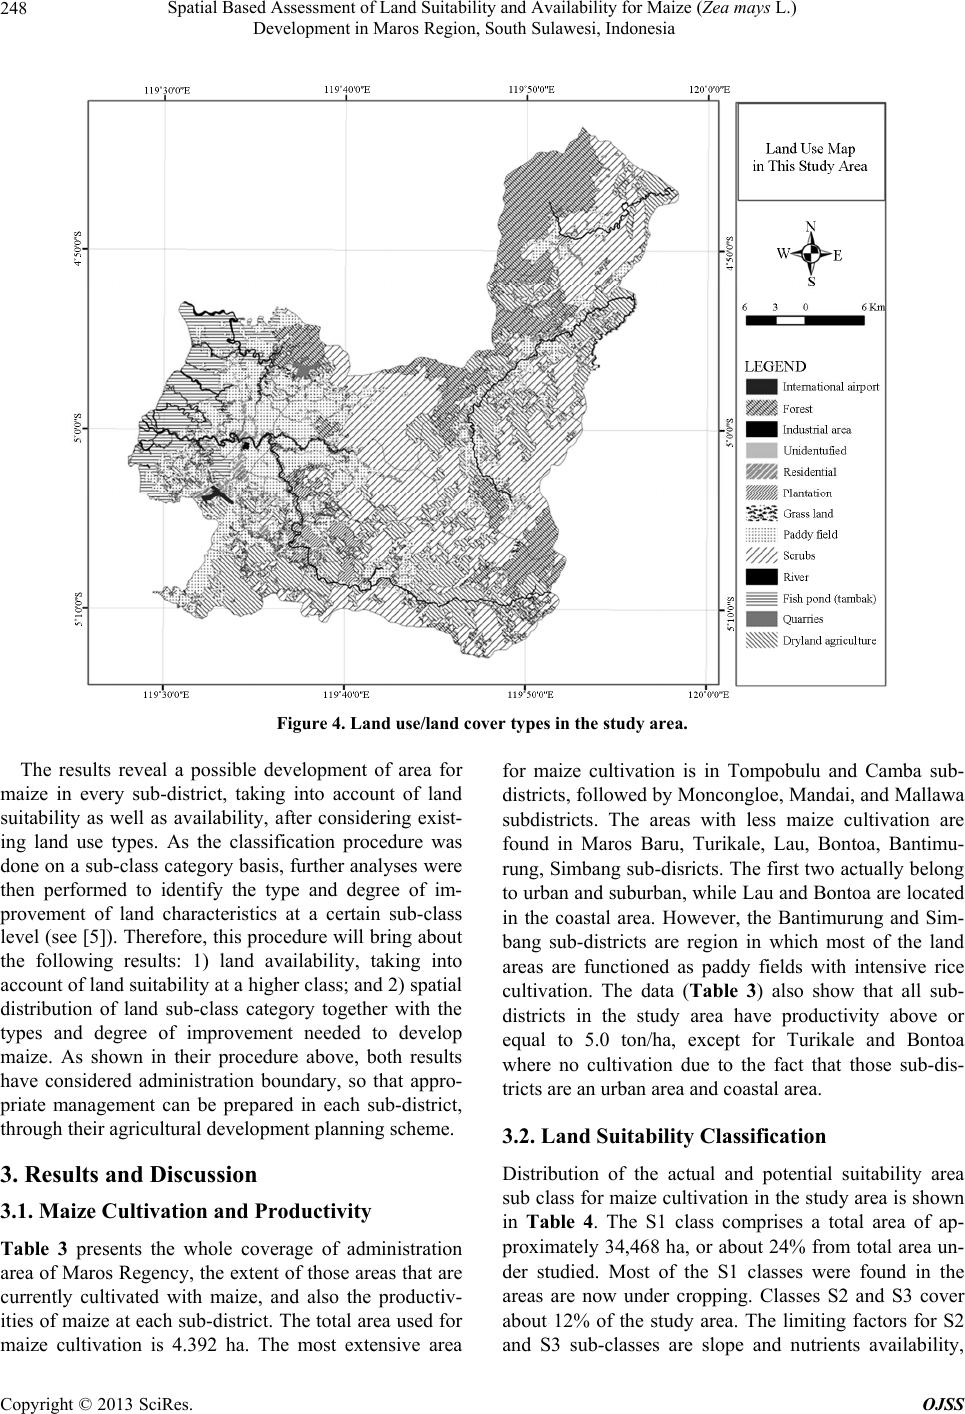 Spatial Based Assessment of Land Suitability and Availability for Maize (Zea mays L.) Development in Maros Region, South Sulawesi, Indonesia Copyright © 2013 SciRes. OJSS 248 Figure 4. Land use/land cover ty pe s in the study area. The results reveal a possible development of area for maize in every sub-district, taking into account of land suitability as well as availability, after considering exist- ing land use types. As the classification procedure was done on a sub-class category basis, further analyses were then performed to identify the type and degree of im- provement of land characteristics at a certain sub-class level (see [5]). Therefore, this procedure will bring about the following results: 1) land availability, taking into account of land suitability at a higher class; and 2) spatial distribution of land sub-class category together with the types and degree of improvement needed to develop maize. As shown in their procedure above, both results have considered administration boundary, so that appro- priate management can be prepared in each sub-district, through their agricultural development planning scheme. for maize cultivation is in Tompobulu and Camba sub- districts, followed by Moncongloe, Mandai, and Mallawa subdistricts. The areas with less maize cultivation are found in Maros Baru, Turikale, Lau, Bontoa, Bantimu- rung, Simbang sub-disricts. The first two actually belong to urban and suburban, while Lau and Bontoa are located in the coastal area. However, the Bantimurung and Sim- bang sub-districts are region in which most of the land areas are functioned as paddy fields with intensive rice cultivation. The data (Table 3) also show that all sub- districts in the study area have productivity above or equal to 5.0 ton/ha, except for Turikale and Bontoa where no cultivation due to the fact that those sub-dis- tricts are an urban area and coastal area. 3.2. Land Suitability Classification 3. Results and Discussion Distribution of the actual and potential suitability area sub class for maize cultivation in the study area is shown in Table 4. The S1 class comprises a total area of ap- proximately 34,468 ha, or about 24% from total area un- der studied. Most of the S1 classes were found in the areas are now under cropping. Classes S2 and S3 cover about 12% of the study area. The limiting factors for S2 and S3 sub-classes are slope and nutrients availability, 3.1. Maize Cultivation and Productivity Table 3 presents the whole coverage of administration area of Maros Regency, the extent of those areas that are currently cultivated with maize, and also the productiv- ities of maize at each sub-district. The total area used for maize cultivation is 4.392 ha. The most extensive area 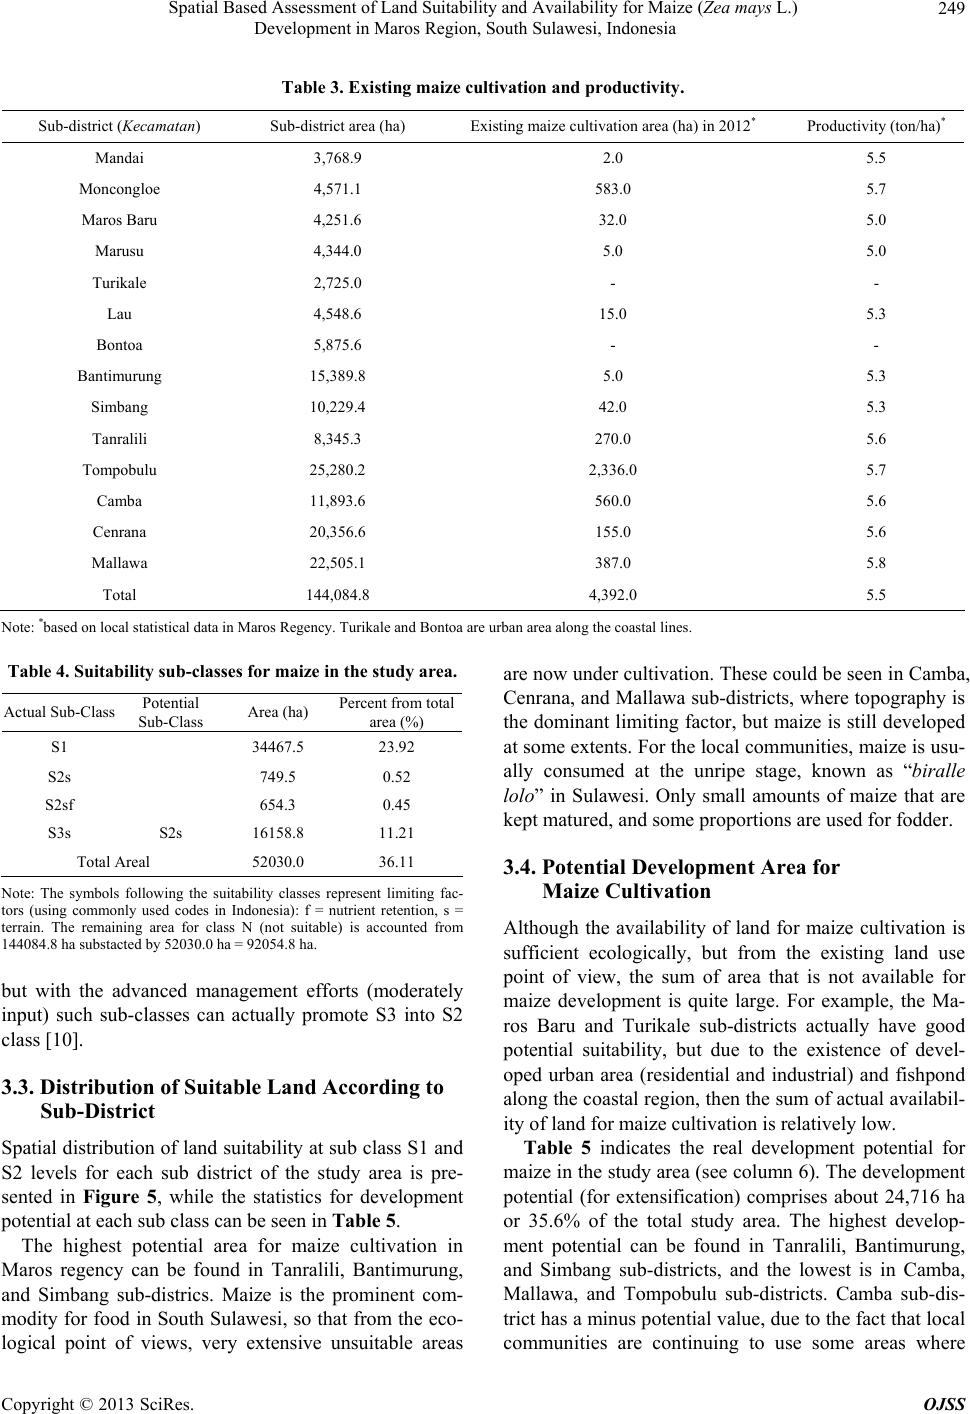 Spatial Based Assessment of Land Suitability and Availability for Maize (Zea mays L.) Development in Maros Region, South Sulawesi, Indonesia 249 Table 3. Existing maize cultivation and productivity. Sub-district (Kecamatan) Sub-district area (ha) Existing maize cultivation area (ha) in 2012* Productivity (ton/ha)* Mandai 3,768.9 2.0 5.5 Moncongloe 4,571.1 583.0 5.7 Maros Baru 4,251.6 32.0 5.0 Marusu 4,344.0 5.0 5.0 Turikale 2,725.0 - - Lau 4,548.6 15.0 5.3 Bontoa 5,875.6 - - Bantimurung 15,389.8 5.0 5.3 Simbang 10,229.4 42.0 5.3 Tanralili 8,345.3 270.0 5.6 Tompobulu 25,280.2 2,336.0 5.7 Camba 11,893.6 560.0 5.6 Cenrana 20,356.6 155.0 5.6 Mallawa 22,505.1 387.0 5.8 Total 144,084.8 4,392.0 5.5 Note: *based on local statistical data in Maros Regency. Turikale and Bontoa are urban area along the coastal lines. Table 4. Suitability sub-classes for maize in the study area. Actual Sub-Class Potential Sub-Class Area (ha) Percent from total area (%) S1 34467.5 23.92 S2s 749.5 0.52 S2sf 654.3 0.45 S3s S2s 16158.8 11.21 Total Areal 52030.0 36.11 Note: The symbols following the suitability classes represent limiting fac- tors (using commonly used codes in Indonesia): f = nutrient retention, s = terrain. The remaining area for class N (not suitable) is accounted from 144084.8 ha substacted by 52030.0 ha = 92054.8 ha. but with the advanced management efforts (moderately input) such sub-classes can actually promote S3 into S2 class [10]. 3.3. Distribution of Suitable Land According to Sub-District Spatial distribution of land suitability at sub class S1 and S2 levels for each sub district of the study area is pre- sented in Figure 5, while the statistics for development potential at each sub class can be seen in Table 5. The highest potential area for maize cultivation in Maros regency can be found in Tanralili, Bantimurung, and Simbang sub-districs. Maize is the prominent com- modity for food in South Sulawesi, so that from the eco- logical point of views, very extensive unsuitable areas are now under cultivation. These could be seen in Camba, Cenrana, and Mallawa sub-districts, where topography is the dominant limiting factor, but maize is still developed at some extents. For the local communities, maize is usu- ally consumed at the unripe stage, known as “biralle lolo” in Sulawesi. Only small amounts of maize that are kept matured, and some proportions are used for fodder. 3.4. Potential Development Area for Maize Cultivation Although the availability of land for maize cultivation is sufficient ecologically, but from the existing land use point of view, the sum of area that is not available for maize development is quite large. For example, the Ma- ros Baru and Turikale sub-districts actually have good potential suitability, but due to the existence of devel- oped urban area (residential and industrial) and fishpond along the coastal region, then the sum of actual availabil- ity of land for maize cultivation is relatively low. Table 5 indicates the real development potential for maize in the study area (see column 6). The development potential (for extensification) comprises about 24,716 ha or 35.6% of the total study area. The highest develop- ment potential can be found in Tanralili, Bantimurung, and Simbang sub-districts, and the lowest is in Camba, Mallawa, and Tompobulu sub-districts. Camba sub-dis- trict has a minus potential value, due to the fact that local communities are continuing to use some areas where Copyright © 2013 SciRes. OJSS  Spatial Based Assessment of Land Suitability and Availability for Maize (Zea mays L.) Development in Maros Region, South Sulawesi, Indonesia 250 Figure 5. Land suitability map for maize development. Table 5. Suitable area and real potential development area for maize. Sub-district (Kecamatan) Total sub-district area (ha) Area for S1 and S2 classes (ha) Existing maize cultivation area (ha)* Potential development area (ha) Real potential development (ha)** Mandai 3768.9 3303.1 2.0 2975.1 2252.6 Moncongloe 4571.1 2904.8 583.0 2135.8 2036.8 Maros Baru 4251.6 2289.4 32.0 2259.4 1347.3 Marusu 4344.0 2757.7 5.0 2665.7 2004.6 Turikale 2725.0 2497.6 - 2497.6 1752.3 Lau 4548.6 2756.5 15.0 2754.5 2175.2 Bontoa 5875.6 1947.7 - 1939.7 1119.5 Bantimurung 15389.8 4788.8 5.0 4759.8 4107.6 Simbang 10229.4 3688.0 42.0 3665.0 3446.0 Tanralili 8345.3 5669.5 270.0 5444.5 5059.4 Tompobulu 25280.2 1540.3 2336.0 (−235.8) −286.1 Camba 11893.6 280.0 560.0 (−1162.0) −1221.0 Cenrana 20356.6 1447.9 155.0 1372.9 1247.0 Mallawa 22505.1 - 387.0 (−325.0) −325.0 Total 144084.8 35871.2 4392.0 30747.2 24716.1 Note: *based on 2012 local statistical data in Maros District; **After deducting potential development area with land use types that cannot be converted to other uses, such as urban/residential area, water body, conservation forest, and fish pond); Sub districts Turikale, Maros Baru, and Lau are included in urban area of Maros, while Bontoa is coastal area. ecologically is actually not suitable for maize cultivations (in this case slope gradient is the dominant limiting factor). Copyright © 2013 SciRes. OJSS  Spatial Based Assessment of Land Suitability and Availability for Maize (Zea mays L.) Development in Maros Region, South Sulawesi, Indonesia 251 4. Conclusions Land suitability and availability analyses have been per- formed using a GIS to produce recommendations for local government in devising agricultural land develop- ment in Maros Regency. There are about 36.1% of the area which is suitable for maize development, with the main limiting factors include nutrient retention (f) and terrain or slope (s). With reference to land suitability classes for maize (at level S1 and S2), existing land use type (derived from SPOT XS images), and the area currently cultivated with maize, there can still be found suitable areas for Maros Region for maize development (for extensification pur- poses). With the assumption that the regional govern- ment will give the highest priority for area with potential suitability class S1 (suitable) and S2 (moderately suitable) for maize development, then there will be a total of 24,716 ha (or 35.6% from total suitable area S1, S2, and S3) of land which is available for maize development. 5. Acknowledgements The authors would like to thank the Maros Regency go- vernment (through The Bappeda Maros) for providing data, fund, and other supporting facilities for this study. Advice and support given by the Center for Regional Development and Spatial Information (WITARIS), Ha- sanuddin University, Indonesia, are highly appreciated. REFERENCES [1] Government of the Republic of Indonesia, “Rencana Pembangunan Jangka Panjang Nasional (RPJPN),” Bap- penas, Jakarta, 2005. [2] Government of South Sulawesi, “Gerakan Optimalisasi Jagung (GONG),” Bappeda Sulsel, Makassar, 2005. [3] M. H. Al-Mashreki, J. B. M. Akhir, S. A. Rahim, K. Md. Desa, T. Lihan and A. R. Haider, ”Land Suitability Evalu- ation For Sorghum Crop in the Ibb Governorate, Republic of Yemen Using Remote Sensing And GIS Techniques,” Austral ian Jou rnal of Basi c and Appl ied Sci ences, Vol. 5, No. 3, 2011, pp. 359-368. [4] A. A. Jafarzadeh, P. Alamdari, M. R. Neyshabouri and S. Saedi, “Land Suitability Evaluation of Bilverdy Research Station for Wheat, Barley, Alfalfa, Maize and Safflower,” Soil and Water Research, Vol. 3, 2008, pp. 581-588. [5] A. Keshavarzi, F. Sarmadian, A. Heidari and M. Omid, “Land Suitability Evaluation Using Fuzzy Continuous Classification (A Case Study: Ziaran Region),” Modern Applied Science, Vol. 4, No. 7, 2010. pp. 72-81 [6] M. Albaji, A. A. Naseri, P. Papan and S. B. Nasab, “Qualitative Evaluation of Land Suitability for Principal Crops in The West Shoush Plain, Southwest Iran,” Bul- garian Journal of Agricultural Science, Vol. 15, No. 2, 2009, pp. 135-145. [7] M. Elaalem, “Land Suitability Evaluation for Sorghum Based on Boolean and Fuzzy-Multi-Criteria Decision Analysis Methods,” International Journal of Environ- mental Science and Development, Vol. 3, No. 4, 2012, pp. 357-361. [8] Badan Pusat Statistik Kabupaten Maros, “Kabupaten Maros Dalam Angka,” Pemerintah Kabupaten Maros, Maros, 2009. [9] RePPProT, “The Land Resources of Indonesia: A Na- tional Overview Main Report,” United Kingdom-ODA NRI, Ditjen Pankim, Department of Transmigration, Ja- karta, 1988. [10] D. Djaenuddin, Basuni, S. Hardjowigeno, H. Subagyo, M. Sukardi, I. M. Ds, N. Suharta, L. Hakim, Widagdo, J. Dai, V. Suwandi, S. Bachri and E. R. Jordens, “Kesesuaian Lahan untuk Tanaman Pertanian dan Tanaman Kehutanan (Land Suitability for Agricultural and Silvicultural Plants),” Second Land Resource Evaluation and Planning Project, ADB Loan No. 1099 INO. Centre for Soil and Agroclimate Research, Bogor, 1994. [11] S. Baja dan A. M. Sallatu, “Analisis Penutup Lahan Daerah Maros Sulawesi Selatan,” Berita Inderaja LAPAN, Vol. 4, No. 7, 2006, pp. 16-18. [12] FAO, “A Framework of Land Evaluation,” FAO Soil Bulletin, No.6, Rome, 1976. [13] Sh. Ashraf, R. Manoukyan and Sh. Ayoubi, “Land Suit- ability Evaluation in Damghan Plain for Barley, Using Compare and Conformity Methods (Northeast-Iran),” Pakistan Journal of Biological Sciences, Vol. 14, No. 2, 2011, pp.123-127. doi:10.3923/pjbs.2011.123.127 [14] T.S. Babalola, T. Oso, A.S. Fasina and K. Godonu, “Land Evaluation Studies of Two Wetland Soils in Nigeria,” In- ternational Research Journal of Agricultural Science and Soil Science, Vol. 1, No. 6, 2011, pp. 193-204. [15] V. R. N. Chinene, “Land Evaluation Using The FAO Framework: An Example from Zambia,” Soil Use and Management, Vol. 8, No. 3, 2007. pp. 130-138. [16] D. Djaenudin, H. Marwan and dan A. Hidayat, “Petunjuk Teknis Evaluasi Lahan untuk Komoditas Pertanian,” Versi 3, Balai Penelitian Tanah, Puslitbang Tanah dan Agrok- limat, Bogor, 2003. [17] S. Baja, “Perencanaan Tata Guna Lahan dalam Pengem- bangan Wilayah: Pendekatan Spasial dan Aplikasinya” Penerbit Andi, Yogyakarta, 2012. [18] S. Baja, D. M. Chapman and D. Dragovich, “A Concep- tual Model for Assessing Agricultural Land Suitability at a Catchment Level Using a Continuous Approach in GIS,” Proceedings of the Geospatial Information and Ag- riculture Conference, Sydney NSW Agriculture, Sydney, 16-19 July 2001, pp. 828-841. [19] S. Baja, D. M. Chapman and D. Dragovich, “A Con- ceptual Model for Defining and Assessing Land Man- agement Units Using a Fuzzy Modelling Approach in GIS Environment,” Environmental Management, Vol. 29, No. 5, 2002, pp. 647-661. doi:10.1007/s00267-001-0053-8 [20] S. Baja, “Metode Analitik Evaluasi Sumberdaya Lahan,” Makassar, 2012. Copyright © 2013 SciRes. OJSS
|