 Open Journal of Soil Science, 2013, 3, 225-234 http://dx.doi.org/10.4236/ojss.2013.35027 Published Online September 2013 (http://www.scirp.org/journal/ojss) 225 Comparison of Methods to Remediate Compacted Soils for Infiltration and Vegetative Establishment Matthew A. Haynes, Richard A. McLaughlin, Joshua L. Heitman Department of Soil Science, North Carolina State University, Raleigh, US. Email: rich_mclaughlin@ncsu.edu Received June 14th, 2013; revised July 14th, 2013; accepted July 21st, 2013 Copyright © 2013 Matthew A. Haynes et al. This is an open access article distributed under the Creative Commons Attribution Li- cense, which permits unrestricted use, distribution, and reproduction in any medium, provided the original work is properly cited. ABSTRACT The process of constructing roads and buildings usually involves the removal of topsoil and grading of the subsoil fol- lowed by a variety of activities using heavy equipment. This presents multiple challenges in attempts to establish vege- tation on these areas: low nutrient soils with little organic matter, high bulk densities, and low infiltration rates. The goals of this preliminary study were to quantify the impacts of soil compaction remediation methods on infiltration, runoff water quality, and vegetation establishment. The objectives were to measure: 1) steady state infiltration rate (IR); 2) quantity and quality of storm water runoff; and 3) ground cover, biomass production, and rooting depth of vegetation during early establishment. We evaluated four treatments: a compacted soil (C), a compacted soil with core aeration (A), a compacted soil with deep (20 - 30 cm) tillage (DT), and a compacted soil with deep tillage and incorporated compost (CT). Sites 1 and 2 received C, A and DT treatments and Site 3 received only DT and CT treatments. At Site 1, runoff from natural rainfall events was collected in plastic tubs at the bottom of each 2 × 1 m plot, and samples were measured for volume and sediment. Infiltration rates were determined using a Cornell Sprinkle Infiltrometer at all three sites. At Site 1, the A treatment had a higher erosion rate during two of four rain events and higher runoff volume during three of four rain events, when compared to C and DT. However, the aerator was only able to penetrate 1 - 2 cm due to the com- pacted soil. Average event runoff ranged from 0 to 22% (0 - 9.3 mm), 10 to 60% (1.9 - 26.2 mm), and 0 to 3.5% (0 - 1.1 mm) of the total rainfall for C, A, and DT, respectively. There was no difference between C and A for vegetative bio- mass and IR, but both biomass and IR were greater in the DT plots. Treatment DT had an average IR of 15 cm·hr−1, compared to 0.16 and 0.21 cm·hr−1 for C and A, respectively. Roots were much more abundant at the 20 - 50 cm depths with DT. At Site 2, there were no significant differences in IR, with many values too low to be measured with the infil- trometer. Vegetative cover also did not differ between the three treatments due to poor (16% - 22% cover) grass estab- lishment. Infiltration rates at Site 3 were measured immediately after tillage and were 10× those at Site 2, measured 2 months after tillage, but DT and CT values were not different. The results suggest that deep tillage prior to seeding could maximize long-term vegetation growth and provide areas of high infiltration to minimize post-construction stormwater discharges, as long as vigorous vegetation can be established quickly. Keywords: Compaction; Infiltration; Tillage; Root Growth; Construction Sites 1. Introduction Soil compaction increases storm water runoff, which carries sediment and other harmful pollutants into water bodies. Soil on construction sites may be compacted for structural strength or inadvertently compacted by heavy machinery [1]. Such compaction can also result in a de- crease in vegetative stand [2] and can inhibit root growth, reduce nutrient uptake, and increase plant disease [3]. Heavy axle loads found on construction equipment, such as backhoes, dump trucks, and pickup trucks, can increase bulk density substantially [1]. In sandy soils in Florida (USA), Gregory et al. found bulk density was consistently higher inside construction areas compared to outside areas, which led to root limiting densities aver- aging 1.94 Mg·m−3, with the untrafficked controls aver- aging 1.74 Mg·m−3 [1]. Land grading activities on clay soils of Denmark have been demonstrated to compact soil to 1.8 - 2.0 Mg·m−3 [4]. Infiltration rates are significantly reduced by compac- tion due to the destruction of soil structure, resulting in increased surface runoff. In the Florida study, infiltration rates were decreased 70% - 99% under even the lowest Copyright © 2013 SciRes. OJSS 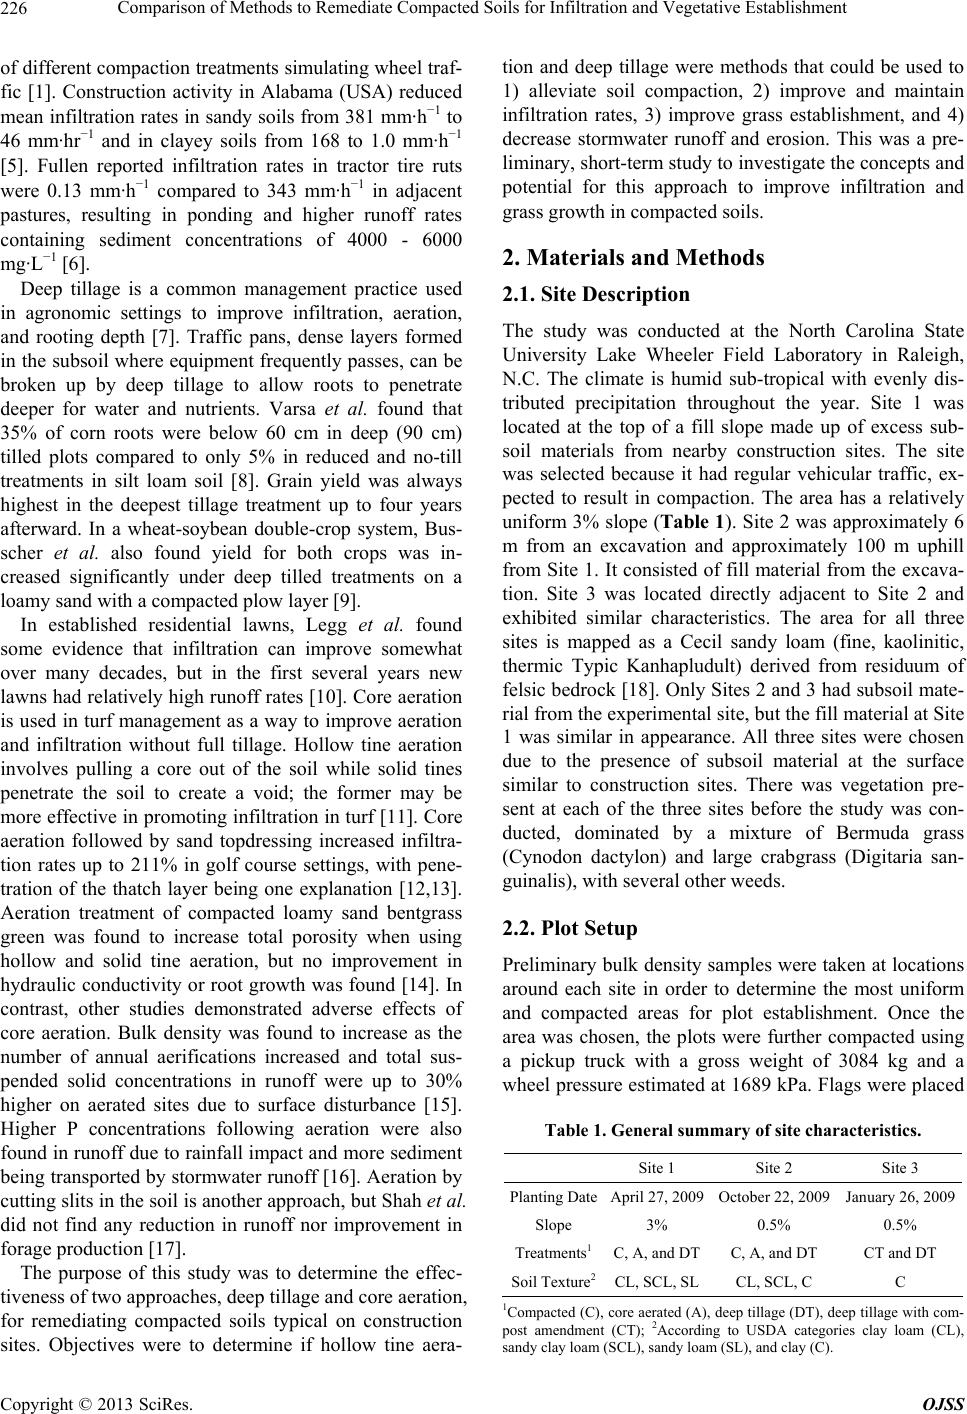 Comparison of Methods to Remediate Compacted Soils for Infiltration and Vegetative Establishment 226 of different compaction treatments simulating wheel traf- fic [1]. Construction activity in Alabama (USA) reduced mean infiltration rates in sandy soils from 381 mm·h−1 to 46 mm·hr−1 and in clayey soils from 168 to 1.0 mm·h−1 [5]. Fullen reported infiltration rates in tractor tire ruts were 0.13 mm·h−1 compared to 343 mm·h−1 in adjacent pastures, resulting in ponding and higher runoff rates containing sediment concentrations of 4000 - 6000 mg· L −1 [6]. Deep tillage is a common management practice used in agronomic settings to improve infiltration, aeration, and rooting depth [7]. Traffic pans, dense layers formed in the subsoil where equipment frequently passes, can be broken up by deep tillage to allow roots to penetrate deeper for water and nutrients. Varsa et al. found that 35% of corn roots were below 60 cm in deep (90 cm) tilled plots compared to only 5% in reduced and no-till treatments in silt loam soil [8]. Grain yield was always highest in the deepest tillage treatment up to four years afterward. In a wheat-soybean double-crop system, Bus- scher et al. also found yield for both crops was in- creased significantly under deep tilled treatments on a loamy sand with a compacted plow layer [9]. In established residential lawns, Legg et al. found some evidence that infiltration can improve somewhat over many decades, but in the first several years new lawns had relatively high runoff rates [10]. Core aeration is used in turf management as a way to improve aeration and infiltration without full tillage. Hollow tine aeration involves pulling a core out of the soil while solid tines penetrate the soil to create a void; the former may be more effective in promoting infiltration in turf [11]. Core aeration followed by sand topdressing increased infiltra- tion rates up to 211% in golf course settings, with pene- tration of the thatch layer being one explanation [12,13]. Aeration treatment of compacted loamy sand bentgrass green was found to increase total porosity when using hollow and solid tine aeration, but no improvement in hydraulic conductivity or root growth was found [14]. In contrast, other studies demonstrated adverse effects of core aeration. Bulk density was found to increase as the number of annual aerifications increased and total sus- pended solid concentrations in runoff were up to 30% higher on aerated sites due to surface disturbance [15]. Higher P concentrations following aeration were also found in runoff due to rainfall impact and more sediment being transported by stormwater runoff [16]. Aeration by cutting slits in the soil is another approach, but Shah et al. did not find any reduction in runoff nor improvement in forage production [17]. The purpose of this study was to determine the effec- tiveness of two approaches, deep tillage and core aeration, for remediating compacted soils typical on construction sites. Objectives were to determine if hollow tine aera- tion and deep tillage were methods that could be used to 1) alleviate soil compaction, 2) improve and maintain infiltration rates, 3) improve grass establishment, and 4) decrease stormwater runoff and erosion. This was a pre- liminary, short-term study to investigate the concepts and potential for this approach to improve infiltration and grass growth in compacted soils. 2. Materials and Methods 2.1. Site Description The study was conducted at the North Carolina State University Lake Wheeler Field Laboratory in Raleigh, N.C. The climate is humid sub-tropical with evenly dis- tributed precipitation throughout the year. Site 1 was located at the top of a fill slope made up of excess sub- soil materials from nearby construction sites. The site was selected because it had regular vehicular traffic, ex- pected to result in compaction. The area has a relatively uniform 3% slope (Table 1). Site 2 was approximately 6 m from an excavation and approximately 100 m uphill from Site 1. It consisted of fill material from the excava- tion. Site 3 was located directly adjacent to Site 2 and exhibited similar characteristics. The area for all three sites is mapped as a Cecil sandy loam (fine, kaolinitic, thermic Typic Kanhapludult) derived from residuum of felsic bedrock [18]. Only Sites 2 and 3 had subsoil mate- rial from the experimental site, but the fill material at Site 1 was similar in appearance. All three sites were chosen due to the presence of subsoil material at the surface similar to construction sites. There was vegetation pre- sent at each of the three sites before the study was con- ducted, dominated by a mixture of Bermuda grass (Cynodon dactylon) and large crabgrass (Digitaria san- guinalis), with several other weeds. 2.2. Plot Setup Preliminary bulk density samples were taken at locations around each site in order to determine the most uniform and compacted areas for plot establishment. Once the area was chosen, the plots were further compacted using a pickup truck with a gross weight of 3084 kg and a wheel pressure estimated at 1689 kPa. Flags were placed Table 1. General summary of site characteristics. Site 1 Site 2 Site 3 Planting DateApril 27, 2009October 22, 2009 January 26, 2009 Slope 3% 0.5% 0.5% Treatments1C, A, and DTC, A, and DT CT and DT Soil Texture2CL, SCL, SLCL, SCL, C C 1Compacted (C), core aerated (A), deep tillage (DT), deep tillage with com- post amendment (CT); 2According to USDA categories clay loam (CL), sandy clay loam (SCL), sandy loam (SL), and clay (C). Copyright © 2013 SciRes. OJSS 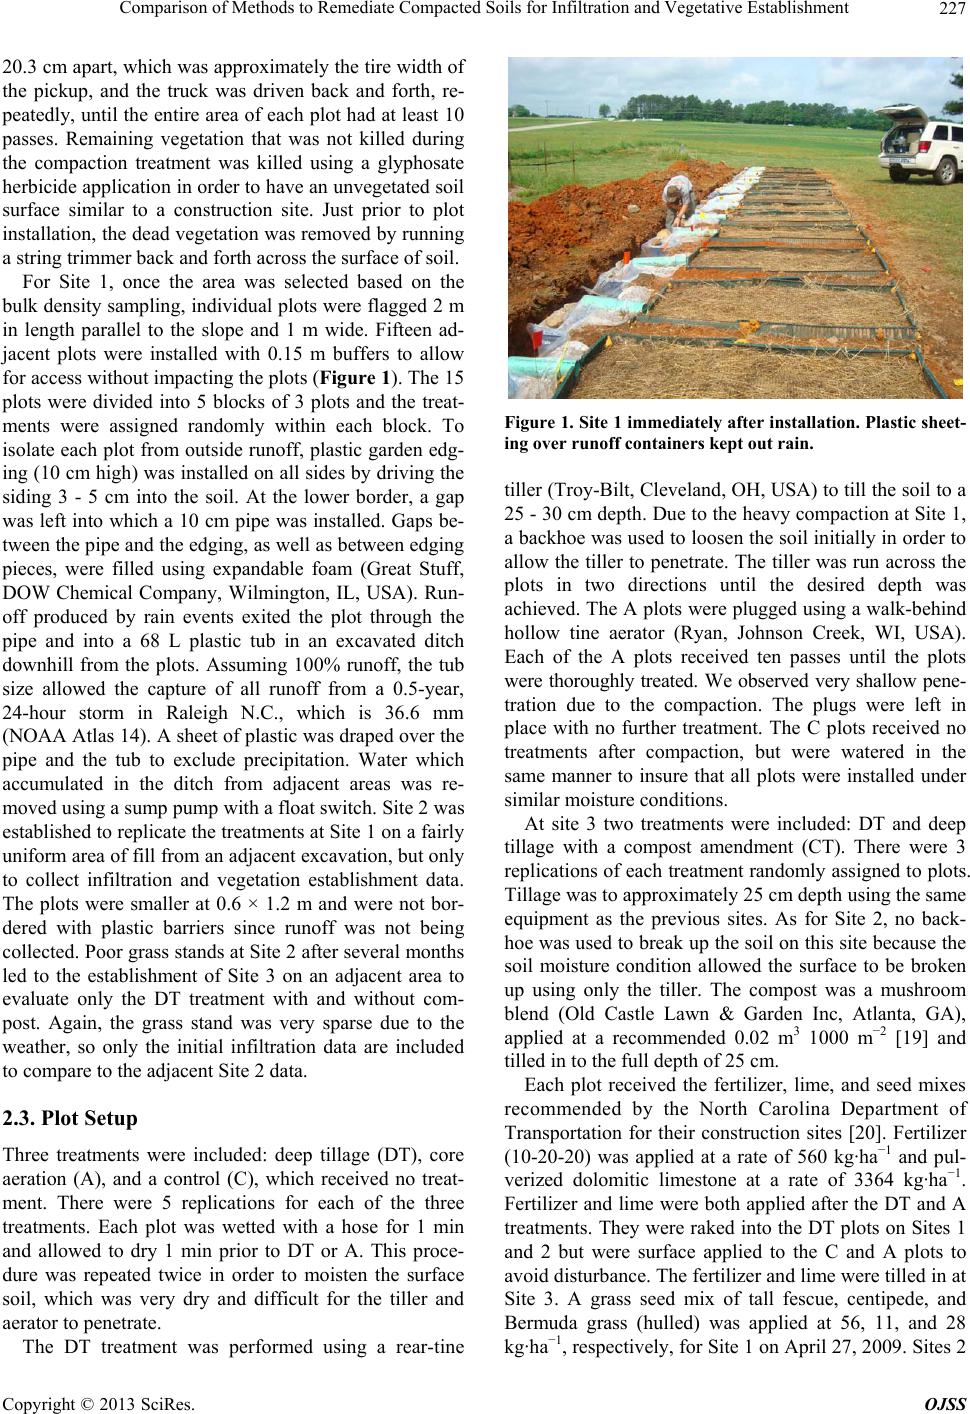 Comparison of Methods to Remediate Compacted Soils for Infiltration and Vegetative Establishment 227 20.3 cm apart, which was approximately the tire width of the pickup, and the truck was driven back and forth, re- peatedly, until the entire area of each plot had at least 10 passes. Remaining vegetation that was not killed during the compaction treatment was killed using a glyphosate herbicide application in order to have an unvegetated soil surface similar to a construction site. Just prior to plot installation, the dead vegetation was removed by running a string trimmer back and forth across the surface of soil. For Site 1, once the area was selected based on the bulk density sampling, individual plots were flagged 2 m in length parallel to the slope and 1 m wide. Fifteen ad- jacent plots were installed with 0.15 m buffers to allow for access without impacting the plots (Figure 1). The 15 plots were divided into 5 blocks of 3 plots and the treat- ments were assigned randomly within each block. To isolate each plot from outside runoff, plastic garden edg- ing (10 cm high) was installed on all sides by driving the siding 3 - 5 cm into the soil. At the lower border, a gap was left into which a 10 cm pipe was installed. Gaps be- tween the pipe and the edging, as well as between edging pieces, were filled using expandable foam (Great Stuff, DOW Chemical Company, Wilmington, IL, USA). Run- off produced by rain events exited the plot through the pipe and into a 68 L plastic tub in an excavated ditch downhill from the plots. Assuming 100% runoff, the tub size allowed the capture of all runoff from a 0.5-year, 24-hour storm in Raleigh N.C., which is 36.6 mm (NOAA Atlas 14). A sheet of plastic was draped over the pipe and the tub to exclude precipitation. Water which accumulated in the ditch from adjacent areas was re- moved using a sump pump with a float switch. Site 2 was established to replicate the treatments at Site 1 on a fairly uniform area of fill from an adjacent excavation, but only to collect infiltration and vegetation establishment data. The plots were smaller at 0.6 × 1.2 m and were not bor- dered with plastic barriers since runoff was not being collected. Poor grass stands at Site 2 after several months led to the establishment of Site 3 on an adjacent area to evaluate only the DT treatment with and without com- post. Again, the grass stand was very sparse due to the weather, so only the initial infiltration data are included to compare to the adjacent Site 2 data. 2.3. Plot Setup Three treatments were included: deep tillage (DT), core aeration (A), and a control (C), which received no treat- ment. There were 5 replications for each of the three treatments. Each plot was wetted with a hose for 1 min and allowed to dry 1 min prior to DT or A. This proce- dure was repeated twice in order to moisten the surface soil, which was very dry and difficult for the tiller and aerator to penetrate. The DT treatment was performed using a rear-tine Figure 1. Site 1 immediately after installation. Plastic sheet- ing over runoff containers kept out rain. tiller (Troy-Bilt, Cleveland, OH, USA) to till the soil to a 25 - 30 cm depth. Due to the heavy compaction at Site 1, a backhoe was used to loosen the soil initially in order to allow the tiller to penetrate. The tiller was run across the plots in two directions until the desired depth was achieved. The A plots were plugged using a walk-behind hollow tine aerator (Ryan, Johnson Creek, WI, USA). Each of the A plots received ten passes until the plots were thoroughly treated. We observed very shallow pene- tration due to the compaction. The plugs were left in place with no further treatment. The C plots received no treatments after compaction, but were watered in the same manner to insure that all plots were installed under similar moisture conditions. At site 3 two treatments were included: DT and deep tillage with a compost amendment (CT). There were 3 replications of each treatment randomly assigned to plots. Tillage was to approximately 25 cm depth using the same equipment as the previous sites. As for Site 2, no back- hoe was used to break up the soil on this site because the soil moisture condition allowed the surface to be broken up using only the tiller. The compost was a mushroom blend (Old Castle Lawn & Garden Inc, Atlanta, GA), applied at a recommended 0.02 m3 1000 m−2 [19] and tilled in to the full depth of 25 cm. Each plot received the fertilizer, lime, and seed mixes recommended by the North Carolina Department of Transportation for their construction sites [20]. Fertilizer (10-20-20) was applied at a rate of 560 kg·ha−1 and pul- verized dolomitic limestone at a rate of 3364 kg·ha−1. Fertilizer and lime were both applied after the DT and A treatments. They were raked into the DT plots on Sites 1 and 2 but were surface applied to the C and A plots to avoid disturbance. The fertilizer and lime were tilled in at Site 3. A grass seed mix of tall fescue, centipede, and Bermuda grass (hulled) was applied at 56, 11, and 28 kg·ha−1, respectively, for Site 1 on April 27, 2009. Sites 2 Copyright © 2013 SciRes. OJSS 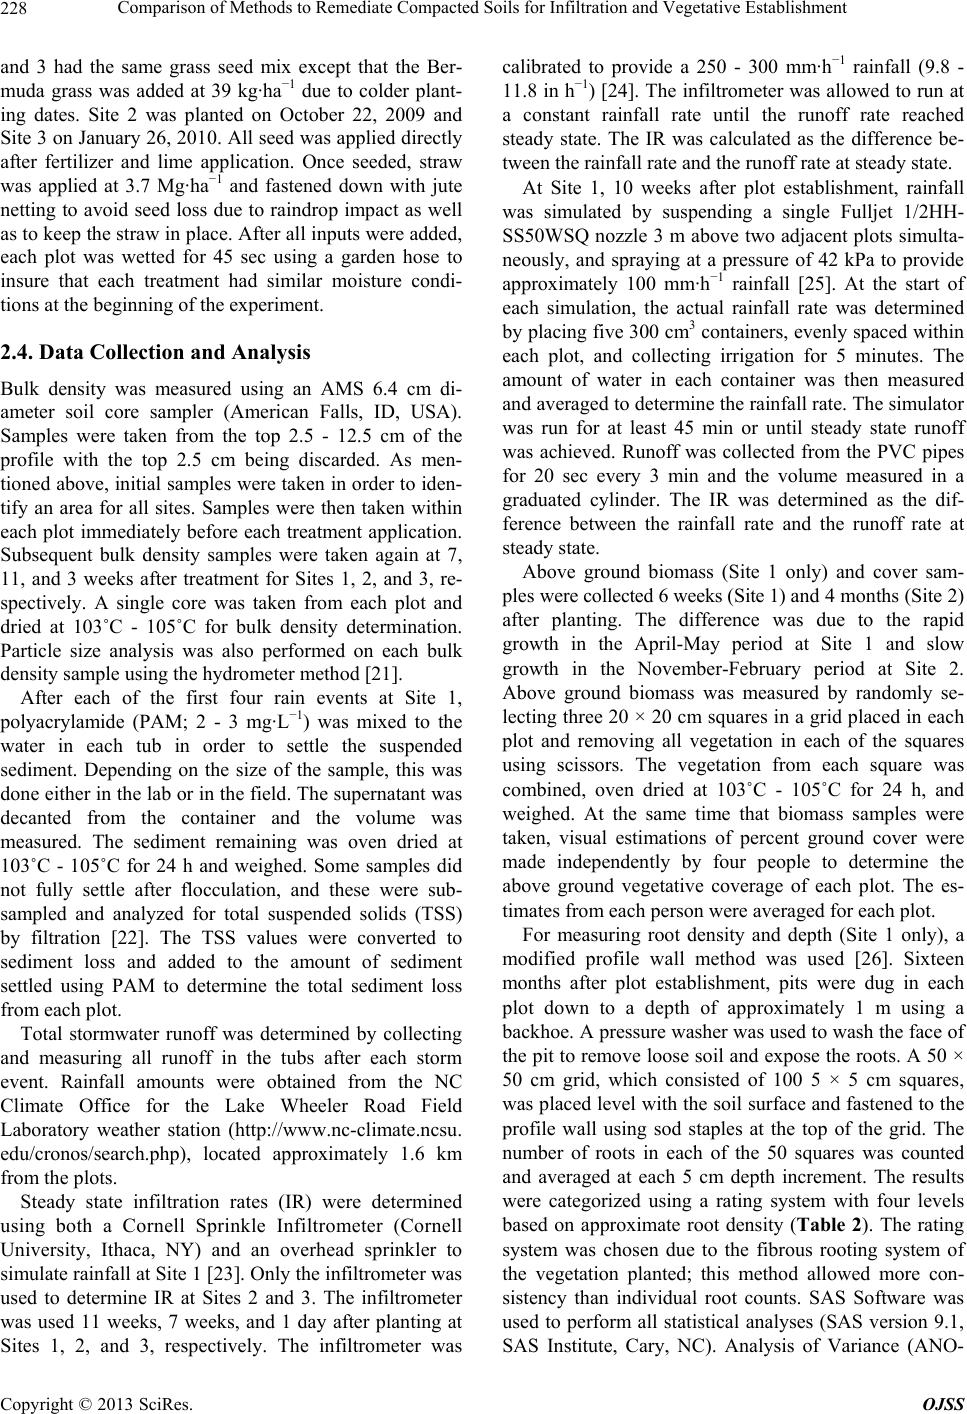 Comparison of Methods to Remediate Compacted Soils for Infiltration and Vegetative Establishment 228 and 3 had the same grass seed mix except that the Ber- muda grass was added at 39 kg·ha−1 due to colder plant- ing dates. Site 2 was planted on October 22, 2009 and Site 3 on January 26, 2010. All seed was applied directly after fertilizer and lime application. Once seeded, straw was applied at 3.7 Mg·ha−1 and fastened down with jute netting to avoid seed loss due to raindrop impact as well as to keep the straw in place. After all inputs were added, each plot was wetted for 45 sec using a garden hose to insure that each treatment had similar moisture condi- tions at the beginning of the experiment. 2.4. Data Collection and Analysis Bulk density was measured using an AMS 6.4 cm di- ameter soil core sampler (American Falls, ID, USA). Samples were taken from the top 2.5 - 12.5 cm of the profile with the top 2.5 cm being discarded. As men- tioned above, initial samples were taken in order to iden- tify an area for all sites. Samples were then taken within each plot immediately before each treatment application. Subsequent bulk density samples were taken again at 7, 11, and 3 weeks after treatment for Sites 1, 2, and 3, re- spectively. A single core was taken from each plot and dried at 103˚C - 105˚C for bulk density determination. Particle size analysis was also performed on each bulk density sample using the hydrometer method [21]. After each of the first four rain events at Site 1, polyacrylamide (PAM; 2 - 3 mg·L−1) was mixed to the water in each tub in order to settle the suspended sediment. Depending on the size of the sample, this was done either in the lab or in the field. The supernatant was decanted from the container and the volume was measured. The sediment remaining was oven dried at 103˚C - 105˚C for 24 h and weighed. Some samples did not fully settle after flocculation, and these were sub- sampled and analyzed for total suspended solids (TSS) by filtration [22]. The TSS values were converted to sediment loss and added to the amount of sediment settled using PAM to determine the total sediment loss from each plot. Total stormwater runoff was determined by collecting and measuring all runoff in the tubs after each storm event. Rainfall amounts were obtained from the NC Climate Office for the Lake Wheeler Road Field Laboratory weather station (http://www.nc-climate.ncsu. edu/cronos/search.php), located approximately 1.6 km from the plots. Steady state infiltration rates (IR) were determined using both a Cornell Sprinkle Infiltrometer (Cornell University, Ithaca, NY) and an overhead sprinkler to simulate rainfall at Site 1 [23]. Only the infiltrometer was used to determine IR at Sites 2 and 3. The infiltrometer was used 11 weeks, 7 weeks, and 1 day after planting at Sites 1, 2, and 3, respectively. The infiltrometer was calibrated to provide a 250 - 300 mm·h−1 rainfall (9.8 - 11.8 in h−1) [24]. The infiltrometer was allowed to run at a constant rainfall rate until the runoff rate reached steady state. The IR was calculated as the difference be- tween the rainfall rate and the runoff rate at steady state. At Site 1, 10 weeks after plot establishment, rainfall was simulated by suspending a single Fulljet 1/2HH- SS50WSQ nozzle 3 m above two adjacent plots simulta- neously, and spraying at a pressure of 42 kPa to provide approximately 100 mm·h−1 rainfall [25]. At the start of each simulation, the actual rainfall rate was determined by placing five 300 cm3 containers, evenly spaced within each plot, and collecting irrigation for 5 minutes. The amount of water in each container was then measured and averaged to determine the rainfall rate. The simulator was run for at least 45 min or until steady state runoff was achieved. Runoff was collected from the PVC pipes for 20 sec every 3 min and the volume measured in a graduated cylinder. The IR was determined as the dif- ference between the rainfall rate and the runoff rate at steady state. Above ground biomass (Site 1 only) and cover sam- ples were collected 6 weeks (Site 1) and 4 months (Site 2) after planting. The difference was due to the rapid growth in the April-May period at Site 1 and slow growth in the November-February period at Site 2. Above ground biomass was measured by randomly se- lecting three 20 × 20 cm squares in a grid placed in each plot and removing all vegetation in each of the squares using scissors. The vegetation from each square was combined, oven dried at 103˚C - 105˚C for 24 h, and weighed. At the same time that biomass samples were taken, visual estimations of percent ground cover were made independently by four people to determine the above ground vegetative coverage of each plot. The es- timates from each person were averaged for each plot. For measuring root density and depth (Site 1 only), a modified profile wall method was used [26]. Sixteen months after plot establishment, pits were dug in each plot down to a depth of approximately 1 m using a backhoe. A pressure washer was used to wash the face of the pit to remove loose soil and expose the roots. A 50 × 50 cm grid, which consisted of 100 5 × 5 cm squares, was placed level with the soil surface and fastened to the profile wall using sod staples at the top of the grid. The number of roots in each of the 50 squares was counted and averaged at each 5 cm depth increment. The results were categorized using a rating system with four levels based on approximate root density (Table 2). The rating system was chosen due to the fibrous rooting system of the vegetation planted; this method allowed more con- sistency than individual root counts. SAS Software was used to perform all statistical analyses (SAS version 9.1, SAS Institute, Cary, NC). Analysis of Variance (ANO- Copyright © 2013 SciRes. OJSS  Comparison of Methods to Remediate Compacted Soils for Infiltration and Vegetative Establishment 229 Table 2. Root density rating system for modified profile wall method of analyzing roots. Number of roots per grid square Rating 0 0 1 - 10 1 11 - 30 2 31+ 3 VA) was performed on all data to analyze main effects and Tukey’s Least Significant Difference (LSD) was used to separate treatments. Error rates were controlled at α = 0.05. 3. Results 3.1. Bulk Density At Site 1, the depths of 5 plugs in each plot were meas- ured and averaged only 1.5 - 2 cm, matching our obser- vation of poor penetration. This is important to note in considering our results. Furthermore, it suggests that much heavier equipment may be necessary to attempt core aeration on highly compacted soils. The average bulk density in the compacted area was 1.6 g·cm−3 and there were no significant differences in bulk density among plots (Table 3; p = 0.48). The bulk density taken at 7 weeks after treatment was unchanged in the C and A plots but was significantly reduced in the DT treatment. At Site 2, bulk densities were similar to Site 1 and there were no differences in bulk densities prior to treatment. After 11 weeks, the DT plots had a significantly lower average bulk density, with the averages decreasing from 1.6 to 1.4 g·cm−3 (p = 0.001), just as at Site 1. The C and A treatments showed no differences in bulk density from their pre-treatment values. The average pre-treatment bulk densities of Site 3 were similar for the CT plots and the DT plots. Five weeks after tillage, the bulk densities of both treatments were lower than their pretreatment values, but these differences were not statistically sig- nificant due to variability. The CT plots were also not significantly different from the DT plots after five weeks, indicating that the compost did not affect bulk density more than tillage alone. The decreased bulk densities of the DT plots in all three sites are consistent with other studies comparing different levels of tillage, with con- ventional or deep tillage resulting in the lowest values [27,28]. 3.2. Infiltration At Site 1, the overhead sprinkler method produced simi- lar rates of simulated rainfall in each treatment with no significant differences (p = 0.69). In these tests, the av- erage IR for the C and A treatments were similar and significantly lower that of the DT treatment (Table 4). Table 3. Average pre- and post-treatment bulk density at each site. Means of pre- and post-treatment measurements at each site followed by the same letter are not significantly different (p = 0.05). Bulk Density (g·cm−3) Site 1 Site 2 Site 3 Treatment Pre Post Pre Post Pre Post Control 1.6a 1.6a 1.6a 1.6a na na Aerated 1.6a 1.6a 1.7a 1.7a na na Tilled 1.6a1.4b 1.6a 1.4b 1.6a 1.3a Compost + Tilled na na na na 1.5a1.3a Table 4. Infiltration rates (IR) measured using two simula- tion methods at Site 1. Means followed by the same letter within a column are not significantly different (p = 0.05). Overhead sprinkler Infiltrometer TreatmentRainfall RateIR Rainfall Rate IR (cm·h−1) Control9.75a 2.70a 24.0a 0.16a Aerated10.62a 2.22a 23.0a 0.21a Tilled 10.57a 5.67b 28.2a 14.8b The DT IR was very similar to highest rates found else- where on home lawns for 65 - 70 year old lawns under simulated rainfall and double-ring infiltrometer tests [10, 29]. The infiltrometer method produced rainfall rates more than 2X that of the sprinkler, which may have in- fluenced differences among treatments. Similar to the sprinkler method, there were no differences in IR be- tween the C and A plots, averaging 0.16 and 0.21 cm·hr−1, respectively. Infiltration was nearly two orders of mag- nitude higher in the DT plots (14.4 cm·hr−1; p = 0.002). The average IR for the infiltrometer was much lower for C and A treatments and higher for the DT treatment compared to the overhead sprinkler method (Table 4). Raindrop impact is more intense under the overhead sprinkler method, where the simulated rainfall is falling from 3 m, compared to the infiltrometer method, with only a 5 cm drop. The higher impact can dislodge soil particles and cause them to re-deposit to form surface crusts, and the looser DT soil would have been more susceptible. These surface seals can substantially lower IR because of their low hydraulic conductivities [30-32]. Also, the overhead sprinkler testing was conducted six weeks after planting and the infiltrometer testing two weeks later, so vegetative cover may have slightly im- proved. This does not, however, explain the lower values observed for the C and A treatments when comparing infiltrometer measurements to the values obtained with the overhead sprinkler. In general, because of differences in the two methods, comparison between them should probably be limited. Instead, each should be viewed Copyright © 2013 SciRes. OJSS  Comparison of Methods to Remediate Compacted Soils for Infiltration and Vegetative Establishment 230 separately as a comparison between treatments, both in- dicating similar trends. For the four natural events, with much lower peak intensities of 3.6 - 29 mm·h−1, the infil- tration rate as a fraction of input was as high as 98% for the DT compared to 68% and 84% for the A and C treatments, respectively. Overall, the DT treatment resulted in the lowest bulk densities and the highest IR using both infiltration meth- ods. The A treatment did not result in any measureable change in bulk density or IR relative to the control. For this particular site, soils with bulk densities above ap- proximately 1.4 g·cm−3 had greatly reduced IR using the infiltrometer method (Figure 2). Texture varied substan- tially from the first to the last plot, ranging from clay loam to sandy loam, but there were no correlations be- tween any of the measured variables and sand or clay content (data not shown). At Site 2, IR was measured by infiltrometer approxi- mately seven weeks after plot establishment as we waited for the vegetation to become established during a cold, wet period. There were no significant differences in IR for any of the treatments at this site (p = 0.56, Table 5). Infiltration was too low to be read by the infiltrometer on 10 of the 15 plots. Compared to Site 1, IR was lower for the C and A treatments and much lower (25X) for the DT treatment. Within the site, the maximum observed IR in the DT plots was more than 3X the C and A plots, but the variability was too great to detect any significant differ- ence in the means, probably due to the very low infiltra- tion rates. The lower IR at Site 2 relative to Site 1 may have been the result of poor vegetative establishment and poor root growth (see below), which might have allowed the soil to settle more than at Site 1. The sparse vegeta- tion also left the soil more exposed than at Site 1, making it more susceptible to raindrop impact and surface crust- ing. Site 2 received precipitation 6 out of 10 days after treatment, with the largest being a 12.7 mm storm with a peak intensity of 5 mm·h−1, on the 10th day. The site had very little slope for erosion to occur, but these rain events could have caused impermeable surface layers that may Figure 2. Re lationship betw een infiltration and bulk density at Site 1. have inhibited germination and root penetration. Site 2 IR measurements were taken seven weeks (early De- cember) after installation to allow the vegetation to be- come established, but unusually cold temperatures during the period prevented significant plant growth. During this period, there were a total of 23 storms with 210 mm of precipitation, and with the plots essentially bare consid- erable raindrop impact and crusting could have occurred. Texture ranged from clay loam to clay across the plots at Site 2. As expected, there were no significant relation- ships between IR and either bulk density or clay content due to the majority of the plots having no measureable infiltration. Site 3 was installed adjacent to Site 2, primarily to de- termine the IR immediately after tillage instead of wait- ing for vegetation to become established, but also to in- vestigate the effect of compost addition on initial IR. There were no differences in IR detected between DT and CT (p = 0.52, Table 5). The numerical increase in IR with compost could be attributed to higher surface roughness generated by the incorporation of compost, which delays runoff [33]. The irrigation rate on Site 3 was adjusted to more than 2X that used at Site 2, due to the longer time it was taking for runoff to occur since IRs were substantially higher. The main difference between the two sites was that IR measurement was right after tillage on Site 3, while measurements on Site 2 were taken seven weeks after treatment to allow vegetation establishment. Presumably Site 2 had similar, high infil- tration rates right after tillage but it was greatly reduced in just seven weeks of frequent rainfall and little vegeta- tive growth. Heavy and intense rainfall immediately after establishment of Site 2 may have led to surface sealing and crusting as well. 3.3. Vegetative Establishment The vegetative cover of the C, A, and DT treatments were 65, 62, and 85%, respectively, after six weeks of growth at Site 1 (Figure 3, Table 6). There were no sig- Table 5. Infiltration rates (IR) measured by the Cornell Sprinkle Infiltrometer method at Sites 2 and 3. Means fol- lowed by the same letter within a column and site are not significantly different (p = 0.05) Site 2 Site 3 Treatment Rainfall Rate IR Rainfall RateIR (cm·h−1) Control 28.3a 0.10b na na Aerated 23.9a 0.18b na na Tilled 21.9a 0.60b 57.5a 6.4b Compost + Tilledna na 58.5b 10.1b Copyright © 2013 SciRes. OJSS  Comparison of Methods to Remediate Compacted Soils for Infiltration and Vegetative Establishment 231 nificant differences (p = 0.06), although DT was much higher numerically than the other treatments. A similar trend was found for biomass, but in this case the differ- ences were significant. Both cover estimates and above ground biomass were also correlated with bulk density at Site 1 (data not shown). Balbuena et al. also found sig- nificant (58%) reduction in grass production when bulk density was increased after 10 passes with a tractor [2]. Cover was the only vegetative measurement taken on Site 2. More than three months after establishment, there were no differences in cover estimates between the treatments; the mean value across treatments was much lower than at Site 1 (Table 6). This is likely due to the time of year (November - February) and surface crusting at Site 2. There was no correlation between vegetative cover and clay content for either site (data not shown), suggesting that texture was not the driving variable con- trolling vegetative growth. Even with limitations observed at Site 2, our data sug- gest that IR and vegetative establishment are improved with the higher porosity and lower bulk density achieved through deep tillage. Environmental conditions were better for grass establishment when we installed Site 1 due to warm weather and relatively gentle rains, which may have been at least partly responsible for maintaining the reduced bulk density and higher IR, compared to Site 2. There were no differences in rooting density among Figure 3. Example of vegetation growth in compacted (left) and deep-tilled (right) plots at Site 1. Table 6. Vegetation establishment at Sites 1 and 2. Numbers followed by the same letter within a column are not signifi- cantly different (p = 0.05). Site 1 Site 2 Treatment Cover (%) Biomass (kg·ha−1) Cover (%) Control 65a 32.1a 22a Aerated 62a 31.3a 16a Tillage 85a 88.7b 23a the three treatments for the upper 15 cm of the soil pro- file on Site 1 (Table 7). The rooting systems of the C and A treatments were very dense and had numerous short roots; whereas, the DT treatments had longer roots that extended deeper through the profile. Below 15 cm, the DT plots had higher average root densities than the C and A, and this persisted down to the 50 cm depth. Aeration did not improve root densities at depth, which is not sur- prising since the penetration was <2 cm. Tillage tools, including chisel, moldboard, and paraplow systems, all have been demonstrated to reduce soil bulk density and penetration resistance to the depth of tillage when com- pared to a no-till system [34]. 3.4. Stormwater Runoff The total amount of precipitation for storm 1, seven days after plot establishment, was 19.6 mm with a peak inten- sity of 3.6 mm·h−1 (Figure 4). The average runoff depths of the C, A, and DT plots were 1.0, 1.9, and 0.6 mm, respectively. This indicates that on average, more than 90% of precipitation infiltrated on all three treatments. There were no significant differences in the amount of runoff for any of the treatments. The second storm oc- curred 13 days after the first storm and was much more intense, with a total precipitation of 43.7 mm and a peak intensity of 29 mm·h−1. The average amounts of runoff were 7.5, 26.2, and 0 mm, which equates to 17.2, 60.5, and 0% of the total rainfall for the C, A, and DT plots, respectively. The A treatment produced significantly more runoff than the C and DT treatments (p = < 0.0001), suggesting that the treatment may have actually com- pacted the soils further. There were no differences be- tween the C and DT treatments. The total precipitation for storm 3, occurring 12 days after the second storm, was 11.68 mm with a peak intensity of 11.2 mm·h−1. The Table 7. Root density ratings for each treatment at Site 1. Numbers followed by different letters within each depth level are significantly different (p < 0.05). Average Rating Depth (cm)Control Aerated Tilled P-value 5 3.0a 3.0a 2.8a 0.41 10 2.6a 2.8a 2.8a 0.75 15 2.1a 2.1a 2.6a 0.16 20 1.4a 1.3a 2.6b 0.0002 25 0.9a 0.7a 2.4b <0.0001 30 0.4a 0.4a 1.7b 0.001 35 0.4a 0.4a 1.1b 0.008 40 0.2a 0.3a 0.7b 0.02 45 0.2a 0.3a 0.7b 0.02 50 0.2a 0.2a 0.6b 0.02 Copyright © 2013 SciRes. OJSS  Comparison of Methods to Remediate Compacted Soils for Infiltration and Vegetative Establishment 232 Figure 4. Runoff from Site 1 plots during the first four rain events after establishment. average runoff depths for the C, A, and DT plots were 2.5, 2.1, and 0.2 mm, respectively. As for Storm 1, the runoff rates were very low due to the low intensity (3.6 mm·h−1 peak) and, on average, approximately 80% of the total precipitation on all treatments infiltrated. There were no significant differences between treatments for this storm event. Storm 4 occurred seven days after Storm 3, with a total of 33.3 mm of precipitation and a peak intensity of 13.5 mm·h−1. The average runoff depths for the C, A, and DT treatments were 7.8, 6.0, and 1.1 mm, which equate to 23.7, 18.3, and 3.5% of the total rainfall, respectively, but the differences were not sig- nificant. For the four natural rainfall events monitored in the 39 days after plot establishment, the A treatment produced the highest total runoff in 2 of 4 storm events when compared to the DT treatments. The total runoff for all four storms was significantly greater in the A treatment compared to DT. Even though bulk density was un- changed in the A treatment there could have been some further compaction at the surface caused by the aerator, which increased stormwater runoff volumes. There were no differences in runoff for any storm event between the C and DT plots due to variability, although the DT plots were numerically lower for every storm. Runoff volume in the C and A treatments was the greatest when the peak intensity was the highest (storm 2) and lowest for low peak intensity rainfalls (storm 1). The DT treatment pro- duced the lowest amounts of runoff and peak intensity did not appear to have any effect on runoff responses in these four storms. Compared to the C and DT plots, sediment losses were significantly greater for the aerated plots during the in- tense second storm event (Figure 5). The total sediment loss from the A treatment was 5-10X that of the others, due to the combination of high runoff rates with the slightly loosened soil from the hollow tines. In our tests on highly compacted soils, the aeration treatment ap- peared to have no beneficial effects and it increased soil Figure 5. Sediment loss from Site 1 plots during the first four rain events after establishment. losses compared to no treatment of the compacted soil. However, the aeration equipment we used could only penetrate the compacted soil 1 - 2 cm and we did not attempt to remove or break up the cores as is commonly practiced on grassed areas, so our results may not be representative. 4. Conclusion Soil compaction clearly has negative impacts on storm- water runoff, infiltration, and vegetative establishment. This study suggests that the combination of tillage and rapid vegetation establishment can greatly reduce runoff from treated areas. However, the importance of vigorous vegetation appears to be critical to the success of deep tillage over time, as demonstrated by the failure of our second site in maintaining high IR due to very poor grass growth during a cold, wet period in the winter. The grass established under more ideal conditions responded to deep tillage with significantly more roots below 15 cm, suggesting this as an important factor in maintaining in- filtration rates. While we only measured the effects dur- ing the first growing season, the relatively high infiltra- tion rate of almost 15 cm·h−1 shows promise in reducing post-construction stormwater runoff from vegetated ar- eas. REFERENCES [1] J. H. Gregory, M. D. Dukes, P. H. Jones and G. I. Miller, “Effect of Urban Soil Compaction on Infiltration Rate,” Journal of Soil and Water Conservation, Vol. 61, No. 3, 2006, pp. 117-124. [2] R. Balbuena, P. MacDonagh, J. Marquina, D. Jorajuria, A. Terminiello and J. Claverie, “Wheel Traffic Influence on Poplar Generation and Grass Yield,” Biosystems Engi- neering, 81, No. 4, 2002, 379-384. doi:10.1006/bioe.2001.0028 [3] T. Batey and D. C. McKenzie, “Soil Compaction: Identi- Copyright © 2013 SciRes. OJSS  Comparison of Methods to Remediate Compacted Soils for Infiltration and Vegetative Establishment 233 fication Directly in the Field,” Soil Use and Management, Vol. 22, No. 2, 2006, pp. 123-131. doi:10.1111/j.1475-2743.2006.00017.x [4] T. Randrup and K. Dralle, “Influence of Planning and Design on Soil Compaction in Construction Sites,” Land- scape and Urban Planning, Vol. 38, No. 1-2, 1997, pp. 87-92. doi:10.1016/S0169-2046(97)00024-8 [5] R. Pitt, J. Lantrip and C. Henry, “Infiltration through Disturbed Urban Soils and Compost-Amended Soil Ef- fects on Runoff Quality and Quantity,” US Environmen- tal Protection Agency, Edison, 1999. http://unix.eng.ua.edu/~rpitt/Publications/Publications.sht ml [6] M. A. Fullen, “Compaction, Hydrological Soil Processes and Soil Erosion on Loamy Sands in East Shropshire, England,” Soil & Tillage Research, Vol. 6, No. 1, 1985, pp. 17-29. doi:10.1016/0167-1987(85)90003-0 [7] G. Spoor, “Alleviation of Soil Compaction: Requirements, Equipment, and Techniques,” Soil Use and Management, Vol. 22, No. 2, 2006, pp. 113-122. doi:10.1111/j.1475-2743.2006.00015.x [8] E. C. Varsa, S. K. Chong, J. O. Abolaji, D. A. Farquhar and F. J. Olsen, “Effect of Deep Tillage on Soil Physical Characteristics and Corn (Zea mays L.) Root Growth and Production,” Soil Tillage Research, Vol. 43, No. 3-4, 1997, pp. 219-228. doi:10.1016/S0167-1987(97)00041-X [9] W. J. Busscher, J. R. Frederick and P. J. Bauer, “Timing Effects of Deep Tillage on Penetration Resistance and Wheat and Soybean Yield,” Soil Science Society of America Journal, Vol. 64, No. 3, 2000, pp. 999-1003. doi:10.2136/sssaj2000.643999x [10] A. D. Legg, R. T. Bannerman and J. Panuska, “Variation in the Relation of Rainfall to Runoff from Residential Lawns in Madison, Wisconsin, July and August 1995,” US Geological Survey Water Resources Inventory Report 96-4194, 1999. [11] P. J. Rice and B. P. Horgan, “Nutrient Loss with Runoff from Fairway Turf: An Evaluation of Core Cultivation Practices and Their Environmental Impact,” Environ- mental Toxicology and Chemistry, Vol. 30, No. 11, 2011, pp. 2473-2480. doi:10.1002/etc.659 [12] C. M. Baldwin, H. Liu, and P. J. Brown, “Effects of Core Cultivation Tine Entry Angle on Golf Putting Greens,” HortTechnology, Vol. 16, No. 2, 2006, pp. 265-269. [13] S. Mitra, E. Vis, R. Kumar, R. Plumb and M. Fam, “Wet- ting Agent and Cultural Practices Increase Infiltration and Decrease Runoff Losses of Irrigation Water,” Biologia, Vol. 61, Suppl. 19, 2006, pp. S353-357. doi:10.2478/s11756-006-0188-4 [14] J. A. Murphy, P. E. Rieke and A. E. Eriskson, “Core Cul- tivation of a Putting Green with Hollow and Solid Tines,” Agronomy Journal, Vol. 85, No. 1, 1993, pp. 1-9. doi:10.2134/agronj1993.00021962008500010001x [15] S. E. Brauen, W. J. Johnston and R. L. Goss, “Long-Term Aerification,” USGA Green Section Record, 1998, pp. 13-15. [16] D. H. Franklin, M. L. Cabrera, L. T. West, V. H. Calvert and J. A. Rema, “Aerating Grasslands: Effects on Runoff and Phosphorus Losses from Applied Broiler Litter,” Journal of Environmental Quality, Vol. 36, No. 1, 2007, pp. 208-215. doi:10.2134/jeq2006.0012 [17] S. B. Shah, J. L. Miller and T. J. Basden, “Mechanical Aeration and Liquid Dairy Manure Impacts on Grassland Runoff, Water Quality, and Yield,” Transactions Ameri- can Society of Agricultural Engineers, Vol. 47, No. 3, 2004, pp. 777-788. [18] USDA, Web Soil Survey, 2013. http://websoilsurvey.nrcs.usda.gov/app/ [19] A. H. Bruneau, G. L. Miller and C. H. Peacock, “Carolina Lawns,” North Carolina Cooperative Extension Service Bulletin AG-69, 2013. http://www.turffiles.ncsu.edu/PDFFiles/004175/Carolina_ Lawns.pdf [20] NC DOT, “Roadside Environmental Unit Special Provi- sions, Seeding and Mulching East,” 2013. http://www.ncdot.gov/DOH/operations/dp_chief_eng/roa dside/soil_water/pdf/SeedMixEast.pdf [21] G. W. Gee and J. W. Bauder, “Monograph #9: Particle- Size Analysis,” In: A. Klute, Ed., Methods of Soil Analy- sis, Part 1, 2nd Edition, American Society of Agronomy, Madison, pp. 383-411. [22] L. S. Clesceri, A.E. Greenberg and A.D. Eaton, “Standard Methods for the Examination of Water and Wastewater,” American Public Health Association, Washington DC, 1989. [23] C. B. Ogden, H. M. Van Es and R. R. Schindelbeck, “Miniature Rain Simulator for Field Measurement of Soil Infiltration,” Soil Science Society of America Journal, Vol. 61, No. 4, 1997, pp.1041-1043. doi:10.2136/sssaj1997.03615995006100040008x [24] H. M. van Es and R.R. Schindelbeck, “Field Procedures and Data Analysis for the Cornell Sprinkle Infiltrometer,” Department of Crop and Soil Sciences Research Series R03-01, Cornell University, Ithaca, 2003. http://www.hort.cornell.edu/soilhealth/research/infiltrome ter/infil_manual.pdf [25] C. A. Volf, G. R. Ontkean, D. R. Bennett, D. S. Chanasyk and J. J. Miller, “Phosphorus Losses in Simulated Rain- fall Runoff from Manured Soils of Alberta,” Journal of Environmental Quality, Vol. 36, No. 3, 2007, pp. 730-741. doi:10.2134/jeq2006.0269 [26] W. Bohm, “Methods of Studying Root Systems,” Springer- Verlag, Berlin, 1979. doi:10.1007/978-3-642-67282-8 [27] S. A. Materechera, “Tillage and Tractor Traffic Effects on Soil Compaction in Horticultural Fields Used for Peri- Urban Agriculture in a Semi-Arid Environment of the North West Province, South Africa,” Soil & Tillage Re- search, Vol. 103, No. 1, 2009, pp. 11-15. [28] O. F. Taser and F. Metinoglu, “Physical and Mechanical Properties of a Clayey Soil as Affected by Tillage Sys- tems for Wheat Growth,” Acta Agriculturae Scandinavica, Section B—Soil & Plant Science, Vol. 55, No. 3, 2005, pp. 186-191. doi:10.1080/09064710510008702 [29] G. W. Hamilton and D. V. Waddington, “Infiltration Rates on Residential Lawns in Central Pennsylvania,” Journal Copyright © 2013 SciRes. OJSS  Comparison of Methods to Remediate Compacted Soils for Infiltration and Vegetative Establishment Copyright © 2013 SciRes. OJSS 234 of Soil and Water Conservation, Vol. 54, No. 3, 1999, pp. 564-568. [30] R. C. Freese, D. K. Cassel and H. P. Denton, “Infiltration in a Piedmont Soil under Three Tillage Systems,” Journal of Soil and Water Conservation, Vol. 48, No. 3, 1993, pp. 214-219. [31] X. C. Zhang, W. P. Miller, M. A. Nearing and L. D. Nor- ton, “Effects of Surface Treatment on Surface Sealing, Runoff, and Interrill Erosion,” Transactions of American Society of Agricultural Engineering, Vol. 41, No. 4, 1998, pp. 989-994. [32] A. K. Bhardwaj, R. A. McLaughlin and G. J. Levy, “De- positional Seals in Polyacrylamide-Amended Soils of Varying Clay Mineralogy and Texture,” Journal of Soils and Sediment Science, Vol. 10, No. 3, 2010, pp. 494-504. doi:10.1007/s11368-010-0198-2 [33] G. Govers, D. A. Lobb and T. A. Quine, “Preface—Till- age Erosion and Translocation: Emergence of a New Paradigm in Soil Erosion Research,” Soil Tillage Re- search, Vol. 51, No. 3-4, 1999, pp. 167-174. [34] D. C. Erbach, R. M. Cruse, T. M. Crosbie, D. R. Tim- mons, T. C. Kaspar, K. N. Potter, “Maize Response to Tillage-Induced Soil Conditions,” Transactions of the American Society of Agricultural Engineers, Vol. 29, No. 3, 1992, pp. 690-695.
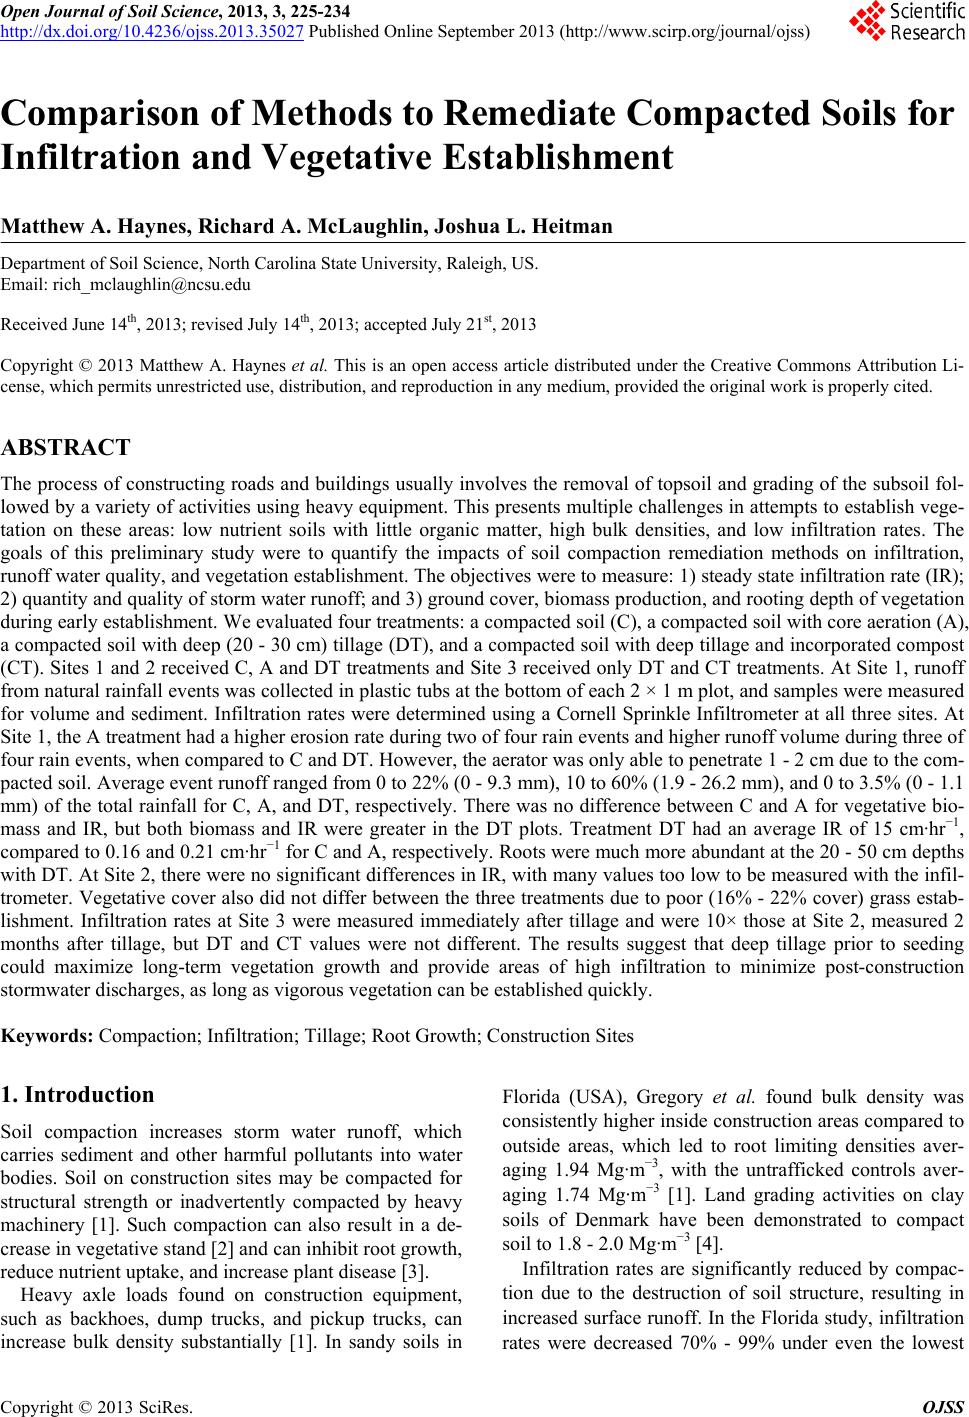
|