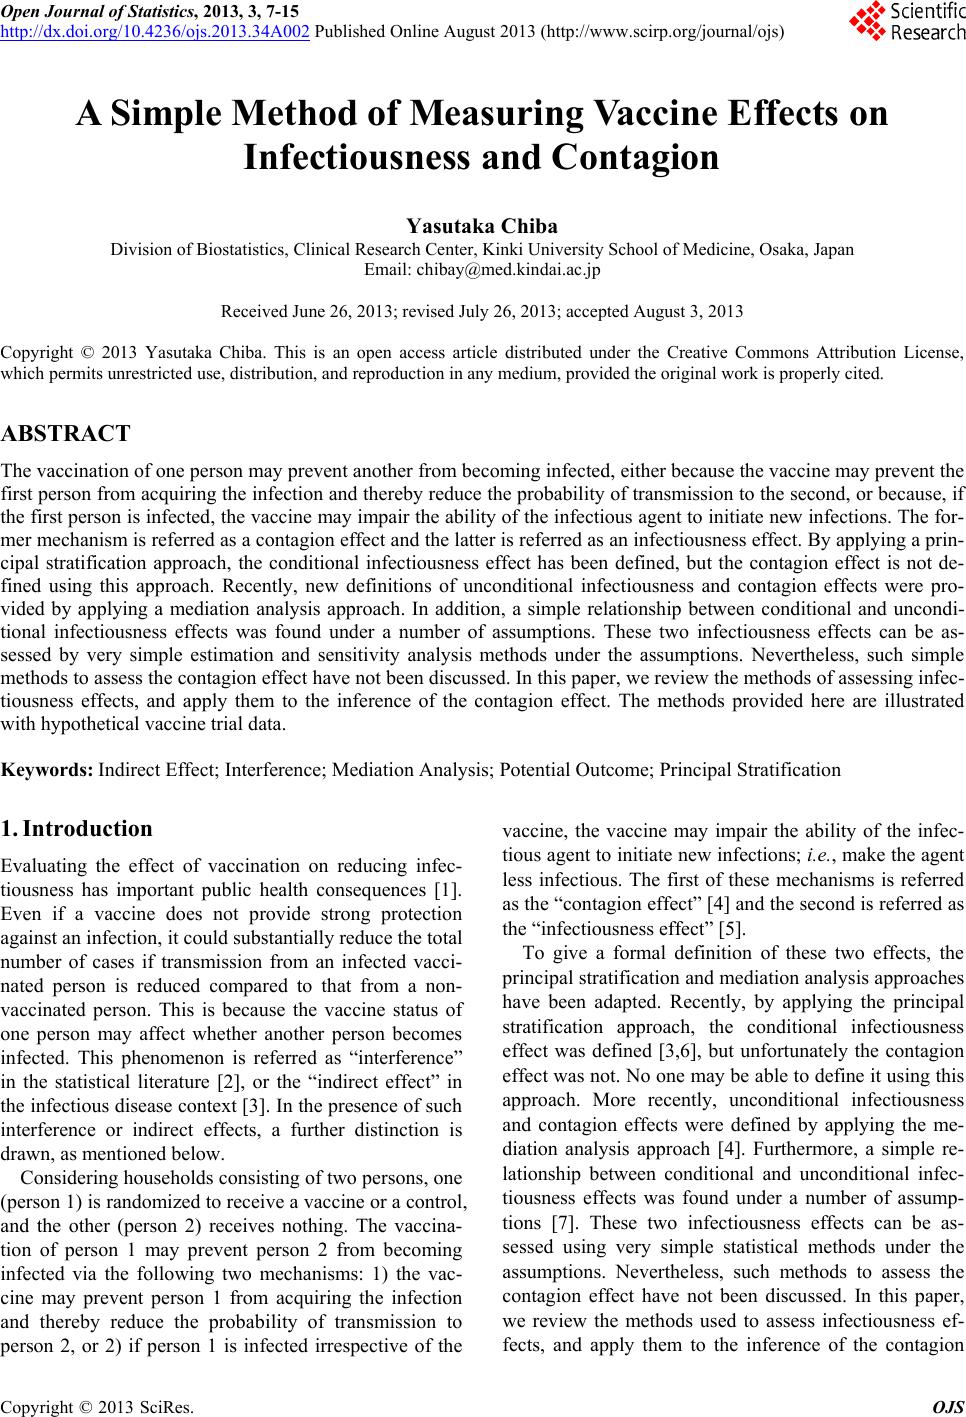
 Open Journal of Statistics, 2013, 3, 7-15 http://dx.doi.org/10.4236/ojs.2013.34A002 Published Online August 2013 (http://www.scirp.org/journal/ojs) A Simple Method of Measuring Vaccine Effects on Infectiousness and Contagion Yasutaka Chiba Division of Biostatistics, Clinical Research Center, Kinki University School of Medicine, Osaka, Japan Email: chibay@med.kindai.ac.jp Received June 26, 2013; revised July 26, 2013; accepted August 3, 2013 Copyright © 2013 Yasutaka Chiba. This is an open access article distributed under the Creative Commons Attribution License, which permits unrestricted use, distribution, and reproduction in any medium, provided the original work is properly cited. ABSTRACT The vaccination of one person may prevent another from becoming infected, either because the vaccine may prevent the first person from acquiring the infection and thereby reduce the probability of transmission to the second, or because, if the first person is infected, the vaccine may impair the ability of the infectious agent to initiate new infections. The for- mer mechanism is referred as a contagion effect and the latter is referred as an infectiousness effect. By applying a prin- cipal stratification approach, the conditional infectiousness effect has been defined, but the contagion effect is not de- fined using this approach. Recently, new definitions of unconditional infectiousness and contagion effects were pro- vided by applying a mediation analysis approach. In addition, a simple relationship between conditional and uncondi- tional infectiousness effects was found under a number of assumptions. These two infectiousness effects can be as- sessed by very simple estimation and sensitivity analysis methods under the assumptions. Nevertheless, such simple methods to assess the contagion effect have not been discussed. In this paper, we review the methods of assessing infec- tiousness effects, and apply them to the inference of the contagion effect. The methods provided here are illustrated with hypothetical vaccine trial data. Keywords: Indirect Effect; Interference; Mediation Analysis; Potential Outcome; Principal Stratification 1. Introduction Evaluating the effect of vaccination on reducing infec- tiousness has important public health consequences [1]. Even if a vaccine does not provide strong protection against an infection, it could substantially reduce the total number of cases if transmission from an infected vacci- nated person is reduced compared to that from a non- vaccinated person. This is because the vaccine status of one person may affect whether another person becomes infected. This phenomenon is referred as “interference” in the statistical literature [2], or the “indirect effect” in the infectious disease context [3]. In the presence of such interference or indirect effects, a further distinction is drawn, as mentioned below. Considering households consisting of two persons, one (person 1) is randomized to receive a vaccine or a control, and the other (person 2) receives nothing. The vaccina- tion of person 1 may prevent person 2 from becoming infected via the following two mechanisms: 1) the vac- cine may prevent person 1 from acquiring the infection and thereby reduce the probability of transmission to person 2, or 2) if person 1 is infected irrespective of the vaccine, the vaccine may impair the ability of the infec- tious agent to initiate new infections; i.e., make the agent less infectious. The first of these mechanisms is referred as the “contagion effect” [4] and the second is referred as the “infectiousness effect” [5]. To give a formal definition of these two effects, the principal stratification and mediation analysis approaches have been adapted. Recently, by applying the principal stratification approach, the conditional infectiousness effect was defined [3,6], but unfortunately the contagion effect was not. No one may be able to define it using this approach. More recently, unconditional infectiousness and contagion effects were defined by applying the me- diation analysis approach [4]. Furthermore, a simple re- lationship between conditional and unconditional infec- tiousness effects was found under a number of assump- tions [7]. These two infectiousness effects can be as- sessed using very simple statistical methods under the assumptions. Nevertheless, such methods to assess the contagion effect have not been discussed. In this paper, we review the methods used to assess infectiousness ef- fects, and apply them to the inference of the contagion C opyright © 2013 SciRes. OJS 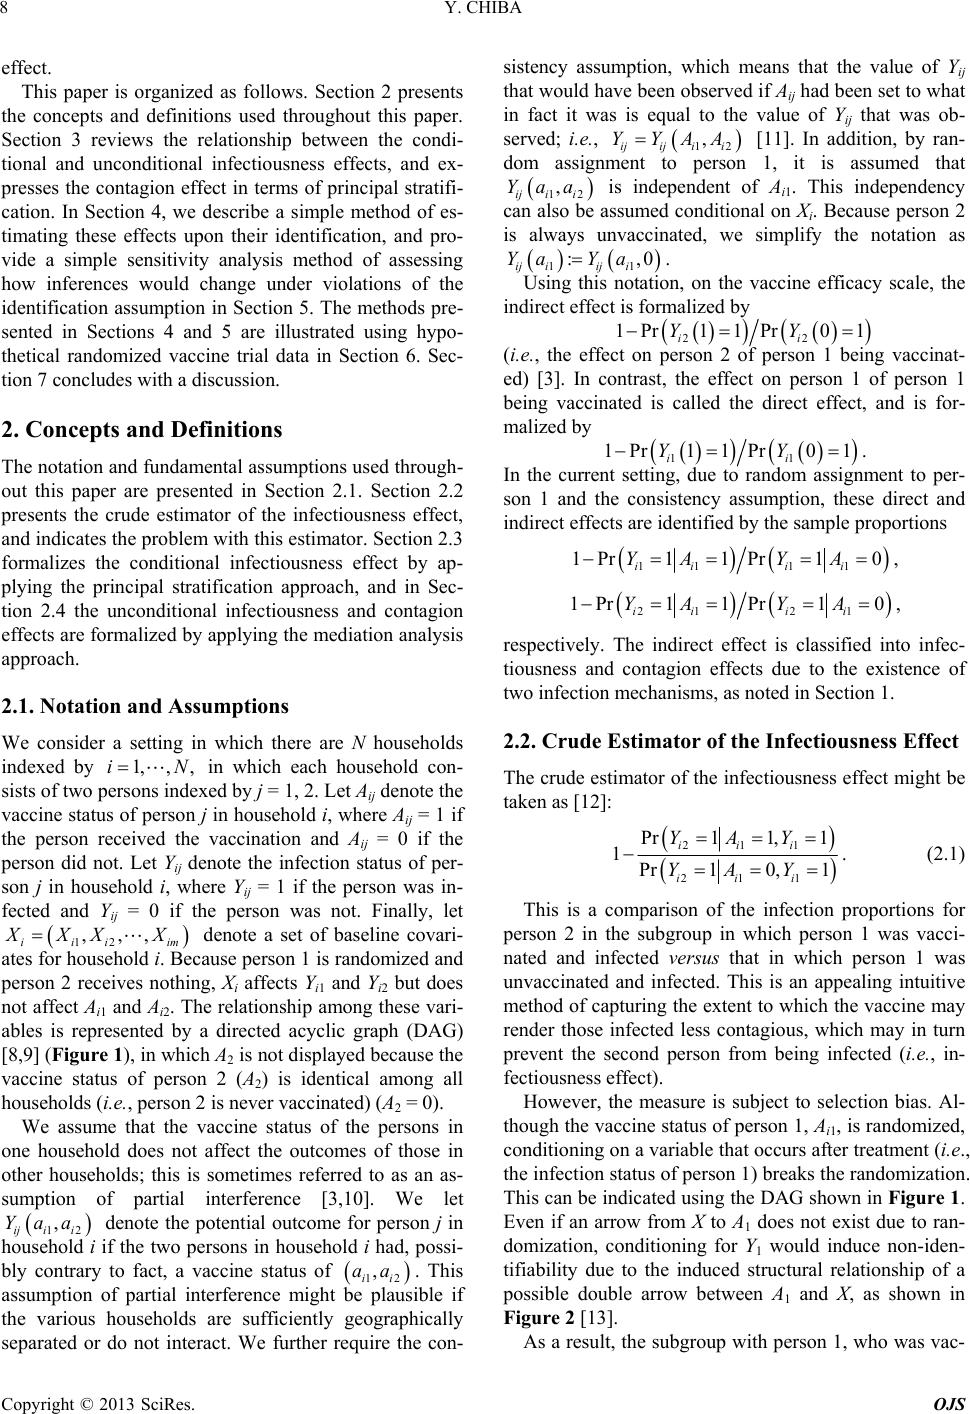 Y. CHIBA 8 effect. This paper is organized as follows. Section 2 presents the concepts and definitions used throughout this paper. Section 3 reviews the relationship between the condi- tional and unconditional infectiousness effects, and ex- presses the contagion effect in terms of principal stratifi- cation. In Section 4, we describe a simple method of es- timating these effects upon their identification, and pro- vide a simple sensitivity analysis method of assessing how inferences would change under violations of the identification assumption in Section 5. The methods pre- sented in Sections 4 and 5 are illustrated using hypo- thetical randomized vaccine trial data in Section 6. Sec- tion 7 concludes with a discussion. 2. Concepts and Definitions The notation and fundamental assumptions used through- out this paper are presented in Section 2.1. Section 2.2 presents the crude estimator of the infectiousness effect, and indicates the problem with this estimator. Section 2.3 formalizes the conditional infectiousness effect by ap- plying the principal stratification approach, and in Sec- tion 2.4 the unconditional infectiousness and contagion effects are formalized by applying the mediation analysis approach. 2.1. Notation and Assumptions We consider a setting in which there are N households indexed by in which each household con- sists of two persons indexed by j = 1, 2. Let Aij denote the vaccine status of person j in household i, where Aij = 1 if the person received the vaccination and Aij = 0 if the person did not. Let Yij denote the infection status of per- son j in household i, where Yij = 1 if the person was in- fected and Yij = 0 if the person was not. Finally, let iii im denote a set of baseline covari- ates for household i. Because person 1 is randomized and person 2 receives nothing, Xi affects Yi1 and Yi2 but does not affect Ai1 and Ai2. The relationship among these vari- ables is represented by a directed acyclic graph (DAG) [8,9] (Figure 1), in which A2 is not displayed because the vaccine status of person 2 (A2) is identical among all households (i.e., person 2 is never vaccinated) (A2 = 0). 1,, ,i 12 ,,,X X N XX We assume that the vaccine status of the persons in one household does not affect the outcomes of those in other households; this is sometimes referred to as an as- sumption of partial interference [3,10]. We let denote the potential outcome for person j in household i if the two persons in household i had, possi- bly contrary to fact, a vaccine status of . This assumption of partial interference might be plausible if the various households are sufficiently geographically separated or do not interact. We further require the con- sistency assumption, which means that the value of Yij that would have been observed if Aij had been set to what in fact it was is equal to the value of Yij that was ob- served; i.e., 12 , ij ii Yaa 12 , ii aa 12 , ijij ii YYAA [11]. In addition, by ran- dom assignment to person 1, it is assumed that 12 , ij ii Yaa is independent of A i1. This independency can also be assumed conditional on Xi. Because person 2 is always unvaccinated, we simplify the notation as 11 :,0a ij iij Ya Yi Using this notation, on the vaccine efficacy scale, the indirect effect is formalized by . 22 1Pr1 1Pr01YY ii (i.e., the effect on person 2 of person 1 being vaccinat- ed) [3]. In contrast, the effect on person 1 of person 1 being vaccinated is called the direct effect, and is for- malized by 11 1Pr11Pr01 ii YY . In the current setting, due to random assignment to per- son 1 and the consistency assumption, these direct and indirect effects are identified by the sample proportions 11 11 1Pr10 ii ii YA YA1Pr1 , 21 21 1 1Pr10 ii ii YA YA1Pr , respectively. The indirect effect is classified into infec- tiousness and contagion effects due to the existence of two infection mechanisms, as noted in Section 1. 2.2. Crude Estimator of the Infectiousness Effect The crude estimator of the infectiousness effect might be taken as [12]: 211 211 11, 1 10, 1 iii iii YAY YAY Pr 1Pr . (2.1) This is a comparison of the infection proportions for person 2 in the subgroup in which person 1 was vacci- nated and infected versus that in which person 1 was unvaccinated and infected. This is an appealing intuitive method of capturing the extent to which the vaccine may render those infected less contagious, which may in turn prevent the second person from being infected (i.e., in- fectiousness effect). However, the measure is subject to selection bias. Al- though the vaccine status of person 1, Ai1, is randomized, conditioning on a variable that occurs after treatment (i.e., the infection status of person 1) breaks the randomization. This can be indicated using the DAG shown in Figure 1. Even if an arrow from X to A1 does not exist due to ran- domization, conditioning for Y1 would induce non-iden- tifiability due to the induced structural relationship of a possible double arrow between A1 and X, as shown in Figure 2 [13]. As a result, the subgroup with person 1, who was vac- Copyright © 2013 SciRes. OJS  Y. CHIBA 9 A 1 Y 1 Y 2 X Figure 1. A directed acyclic graph representing the rela- tionship among A1, Y1, Y2, and X in the current context. Y 1 A 1 Y 2 X Figure 2. A graph after conditioning on Y1. cinated and infected, may be quite different from that in which person 1 is unvaccinated and infected. For exam- ple, those in the vaccinated group who become infected may be a less healthy subpopulation than those in the unvaccinated group who become infected. If the persons who are infected are less healthy even though they have been vaccinated, they may also more likely to be conta- gious and to pass on the disease. We are then computing infection proportions for person 2 for subpopulations that are quite different with respect to person 1. 2.3. Conditional Infectiousness Effect By applying the principal stratification approach, con- sider the following contrast [14]: 211 211 Pr1 1101 :1 Pr0 110 1 iii C iii YYY IYYY . (2.2) This compares the infection status of person 2 if per- son 1 was vaccinated, , versus that if person 1 was unvaccinated, 2, but only in the subgroup of households in which person 1 would have been infected irrespective of whether person 1 was vaccinated; i.e., ii . Such a subgroup is sometimes re- ferred to as a principal stratum [15]. Because we are con- sidering only the subgroup of households for whom per- son 1 would have been infected irrespective of whether person 1 was vaccinated, person 2 is exposed to the in- fection of person 1, and thus any effect of the vaccine ought to occur through a change in the infectiousness. Therefore, the conditional infectiousness effect is defined by Equation (2.2), because it is conditioned on ii . Moreover, unlike with the crude comparison in Equation (2.1), we are now comparing the infection proportions of person 2 for the same subpopu- lation in Equation (2.2). We are no longer considering a healthier or unhealthier subgroup for person 1. 21 i Y 0 i Y 01 01 11 1YY 11 1YY Unfortunately, we do not know which households fall into the subpopulation in which person 1 would have been infected irrespective of whether he or she was vac- cinated. This is because we can observe only the out- come of person 1, either with or without the vaccine but not under both scenarios. Because we do not know which households fall into this subpopulation, we cannot com- pute the conditional infectiousness effect in a straight- forward manner. However, in Section 4, we will show that the effect can be estimated simply under a number of assumptions. 2.4. Unconditional Infectiousness and Contagion Effect Suppose that, in addition to potentially intervening to vaccinate person 1, we could, at least hypothetically, in- tervene to infect or not infect person 1. Then, 2121 ,, iiii Yaay would denote the infection status of per- son 2 if we would set the vaccine status of person 1 and person 2 to ai1 and ai2 and the infection status of person 1 to yi1. The assumption that person 2 is always unvacci- nated allows a simplified notation: ,0,Ya y 211 ,: iii Yay 21 1ii i . This potential outcome is used to define unconditional infectiousness and conta- gion effects [4]. Consider the following contrast: 21 21 Pr1, 11 :1 Pr0, 11 ii U ii YY IYY . (2.3) This compares the potential infection status of person 2 if person 1 had been vaccinated versus unvaccinated and person 1 had the infection status that would occur if vaccinated. If Equation (2.3) is non-zero, this will be because even when person 1 is vaccinated and infected, the vaccine itself affects whether person 2 is infected by person 1. In some ways, it is analogous to what is called an infectiousness effect. However, this measure defined by Equation (2.3) differs from the conditional infec- tiousness effect defined by Equation (2.2) in that it is not conditional on person 1 actually being infected. Consider now the other contrast: 21 21 Pr0,11 :1 Pr0, 01 ii ii YY CYY . (2.4) The term 21 0, 1 ii YY considers what the potential infection status of person 2 is if person 1 is unvaccinated, but we set the infection status of person 1 to the level it would have been if person 1 was vaccinated. Equation (2.4) compares this potential outcome to 21 0, 0 ii YY , which is the potential infection status of person 2 if per- son 1 is not vaccinated, and we set the infection status of person 1 to the level it would be if person 1 was unvac- cinated. For Equation (2.4) to be nonzero, 11 i Y and Copyright © 2013 SciRes. OJS  Y. CHIBA Copyright © 2013 SciRes. OJS 10 10 i Y have to differ; i.e., vaccination of person 1 would have to affect the infection status of person 1, and that change in infection for person 1 would have to change the infection status for person 2, even if person 1 had remained unvaccinated. Essentially, Equation (2.4) is non-zero if the vaccine prevents infection in person 1, and that in turn prevents person 2 from being infected. Thus, the contagion effect is defined by Equation (2.4). These definitions of the unconditional infectiousness and contagion effects have the feature that we can decom- pose an indirect effect into unconditional infectiousness and contagion effects; i.e., from Equations (2.3) and (2.4), 21212 1 2 22121 21 Pr 1,11Pr1,11Pr0,11 Pr1 1 11 1 Pr0 1Pr0, 01Pr0,1 1Pr0, 01 11 1. iiiii i i iiiii ii UUU YYYYY Y Y YYYYY YY ICICIC (2.5) come infected from outside the household. This decomposition is analogous to what are referred to as “natural direct and indirect effects” [16,17] in the mediation analysis. Assumption 2. 11 1 ii YY 0 for all i. Assumption 1 implies that person 2 cannot be infected unless person 1 is infected. Assumption 2 implies 11 Pr1 1,000 ii YY ; i.e., there is no household in which person 1 would be infected if vaccinated, but uninfected if unvaccinated. 3. Relationship between Conditional and Unconditional Infectiousness Effects Under these two assumptions, 211 Pr, 11 iii YaY can be expressed as follows [7]: Here, we require the following two assumptions: Assumption 1. Only person 1, not person 2, can be- 11 211211 1111 00 11 2111 11 00 2111 11 21111 11 Pr,11Pr,111,0 Pr(1,0 Pr,11,0Pr1,0 Pr,111 1,01Pr1 1,01 Pr,1101 Pr iiiiii iiii st iiii ii st iiii ii iiiii ii YaYYaYYsY tYsY t YasYsYtYsY t YaYY YY YaYaY YY 21111 1 11 Pr1101Pr11, iiiiii YaYYY A where the third equality is because 21 11 ,0 110,00YaYY t Pr ii by Assump- tion 1 and by Assumption 2, the fourth is by Assumption 2, and the last is by ran- dom assignment to person 1 and the consistency assump- tion. i i 11 Pr1 1,000 ii YY Using this equation and Equations (2.2) and (2.3), it is readily confirmed that IU = IC under Assumptions 1 and 2. Furthermore, substituting this equation into Equation (2.4) derives the following form for the contagion effect: 211 11 21 Pr01101 Pr11 1, Pr1 0 iiiii ii YYYYA CYA 4. Estimation where the denominator is by 21 22 Pr0, 01 Pr0 1Pr1.0 ii ii YY YYA Section 4.1 presents the inverse-probability-weighting (IPW) estimators for the infectiousness and contagion effects. Section 4.2 shows that the analysis for the IPW can be implemented easily. 1i Therefore, to assess the unconditional infectiousness and contagion effects, we can apply the statistical methods developed for the conditional infectiousness effect. Such methods are described in Sections 4 and 5. We note that this form for the contagion effect is not its definition un- der the principal stratification approach. 4.1. Estimators Under Assumption 2, 21 11 Pr110 1 ii ii Ya YY an be expressed as follows: c 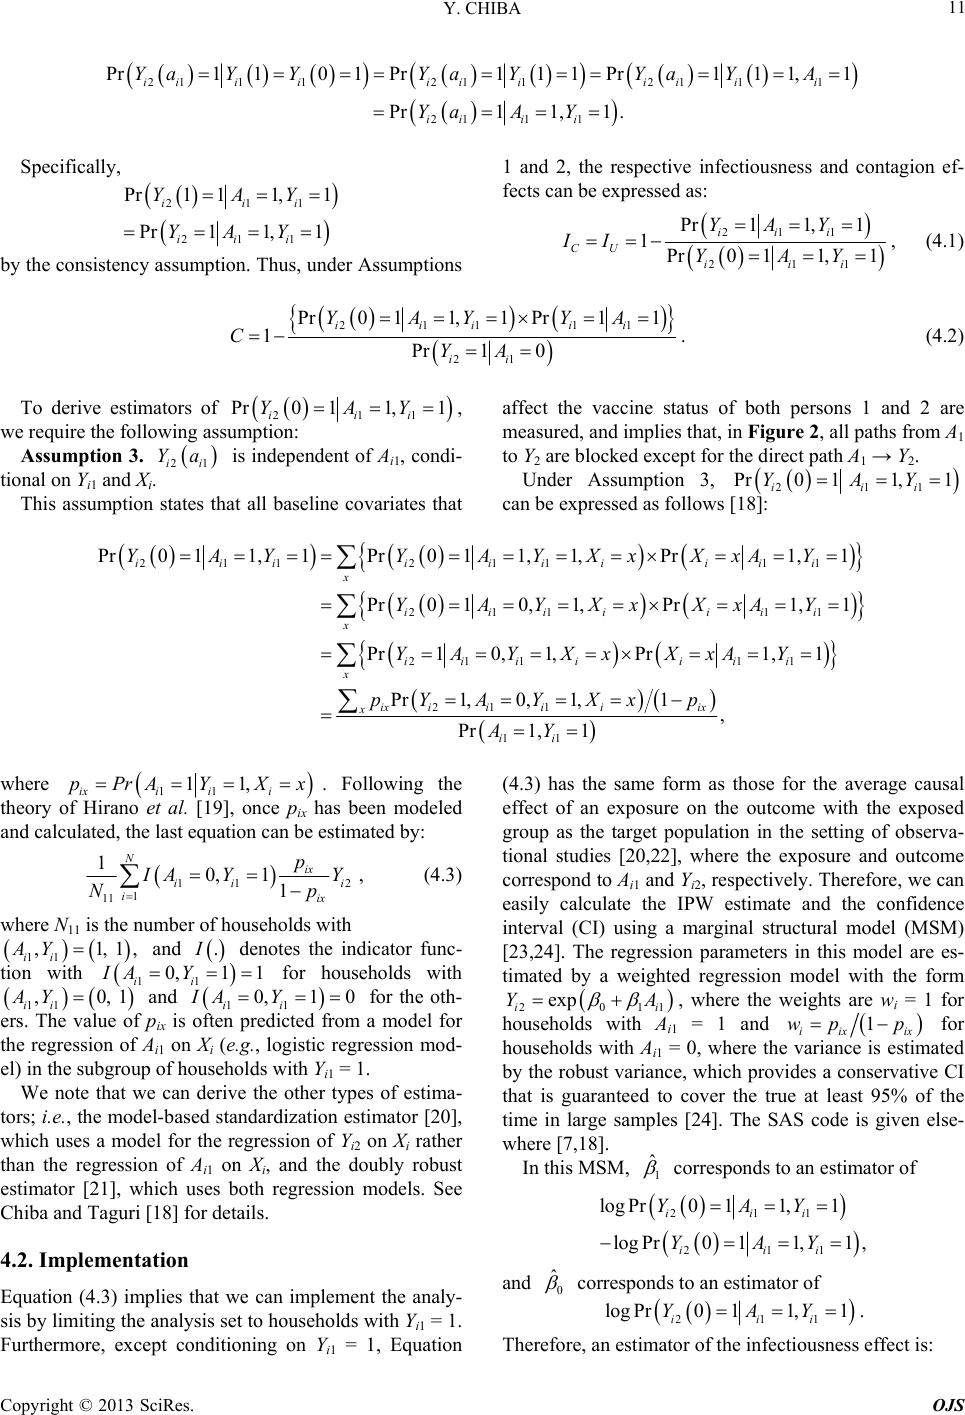 Y. CHIBA 11 21 1121 121 11 211 1 Pr1 101Pr111Pr111,1 Pr11,1. ii iiii iii ii iii i Ya YYYa YYa YA YaAY Specifically, 211 211 Pr1 11,1 Pr11, 1 iii iii YAY YAY by the consistency assumption. Thus, under Assumptions 1 and 2, the respective infectiousness and contagion ef- fects can be expressed as: 211 211 Pr11, 1 1Pr0 11,1 iii CU iii YAY II YAY , (4.1) 211 11 21 Pr011,1Pr11 1 Pr1 0 iiiii ii YAY YA CYA . (4.2) To derive estimators of 211 Pr0 11,1 iii YAY, we require the following assumption: Assumption 3. is independent of Ai1, condi- tional on Yi1 and Xi. 21ii Ya This assumption states that all baseline covariates that affect the vaccine status of both persons 1 and 2 are measured, and implies that, in Figure 2, all paths from A1 to Y2 are blocked except for the direct path A1 → Y2. Under Assumption 3, 211 Pr01 1,1 iii YAY can be expressed as follows [18]: 2 112 1111 21111 211 11 211 11 Pr 011,1Pr 011,1,Pr1,1 Pr010, 1,Pr1,1 Pr1 0,1,Pr1,1 Pr1,0,1,1 Pr 1, iiiiii iiii x iiii iii x iii iiii x ix iiiiix x ii YA YYA YXxXxA Y YAYXxXxAY YAYXx XxAY pYAYXxp AY , 1 where 11 11, ixi ii pPrA YXx . Following the theory of Hirano et al. [19], once pix has been modeled and calculated, the last equation can be estimated by: 11 1 11 10,1 1 N ix ii iix p 2 i AY Y N p , , (4.3) where N11 is the number of households with and 11 ,1, 1 ii AY . denotes the indicator func- tion with for households with and 0, 1 1 0, 11 1 ii Y IA IA 11 ,0, ii AY 11 1 0 ii Y for the oth- ers. The value of pix is often predicted from a model for the regression of Ai1 on Xi (e.g., logistic regression mod- el) in the subgroup of households with Yi1 = 1. We note that we can derive the other types of estima- tors; i.e., the model-based standardization estimator [20], which uses a model for the regression of Yi2 on Xi rather than the regression of Ai1 on Xi, and the doubly robust estimator [21], which uses both regression models. See Chiba and Taguri [18] for details. 4.2. Implementation Equation (4.3) implies that we can implement the analy- sis by limiting the analysis set to households with Yi1 = 1. (4.3) has the same form as those for the average causal effect of an exposure on the outcome with the exposed group as the target population in the setting of observa- tional studies [20,22], where the exposure and outcome correspond to Ai1 and Yi2, respectively. Therefore, we can easily calculate the IPW estimate and the confidence interval (CI) using a marginal structural model (MSM) [23,24]. The regression parameters in this model are es- timated by a weighted regression model with the form Furthermore, except conditioning on Yi1 = 1, Equation 2011 exp ii YA , where the weights are wi = 1 for = 1 and households with Ai11 iixix wp p for households with Ai1 = 0, where theated by the robust variance, which provides a conservative CI that is guaranteed to cover the true at least 95% of the time in large samples [24]. The SAS code is given else- where [7,18]. In this MSM variance is estim , 1 ˆ corresponds to an estimator of 211 211 r log Pr011,,1 iii iii Y YAY log P011,1AY and 0 ˆ corresponds to an estimator of 1 211 log Pr011, iii YAY . Therefore, an estimator of the infectiousness effect is: Copyright © 2013 SciRes. OJS 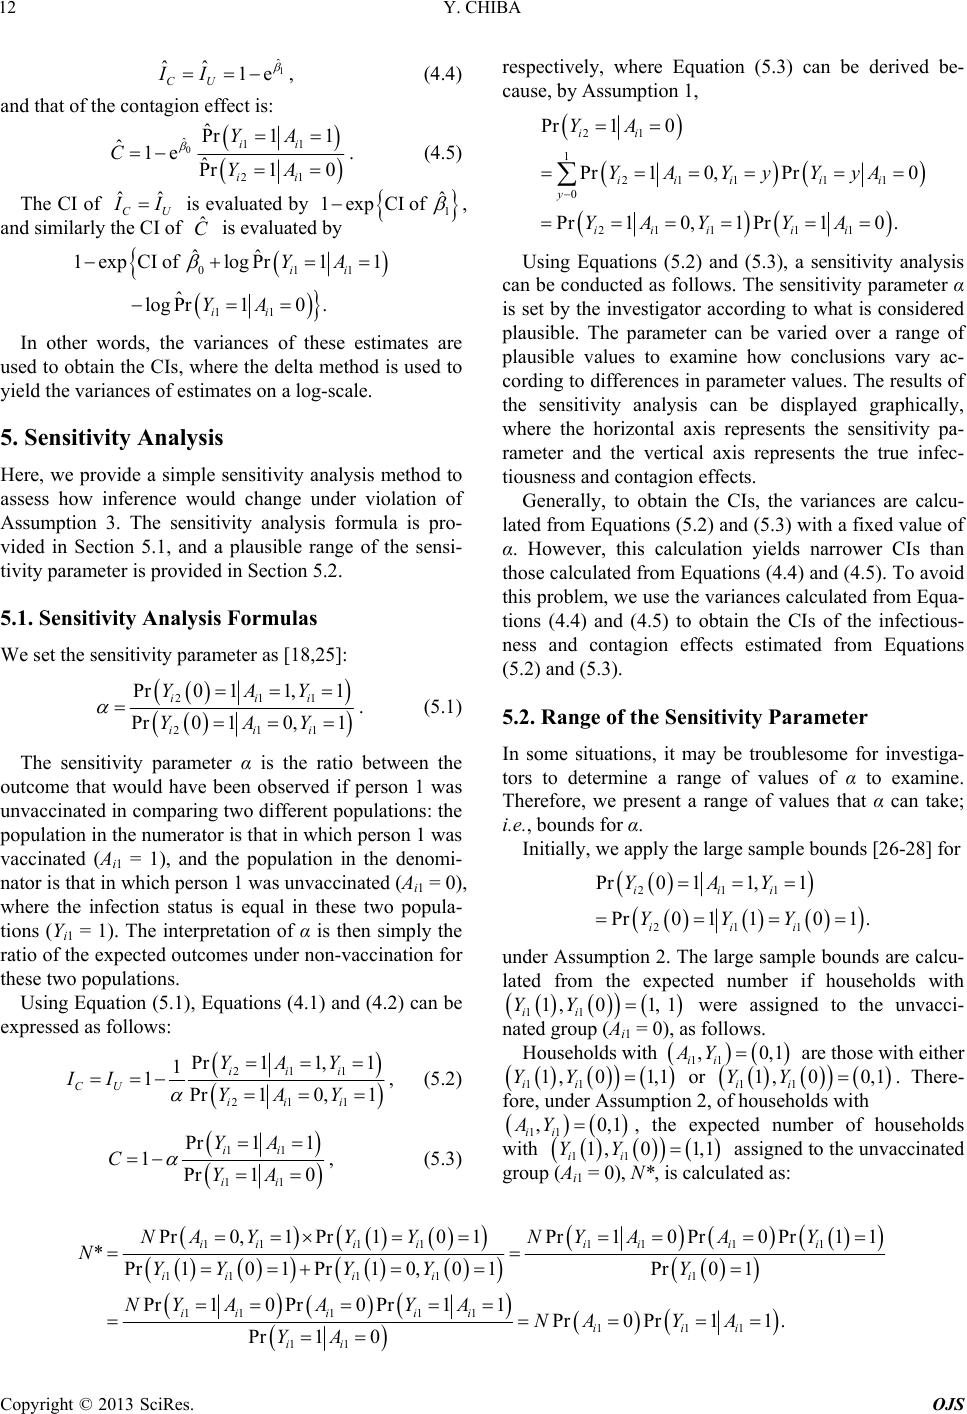 Y. CHIBA 12 1 ˆ ˆˆ 1e CU II , (4.4) and that of the contagion effect is: 0 ˆ1 1 ˆ Pr 1 ˆ 0 i i Y A 1 1 i A 2 1e ˆ Pr 1 i CY The CI of . (4.5) ˆˆ CU I is evaluated by 1 1expCI ofˆ , by and similarl is evaluated y the CI of C ˆ 1 11 1 1pCI oi ii A Y In other words, the variances of these estimtes are used to obtain the CIs, where the delta method is used to yield the varia Here, we provide a simple sensitivity analysis method to change under violation of We set the sensitivity parameter as [18,25]: 01 ˆˆ log Pr ˆ log Pr10 1ex f . i Y A a nces of estimates on a log-scale. 5. Sensitivity Analysis assess how inference would Assumption 3. The sensitivity analysis formula is pro- vided in Section 5.1, and a plausible range of the sensi- tivity parameter is provided in Section 5.2. 5.1. Sensitivity Analysis Formulas 211 Pr0 11, iii YAY 21 1 Pr 0 10,1 ii i YA Y 1. (5.1) The sensitivity parameter α is the ratio outcome that would have been observed if unvaccinate between the person 1 was d in comparing two different populations: the population in the numerator is that in which person 1 was vaccinated (Ai1 = 1), and the population in the denomi- nator is that in which person 1 was unvaccinated (Ai1 = 0), where the infection status is equal in these two popula- tions (Yi1 = 1). The interpretation of α is then simply the ratio of the expected outcomes under non-vaccination for these two populations. Using Equation (5.1), Equations (4.1) and (4.2) can be expressed as follows: 211 Pr11, 1 1 1iii CU YAY II 211 Pr 10, 1 iii YAY , (5.2) 11 11 Pr1 1 1Pr1 0 ii ii YA CYA , (5.3) respectively, where Equation (5.3) can be derived be- cause, by Assumption 1, 21 1 21111 0 211 11 Pr1 0 Pr1 0,Pr0 Pr 10,1Pr10. ii iiiii y iii ii YA YAYyYyA YAY YA Using Equations (5.2) and (5.3), a sensitivity analysis can be conducted as follows. The sensitivity parameter α is set by the investigator according to what is considered plausible. The parameter can be varied over a range of plausible values to examine how conclusions vary ac- cording to differences in parameter values. The results of the sensitivity analysis can be displayed graphically, where the horizontal axis represents the sensitivity pa- rameter and the vertical axis represents the true infec- tiousness and contagion effects. Generally, to obtain the CIs, the variances are calcu- lated from Equations (5.2) and (5.3) with a fixed value of α. However, this calculation yields narrower CIs than those calculated from Equations (4.4) and (4.5). To avoid this problem, we use the variances calculated from Equa- tions (4.4) and (4.5) to obtain the CIs of the infectious- ness and contagion effects estimated from Equations (5.2) and (5.3). 5.2. Range of the Sensitivity Parameter In some situations, it may be troublesome for investiga- tors to determine a range of values of α to examine. Therefore, we present a range of values that α can take; i.e., bounds for α. Initially, we apply the large sample bounds [26-28] for 211 211 Pr0 11,1 Pr0 110.1 iii iii YAY YYY under Assumption 2. The large sample bounds are calcu- lated from the expected number if households with 1,01, 1YY 11ii were assigned to the unvacci- nated group (Ai1 = 0), as follows. ,0,1AY 11ii are those with either Households with 1, 01,1YY 11ii or 1, 00,1YY 11ii . There- fore, under Assumption 2, of households with ,0,1AY 11ii , the expected number of households with 1, 01,1YY 11ii assigned to the unvaccinated group (Ai1 = 0), N*, is calculated as: 11 1 111 11111 11111 111 11 11 Pr0,1PPr10 Pr0 Pr11 *Pr101Pr10,0 1Pr01 Pr10 Pr0 Pr11Pr0Pr11 . Pr1 0 iii iiiii iii ii iii ii iii ii NAYNYAAY NYYY YY NY AAY ANAYA YA r101Y Y Copyright © 2013 SciRes. OJS  Y. CHIBA 13 Using this number, the lower bound of 211 211 Pr0 11,1 Pr0 110 1 iii iii YAY YYY is 010 010 0* *0 NNN N 1 max , **NN , and the upper bound is 011 011 *0 *1 min , ** NNN N NN , 1 where is the num- *112 Pr, ,* ayyi ii NNAaYyYy 112 ,,, iii ber of households with ,* YY ay ing bounds for α: y. Some algebra yields the follow 11 11 max0, 111min,, PQ PQ where 11 Pr11 P ii PYA d 1 1 r 10| i i YA an 211 Pr10, 1 iii QYAY . We note that thr bound is the same as or smaller than that deri e uppe ved by Chiba and Taguri [7], which is 1/P under Assumptions 1 and 2. Next, we consider the bounds for α under Assumption e following assumption [25,29]: Assumption 4. 2 and th Pr 0 10,.1YAY le insofar as the poperson 1 was vaccinated is likely to be less healthy (or the infection is more virulent) than that in which person 1 was unvaccinated. Tpopu- lation in which person 1 was infected despreceiving the vaccination would be less healthy than the second po ran- ve pneumococcal conjugate vaccine umococcus serotype. The colonization status with respect to the given serotype of the 1-year-old child and the mother is also monitored. Because pneu- mococcus is highly prevalent in young childrewho at- tend day care, the mother is more likely to acquire the pneumococcus from the child than through other trans- 211 Pr0 11,1 iii YAY 21 1iii This assumption is arguably reasonab pulation in which he first ite pulation in which person 1 was unvaccinated and in- fected. Thus, under the scenario in which both persons are unvaccinated, person 2 is more likely to be infected in the first than in the second population. Under Assumptions 2 and 4, it is obvious that α ≥ 1. While the large sample bounds generally yield a wide range, if Assumption 4 is plausible, it will yield a nar- rower width than the large sample bounds only. 6. Illustration To illustrate the methods presented in Sections 4 and 5, we employ data from a hypothetical vaccine trial used elsewhere [4]. Consider now a vaccine trial setting in which 1-year-old children at a day-care center are domized to recei against a given pne n mission routes. Here, we assume that the second person (the mother) can be infected only from the first (the 1-year-old child). The hypothetical data are given in Ta- ble 1. Under Assumptions 1-3, using a MSM, Equations (4.4) and (4.5) yielded an IPW estimate of the infec- tiousness effect of 0.44 (95% CI: 0.33, 0.53) and an IPW estimate of the contagion effect of 0.54 (95% CI: 0.46, 0.61). The overall indirect effect was 1 − (79/1000)/ (305/1000) = 0.74 (95% CI: 0.67, 0.79), which equals the decomposition of Equation (2.5): 0.44 + 0.54 − 0.44 × 0.54 = 0.74. To assess how inference would change under violation of Assumption 3, we implemented the sensitivity analy- sis presented in Section 5. Before the implementation, we determined the bounds for α to determine the range to be examined. The large sample bounds yielded bounds for α of 0.04 ≤ α ≤ 1.80. By adding Assumption 4, this range was narrowed to 1.00 ≤ α ≤ 1.80. For this range of α, we implemented the sensitivity analysis using Equations (5.2) and (5.3). The results are shown in Figure 3 for the infectiousness effect and Figure 4 for the contagion ef- fect. For this range of α, the respective lower and upper limits of the infectiousness effect were 0.43 (95% CI: 0.31, 0.53) and 0.68 (95% CI: 0.62, 0.74), and those of the contagion effect were 0.18 (95% CI: 0.04, 0.30) and 0.55 (95% CI: 0.47, 0.61). The IPW estimates under As- sumption 3 correspond to the estimates for α = 1.01 in Figures 3 and 4. Table 1. Numbers infected (Yi1, Yi2) from a hypothetical randomized trial of pneumococcal conjugate vaccine with 2000 householdsa. Yi1 = 0 Yi2 = 0 Yi1 = 1 Yi2 = 0 Yi1 = 1 Yi2 = 1 Total Low SES Ai1 = 0, Ai2 = 0 200 120 180 500 Ai1 = 1, Ai2 = 0 350 96 54 500 High SES i1i2400 75 25 500 Ai1 = 0, Ai2 = 0 250 125 125 500 A = 1, A = 0 aPerson 1 (the 1-year-olas ed 1:1 to vaccine rol, and person 2 (the mothet vavactatus [Ai1, Ai2]), and half the households have either low or high socioeconomic status (SES). d cild) w r) was no hran omiz ccinated ( dor cont cination s Copyright © 2013 SciRes. OJS  Y. CHIBA 14 0.3 0.4 0.5 ious 0.6 ess E 0.7 0.8 1.11.3.5 1.1.8 ct nf Alpha Fiy analysis of fectiess effe 11.21.4 16 1.7 Infe fect gure 3. Sensitivitthe inousnect; th solid line indicates the infectiousness effect and broken lines indicate 95% confidence intervals. 0 0.1 0.2 0.3 0.4 0.5 0.6 0.7 11.1 1.21.31.41.5 1.61.71.8 Contagion Effect Alpha Figure 4. Sensitivity analysis of the contagion effect; the solid line indicates the contagion effect and broken lines indicate 95% confidence intervals. 7. Discussion In this paper, by applying a simple relationship between conditional and unconditional infectiousness effects, have presented simple statistical methods to assess t infectiousness and contagion effects. Although the meth- ods for the infectiousness effects are a review of the past literature, we have summarized them in the present We have further applied them to infer the contion ef- n be partially veri data by examining whether we he paper. ag fect. The methods presented here are limited by the as- sumptions. While Assumption 1 cafied from the observed 21 Pr1 0 ii YY0, Assumption 2 cannot be verified he principal stratific from the observed data. Although we believe that As- sumption 2 will be plausible in many settings, whether the assumption holds will depend on the nature of the vaccine under study. Therefore, the assumption will not be applicable to all vaccines [18]. In such situations, un- fortunately, the methods presented here cannot be ap- plied. Nevertheless, for unconditional infectiousness and contagion effects, we can still apply the methods devel- oped in the context of the mediation analysis approach [30-33], and for the conditional infectiousness effect, we can also apply the methods developed in the context of tation approach [25-28]. However, these methods have a weakness in that they are more complex than those in this paper. The framework used also made an assumption of par- tial interference. This might be plausible if the various households are sufficiently geographically separated or do not interact. In certain settings, this assumption might be plausible. Nevertheless, future work will attempt to generalize the methods given here to allow for violations of this assumption. 8. Acknowledgements This work was supported partially by Grant-in-Aid for Scientific Research (No. 23700344) from the Ministry of Education, Culture, Sports, Science, and Technology of Japan. REFERENCES [1] M. E. Halloran and M. G. Hudgens, “Causal Inference for Vaccine Effects on Infectiousness,” International Journal of Biostatistics, Vol. 8, No. 2, 2012, Article 6. doi:10.2202/1557-4679.1354 nce between Units in Ran- urnal of the American Statisti- [2] P. R. Rosenbaum, “Interfere domized Experiments,” Jo cal Association, Vol. 102, No. 477, 2007, pp. 191-200. doi:10.1198/016214506000001112 [3] M. G. Hudgens and M. E. Halloran, “Towards Causal Inference with Interference,” Journal of the American Sta- tistical Association, Vol. 103, No. 482, 2008, pp. 832-842. doi:10.1198/016214508000000292 [4] T. J. VanderWchetgen and M. E. Halloran, “Components of the Indirect Effect in Vaccine eele, E. J. Tchetgen T Trials: Identification of Contagion and Infectiousness Ef- fects,” Epidemiology, Vol. 23, No. 5, 2012, pp. 751-761. doi:10.1097/EDE.0b013e31825fb7a0 [5] S. Datta, M. E. Halloran and I. M. Longini, “Efficiency of 2.x Estimating Vaccine Efficacy for Susceptibility and Infec- tiousness: Randomization by Individual Versus House- hold,” Biometrics, Vol. 55, No. 3, 1999, pp. 792-798. doi:10.1111/j.0006-341X.1999.0079 0000970 [6] M. G. Hudgens and M. E. Halloran, “Causal Vaccine Ef- fects on Binary Post-Infection Outcomes,” Journal of the American Statistical Association, Vol. 101, No. 473, 2006, pp. 51-64. doi:10.1198/01621450500 [7] Y. Chiba and M. Taguri, “Conditional and Unconditional Infectiousness Effects in Vaccine Trials,” Epidemiology, Vol. 24, No. 2, 2013, pp. 336-337. doi:10.1097/EDE.0b013e31828261f5 M. M. Glymour and S. Greenland, “Causal Diagram[8] s,” In: K. J. Rothman, S. Greenland and T. L. Lash, Eds., Modern Epidemiology, 3rd Edition, Lippincott Williams and Wil- kins, Philadelphia, 2008, pp. 183-209. [9] J. Pearl, “Causality: Models, Reasoning, and Inferen 2nd Edition, Cambridge University P ce,” ress, Cambridge, 2009. [10] M. E. Sobel, “What Do Randomized Studies of Housing Mobility Demonstrate? Causal Inference in the Face of Interference,” Journal of the American Statistical Associa- tion, Vol. 101, No. 476, 2006, pp. 1398-1407. Copyright © 2013 SciRes. OJS  Y. CHIBA Copyright © 2013 SciRes. OJS 15 doi:10.1198/016214506000000636 [11] T. J. VanderWeele, “Concerning th sumption in Causal Inference,” Epidem e Consistency As- iology, Vol. 20, No. 6, 2009, pp. 880-883. doi:10.1097/EDE.0b013e3181bd5638 [12] M. E. Halloran, M. P. Préziosi and H. Chu, “Estimating Vaccine Efficacy from Secondary Attack Rates,” Journal of the American Statistical Association, Vol. 98, No. 461, 2003, pp. 38-46. doi:10.1198/016214503388619076 [13] S. Greenland, J. Pearl and J. M. Robins, “Causal Diagrams urnal of the l. 101, No. 473, 2006, for Epidemiologic Research,” Epidemiology, Vol. 10, No. 1, 1999, pp. 37-48. [14] M. G. Hudgens and M. E. Halloran, “Causal Vaccine Ef- fects on Binary Post-Infection Outcomes,” Jo American Statistical Association, Vo pp. 51-64. doi:10.1198/016214505000000970 [15] C. E. Frangakis and D. B. Rubin, “Principal Stratification in Causal Inference,” B 21-29. iometrics, Vol. 58, No. 1, 2002, pp. doi:10.1111/j.0006-341X.2002.00021.x aguri, “Assessing the Causal Infec- ficient Esti- [16] J. M. Robins and S. Greenland, “Identifiability and Ex- changeability for Direct and Indirect Effects,” Epidemiol- ogy, Vol. 3, No. 2, 1992, pp. 143-155. [17] J. Pearl, “Direct and Indirect Effects,” Proceedings of the Seventeenth Conference on Uncertainty and Artificial In- telligence, San Francisco, 2-5 August 2001, pp. 411-420. [18] Y. Chiba and M. T tiousness Effect in Vaccine Trials,” In: iConcept Press, Ed., Vaccines—Benefits and Risks, iConcept Press, Hong Kong, 2013, in press. [19] K. Hirano, G. W. Imbens and G. Ridder, “Ef mation of Average Treatment Effects Using the Estimated Propensity Score,” Econometrica, Vol. 71, No. 4, 2003, pp. 1161-1189. [20] S. Greenland, “Estimating Standardized Parameters from Generalized Linear Models,” Statistics in Medicine, Vol. 10, No. 7, 1991, pp. 1069-1074. doi:10.1002/sim.4780100707 [21] M. Taguri, Y. Matsuyama, Y. Ohashi, A. Harada and H. Ueshima, “Doubly Robust Estimation of the Generalized Impact Fraction,” Biostatistics, Vol. 13, No. 3, 2012, pp. 455-467. doi:10.1093/biostatistics/kxr038 [22] T. Sato and Y. Matsuyama, “Marginal Structural Models as a Tool for Standardization,” Epidemiology, Vol. 14, No. 6, 2003, pp. 680-686. doi:10.1097/01.EDE.0000081989.82616.7d [23] J. M. Robins, “Association, Causation, and Marginal Structural Models,” Synthese, Vol. 121, No. 1-2, 1999, pp. 151-179. doi:10.1023/A:1005285815569 [24] J. M. Robins, M. A. Hernán and B. A. Brumback, “Mar- ginal Structural Models and Causal Inference in Epidemi- ology,” Epidemiology, Vol. 11, [25] Y. Chiba and T. J. VanderWeele, “A Simpl No. 5, 2000, pp. 550-560. e Method for Principal Strata Effects When the Outcome Has Been Truncated Due to Death,” American Journal of Epidemi- ology, Vol. 173, No. 7, 2011, pp. 745-751. doi:10.1093/aje/kwq418 [26] J. L. Zhang and D. B. Rubin, “Estimation of Causal Ef- fects via Principal Stratification When Some Outcomes Are Truncated by Death,” Journal of Educational and Behavioral Statistics, Vol. 28, No. 4, 2003, pp. 353-368. doi:10.3102/10769986028004353 [27] J. L. Zhang, D. B. Rubin and F. Mealli, “ Effects of Job Training P Evaluating the rograms on Wages through Prin- unds on the Principal cipal Stratification,” In: D. Millimet, J. Smith and E. Vyt- lacil, Eds., Advances in Econometrics: Modeling and Eva- luating Treatment Effects in Econometrics, Elsevier Sci- ence, New York, 2008, pp. 117-145. [28] Y. Chiba, “The Large Sample Bo Strata Effect with Application to a Prostate Cancer Pre- vention Trial,” International Journal of Biostatistics, Vol. 8, No. 1, 2012, Article 12. doi:10.1515/1557-4679.1365 [29] T. J. VanderWeele and E. J. Tchetgen Tchetgen, “Bound- ing the Infectiousness Effect in Vaccine Trials,” Epidemi- ology, Vol. 22, No. 5, 2011, pp. 686-693. doi:10.1097/EDE.0b013e31822708d5 [30] Sjölander, “Bounds on Natural Direct Effects in the Pres- ence of Confounded Intermediate Variables,” Statistics in Medicine, Vol. 28, No. 4, 2009, pp. 558-571. doi:10.1002/sim.3493 [31] T. Lange, S. Vansteelandt and M. Bekaert, “A Simple Unified Approach for Estimating Natural rect Effects,” American Journal of Epid Direct and Indi- emiology, Vol. 176, No. 3, 2012, pp. 190-195. doi:10.1093/aje/kwr525 [32] L. Valeri and T. J. VanderWeele, “Mediation Analysis Allowing for Exposure-Mediator Interactions Interpretation: Theoret and Causal ical Assumptions and Implementa- tion with SAS and SPSS Macros,” Psychological Methods, Vol. 18, No. 2, 2013, pp. 137-150. doi:10.1037/a0031034 [33] Y. Chiba and M. Taguri, “Alternative Monotonicity As- sumptions for Improving Bounds on Natural Direct Ef- fects,” International Journal of Biostatistics, in press. doi:10.1515/ijb-2012-0022
|