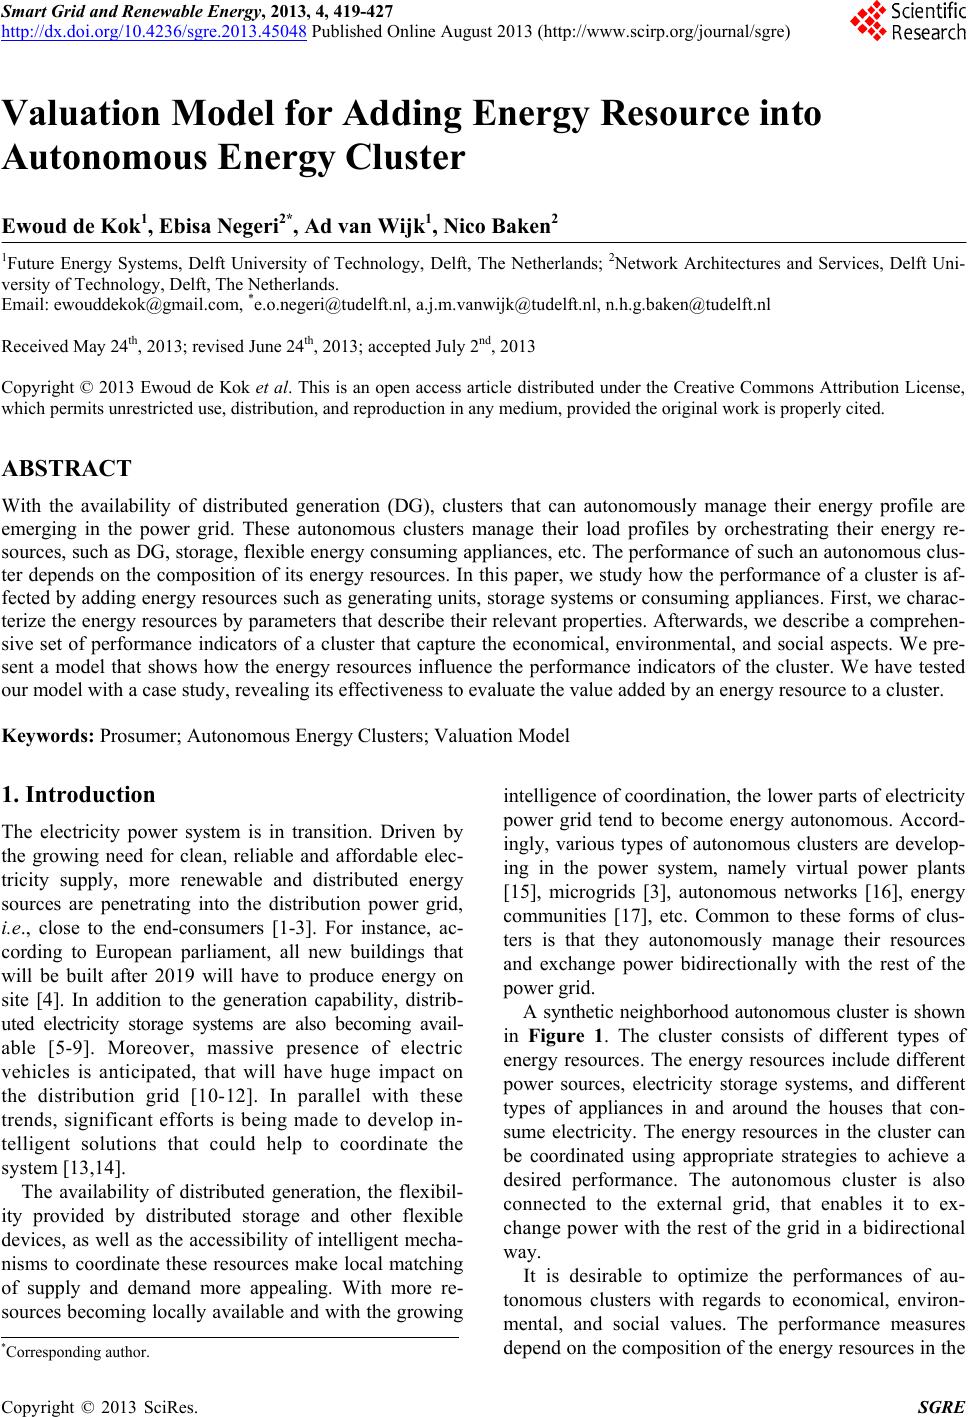
 Smart Grid and Renewable Energy, 2013, 4, 419-427 http://dx.doi.org/10.4236/sgre.2013.45048 Published Online August 2013 (http://www.scirp.org/journal/sgre) Copyright © 2013 SciRes. SGRE 419 Valuation Model for Adding Energy Resource into Autonomous Energy Cluster Ewoud de Kok1, Ebisa Negeri2*, Ad van Wijk1, Nico Baken2 1Future Energy Systems, Delft University of Technology, Delft, The Netherlands; 2Network Architectures and Services, Delft Uni- versity of Technology, Delft, The Netherlands. Email: ewouddekok@gmail.com, *e.o.negeri@tudelft.nl, a.j.m.vanwijk@tudelft.nl, n.h.g.baken@tudelft.nl Received May 24th, 2013; revised June 24th, 2013; accepted July 2nd, 2013 Copyright © 2013 Ewoud de Kok et al. This is an open access article distributed under the Creative Commons Attribution License, which permits unrestricted use, distribution, and reproduction in any medium, provided the original work is properly cited. ABSTRACT With the availability of distributed generation (DG), clusters that can autonomously manage their energy profile are emerging in the power grid. These autonomous clusters manage their load profiles by orchestrating their energy re- sources, such as DG, storage, flexible energy consuming appliances, etc. The performance of such an autonomous clus- ter depends on the composition of its energy resources. In this paper, we study how the performance of a cluster is af- fected by adding energy resources such as generating units, storage systems or consuming appliances. First, we charac- terize the energy resources by parameters that describe their relevant properties. Afterwards, we describe a comprehen- sive set of performance indicators of a cluster that capture the economical, environmental, and social aspects. We pre- sent a model that shows how the energy resources influence the performance indicators of the cluster. We have tested our model with a case study, revealing its effectiveness to evaluate the value added by an energy resource to a cluster. Keywords: Prosumer; Autonomous Energy Clusters; Valuation Model 1. Introduction The electricity power system is in transition. Driven by the growing need for clean, reliable and affordable elec- tricity supply, more renewable and distributed energy sources are penetrating into the distribution power grid, i.e., close to the end-consumers [1-3]. For instance, ac- cording to European parliament, all new buildings that will be built after 2019 will have to produce energy on site [4]. In addition to the generation capability, distrib- uted electricity storage systems are also becoming avail- able [5-9]. Moreover, massive presence of electric vehicles is anticipated, that will have huge impact on the distribution grid [10-12]. In parallel with these trends, significant efforts is being made to develop in- telligent solutions that could help to coordinate the system [13,14]. The availability of distributed generation, the flexibil- ity provided by distributed storage and other flexible devices, as well as the accessibility of intelligent mecha- nisms to coordinate these resources make local matching of supply and demand more appealing. With more re- sources becoming locally available and with the growing intelligence of coordination, the lower parts of electricity power grid tend to become energy autonomous. Accord- ingly, various types of autonomous clusters are develop- ing in the power system, namely virtual power plants [15], microgrids [3], autonomous networks [16], energy communities [17], etc. Common to these forms of clus- ters is that they autonomously manage their resources and exchange power bidirectionally with the rest of the power grid. A synthetic neighborhood autonomous cluster is shown in Figure 1. The cluster consists of different types of energy resources. The energy resources include different power sources, electricity storage systems, and different types of appliances in and around the houses that con- sume electricity. The energy resources in the cluster can be coordinated using appropriate strategies to achieve a desired performance. The autonomous cluster is also connected to the external grid, that enables it to ex- chang e power with the rest of the gr id in a bidirectional way. It is desirable to optimize the performances of au- tonomous clusters with regards to economical, environ- mental, and social values. The performance measures depend on the composition of the energy resources in the *Corresponding a uthor.  Valuation Model for Adding Energy Resource into Autonomous Energy Cluster Copyright © 2013 SciRes. SGRE 420 Figure 1. A neighborhood autonomous energy cluster. cluster, since the energy resources have different contri- butions to the different performance measures of the cluster. Therefore, finding the right composition of the energy resources plays a significant role to obtain the desired performance of the cluster. To find the right composition of the energy resources in the cluster, the influence of each energy resource on the performances of the cluster need to be clearly identified. In this paper, we present a novel study that investi- gates how the energy resources in an autonomous cluster influence the performance of the cluster. We consider a generic autonomous cluster. To do this, we identify the characteristics of the energy resources that influence the performance of the cluster. Further, we describe a com- prehensive set of relevant performance indicators of the cluster, and then model how these performance indica- tors are influenced by the characteristics of the energy resources. This enables us to model the value added to the cluster by adding an energy resource. The rest of this paper is organized as follows. We pre- sent the related work in Section 2. After presenting the characteristics of the energy resources in Section 3, we present our model of the performance indicators of a cluster in Section 4. In Section 5, we present our case study that is used to test our model. Finally, the conclud- ing remarks are presented in Section 6. 2. Related Work With the trend of increasing availability of distributed energy resources, various forms of autonomous clusters have been proposed. A Virtual Power Plant (VPP) [15] is a collectively managed cluster of distributed power sources. A Microgrid [3] is a low voltage distribution system comprising of distributed generations, storage systems and controlled loads that are coordinated to achieve a controllable operation either as an island or connected to the power grid. Autonomous network [16] is a part of the power grid but its behavior is more or less independent from the rest, and its primary aim is opti- mizing its normal operatio n. An energy community [9] is a cluster of prosumers that exchange power with the rest of the system as a single unit. In autonomous clusters, desirable performances are achieved by orchestrating their energy resources. Cost, emission and reliability/robustness are common per- formance indicators in the power system. There are a couple of works in the literature that attempt to optimize some of these performance indicators on specific systems, a review of which is provided in [18]. However, a com- prehensive model that evaluates the performance indica- tors of a cluster in terms of the properties of its constitu- ent energy resources is missing, and this work attempts to fill this gap. In this work, we propose a model that evaluates the value gained by adding an energy resource to an au- tonomous cluster. In addition to the common perform- ance indicators mentioned before, we propose two rele- vant performance indicators of an autonomous cluster, namely independence and convenience, that also capture other performance aspects of a cluster as will be de- scribed later.  Valuation Model for Adding Energy Resource into Autonomous Energy Cluster Copyright © 2013 SciRes. SGRE 421 3. Characterizing the Energy Resources In this paper, energy resource of a cluster refers to gen- eration unit, energy storage system, or consuming appli- ance that is part of the cluster. Energy resources have different characteristics that influen ce the performance of the cluster. In this section, eight characteristics are iden- tified, namely cost, emissions, failure rate, responsive- ness, controllability, predictability, availability, and con- venience. These characteristics are described subse- quently. 3.1. Cost An energy resource has a fixed cost which represents the investment cost incurred to install it. Over a given period of time T, the fixed cost can be translated to depreciation cost. Depreciation costs are the costs due to the value degradation of the energy resources as a result of aging and usage. Depreciation of an energy resource depends on how intensiv ely it is used, i.e. if it is used more inten- sively, it depreciates faster. Thus, the depreciation cost dep c of an energy resource over an interval of time T is obtained by multiplying its fixed cost c by its de- preciation over TD, as shown in Equation (1). In addition, an energ y resource has a variable cost that is associated with its operation. The variable cost of an energy resource over a period var Tc can be obtained as shown in Equation (2), where cv is its average cost of supplying a unit energy, and E is the total amount of en- ergy supplied by the energy resource in the time interval T. dep f ccD (1) var v ccE (2) 3.2. Emission An energy resource usually has green-house gas emission associated with it, that could be divided into fixed emis- sion and variable emission. The total fixed emission m is the emission associated with manufacturing and installation process of the energy resource. The va- riable emission is the emission resulting from the opera- tion of the energy resource. Similar to the cost, the depreciation and variable emis- sions over period T (dep m and var m) of an energy re- source can be obtained as shown in Equations (3) and (4), respectively, where m is the fixed emission of the energy resource, and v m is the emission of the energy resource per unit of the en ergy it supplies. dep f mmD (3) var v mmE (4) 3.3. Failure Rate Failure rate expresses the probability of failure of an en- ergy resource. Given an expected rate of failure per year , a continuous probability distribution function can be used to model the failure probability. Commonly, the exponential distribution function is used. Accordingly, the probability that a failure occurs within a time dura- tion of T can be expressed as: 0ed 1e TT FT (5) 3.4. Predictability The predictability of an energy resource indicates how accurately its power supply or demand can be forecasted. Two parameters are important to describe predictability, the coefficient of reliability and the time t. The coefficient of reliability tells how reliable the predic- tion is. Predictability is measured by the prediction un- certainty interval from the expected value. The prediction uncertainty interval is denoted by , which depends o n both and t. For example, ,0.3,45 PP P t means that the prediction is 30% confident that at 4t the value will be within ±5 uncertainty interval from the expected value. Based on these, we quantify the predictability factor r of an energy resource as shown in Equation (6), where T is the length of the time period over which the prediction is made, and U is the capacity of the energy resource. r is computed by integrating the prediction un- certainty interval over the time period T and all coefficients of reliability , and then normalized by U. The normalization is done so that r gives the amount of uncertainty per capacity of the energy resource. A lower predictability factor r indicates a higher predict- ability. 1 00 1,dd TP rTt t U (6) 3.5. Availability Availability of an energy resource tells whether it is available for use when it is needed. This characteristic also captures the usefulness of its availability. For exam- ple, a power source that is available at periods of surplus production but not available at the times when there is deficiency of supply has low availability. When quanti- fying the availability, two parameters of importance are the expected availability At and the correspond- ing uncertainty At . While At tells when the energy resource is available, At represents the level of uncertainty of the availability. To capture the usefulness of the availability of an en- ergy resource, we propose an availability factor that de-  Valuation Model for Adding Energy Resource into Autonomous Energy Cluster Copyright © 2013 SciRes. SGRE 422 pends on the situation in the cluster. We denote the situa- tion in the cluster by S, which represents the amount of extra power production/consumption needed based on whether there is shortage/surplus of power generation in the cluster, normalized by the largest instantaneous po- wer demand in the cluster. In order to determine the availability of an energy resource to supply power, S is computed based on the need of extra power supply, whereas to determine the availability of an energy re- source to consume/store power, S is computed based on the need of extra power consumption. Accordingly, we propose to compute the availability factor a over a period of time T as shown in Equation (7). 0d A T A tSt aT t t (7) 3.6. Controllability Controllability refers to the extent to which the power supply/consumption of an energy resource can be con- trolled. In our case, controlling means making it produce or consume a required amount of electricity on demand. For example, the charging rate of a battery storage can be tuned below the maximum possible charging rate. The controllability of an energy resources is subject to its inherent constraints. For instance, charging of a storage is constrained by its maximum charging rate, state of charge, and storage capacity. Therefore, we propose to measure controllability b as the length of the interval over which the power supply/consumption of an energy resource can be varied, as restricted by its inherent con- straints. 3.7. Responsiveness Responsiveness represents the duration of time it takes the energy resource to respond to a power production/ consumption request from the cluster. Some energy re- sources respond in few seconds, while others do in few minutes or more. For example, a battery storage can re- spond to a request in few seconds, while a fuel cell re- sponds in a couple of seconds to minutes. Thus, respon- siveness of an energy resource, x, is expressed as the length of the time interval between receiving the request and respond ing to the request. 3.8. Convenience Convenience refers to the perception of people about an energy resource r egarding its disruption of their comfor t. Comfort can have various dimensions such as noise, vis- ual disturbance, etc. For example, installing wind tur- bines in a residential neighborhood could lead to visual disturbance. People can have different opinion about the importance of a comfort dimension. The importance can be rated with integers ranging from 0 to 3. An energy resource can be evaluated against each comfort dimen- sion with a score ranging from say 1 to 10. Therefore, convenience can be measured by surveying the opinion of the people about the importance and score of each comfort dimension. Afterwards, convenience factor v is computed as shown in Equation (8), where h and l are the impo r ta n c e and s cor e, r e sp e ctiv e ly, o f th e th j comfort dimension. comfortdimension comfortdimension j j j j hl vh (8) 4. Performance Indicators of a Cluster In this work, a cluster is a general term that refers to a part of the power grid that autonomously manages its own resources and is capable of exchanging power bidi- rectionally with the rest of the power grid. The perform- ance of a grid cluster could be evaluated by comprehen- sively considering the economical, environmental, socie- tal aspects. This approach enables a holistic evaluation of the cluster. Accordingly, we present a comprehensive set of performance indicators that cover the economical, environmental and societal aspects. These performance indicators include cost, emission, robustness, independ- ence, and convenience. The value gained by adding an energy resource into the cluster depends on the precedence of usage of the energy resources in the cluster. For example, in case of excess power production, using a flexible load to match demand and supply could be given priority compared to storing the excess power in a battery storage. Thus, add- ing a flexible load to a cluster could alter the contribution a previously existing battery storage makes to the cluster. When the contribution of the energy resources change, the performance indicators of the cluster might change as well. Next, we will present the performance indicators to- gether with how they are influenced by the characteris- tics of the energy resources. 4.1. Cost Evaluating the cost of a cluster is very relevant because it affects the payments of the consumers to purchase elec- tricity. The cost of the cluster per kWh C in time interval T is computed as shown in Equation (9). The terms in the square bracket make up the net cost of the cluster in T. It consists of the total depreciation and vari- able cost of all the N energy resources in the cluster (ob- tained from Equations (1) and (2)), the cost of the yearly electricity import im C, and the benefit obtained from the yearly electricity export ex C. The total net cost is 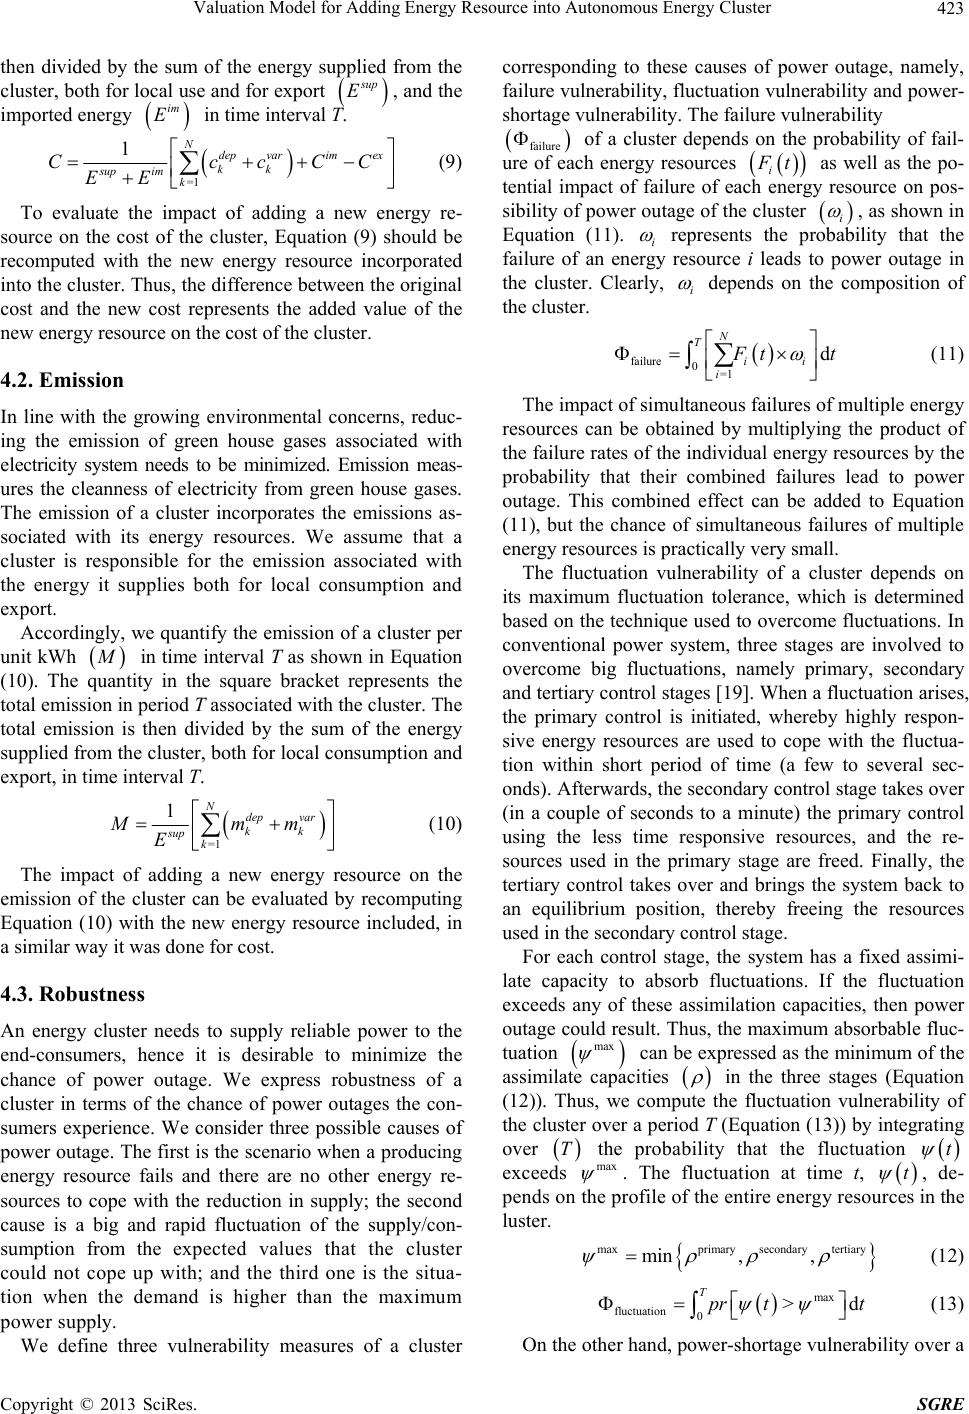 Valuation Model for Adding Energy Resource into Autonomous Energy Cluster Copyright © 2013 SciRes. SGRE 423 then divided by the sum of the energy supplied from the cluster, both for local use and for export up E, and the imported energy im E in time interval T. =1 1Ndep varimex kk supim k CccCC EE (9) To evaluate the impact of adding a new energy re- source on the cost of the cluster, Equation (9) should be recomputed with the new energy resource incorporated into the cluster. Thus, th e difference between the original cost and the new cost represents the added value of the new energy resource on the cost of the cluster. 4.2. Emission In line with the growing environmental concerns, reduc- ing the emission of green house gases associated with electricity system needs to be minimized. Emission meas- ures the cleanness of electricity from green house gases. The emission of a cluster incorporates the emissions as- sociated with its energy resources. We assume that a cluster is responsible for the emission associated with the energy it supplies both for local consumption and export. Accordingly, we quantify the emission of a cluster per unit kWh in time interval T as shown in Equation (10). The quantity in the square bracket represents the total emission in period T associated with the cluster. The total emission is then divided by the sum of the energy supplied from the cluster, both for local consumption and export, in time interval T. =1 1Ndep var kk sup k Mmm E (10) The impact of adding a new energy resource on the emission of the cluster can be evaluated by recomputing Equation (10) with the new energy resource included, in a similar way it was done for cost. 4.3. Robustness An energy cluster needs to supply reliable power to the end-consumers, hence it is desirable to minimize the chance of power outage. We express robustness of a cluster in terms of the chance of power outages the con- sumers experience. We consider three possible causes of power outage. The first is the scenario when a producing energy resource fails and there are no other energy re- sources to cope with the reduction in supply; the second cause is a big and rapid fluctuation of the supply/con- sumption from the expected values that the cluster could not cope up with; and the third one is the situa- tion when the demand is higher than the maximum power supply. We define three vulnerability measures of a cluster corresponding to these causes of power outage, namely, failure vulnerability, fluctuation vu lnerability and power- shortage vulnerability. Th e failure vulnerability failu re of a cluster depends on the probability of fail- ure of each energy resources i t as well as the po- tential impact of failure of each energy resource on pos- sibility of power outage of the clus ter i , as shown in Equation (11). i represents the probability that the failure of an energy resource i leads to power outage in the cluster. Clearly, i depends on the composition of the cluster. failure 0=1 d N T ii i tt (11) The impact of simultaneous failures of multiple energy resources can be obtained by multiplying the product of the failure rates of the individual energy resources by the probability that their combined failures lead to power outage. This combined effect can be added to Equation (11), but the chance of simultaneous failures of multiple energy resources is practically very small. The fluctuation vulnerability of a cluster depends on its maximum fluctuation tolerance, which is determined based on the technique used to overcome fluctuations. In conventional power system, three stages are involved to overcome big fluctuations, namely primary, secondary and tertiary control stages [19]. When a fluctuation arises, the primary control is initiated, whereby highly respon- sive energy resources are used to cope with the fluctua- tion within short period of time (a few to several sec- onds). Afterw ards, the secondary contro l stage takes ov er (in a couple of seconds to a minute) the primary control using the less time responsive resources, and the re- sources used in the primary stage are freed. Finally, the tertiary control takes over and brings the system back to an equilibrium position, thereby freeing the resources used in the secondary control stage. For each control stage, the system has a fixed assimi- late capacity to absorb fluctuations. If the fluctuation exceeds any of these assimilation capacities, then power outage could result. Thus, the maximum absorbable fluc- tuation max can be expressed as the minimum of the assimilate capacities in the three stages (Equation (12)). Thus, we compute the fluctuation vulnerability of the cluster over a period T (Equation (13)) by integrating over T the probability that the fluctuation t exceeds max . The fluctuation at time t, t , de- pends on the profile of the entire energy resources in the luster. maxprimary secondary tertiary min ,, (12) max fluctuation 0>d Tpr tt (13) On the other hand, power-shortage vuln erability ov er a  Valuation Model for Adding Energy Resource into Autonomous Energy Cluster Copyright © 2013 SciRes. SGRE 424 given period T can be computed by Equation (14), inte- grating over period T the probability that demand ex- ceeds supply. shortage0demand> supplyd Tprtt t (14) Finally, the overall vulnerability of the cluster is obtained by adding th e individual vulnerab ilities together (Equation (15)). Then, the overall robustness of the clus- ter is computed as the inverse of th e overall vulnerability (Equation (16)). failure fluctuation shortage (15) 1 R (16) A cluster can have a certain level of tolerance for the occurrence of power outage. For example, a single power outage per year could be tolerable in a cluster. We refer to the maximum vulnerability that is tolerated by the cluster as power outage tolerance . Thus, the condi- tion in Equation (17) should always b e maintained. < (17) When a new energy resource is added to the cluster, the values of the p arameters in Equations (11)-(16) cou ld change. For instance, the failure rate, availability, con- trollability, responsiveness and predictability of the en- ergy resource could affect the vulnerability of the cluster. Hence, the change in robustness R gives the added value of the new energy resource. 4.4. Independence A cluster may depend on the rest of the power grid for various reasons. When the imported electricity is cheaper than the local electricity supply from its own power sources, then the cluster might resort to importing elec- tricity from the rest of the power grid even though the demand can be supplied locally. We refer to this optional kind of dependency as economical dependency. On the other hand, when the local demand exceeds the maxi- mum capacity of the local supp ly, the cluster is forced to import electricity. We refer to this kind of dependency as mandatory dependency. The independence performance metric addresses the mandatory dependence of the cluster on the rest of the grid. There could be various reasons why a cluster would minimize its mandatory dependence on the rest of the power grid. For instance, if the cluster is largely depend- ent on the rest of the grid, then disturbances in the rest of the grid could have larger impact on the cluster. Accord- ingly, we represent independence as one performance indicator of a cluster. We employ two types of metrics to capture the mandatory dependence of a cluster on the rest of the grid, namely aggregate dependence and instanta- neous dependence. Aggregate dependence aggregate D refers to the volume of mandatory electricity imported from the rest of the power grid *im E over a period of time compared to the total electricity consumed in the cluster over the same period cons E, as shown in Equa- tion (18) . * aggregate im cons E DE (18) Instantaneous dependence instantaneous D captures the dependence of a cluster on the rest of the grid in terms of the instantaneous power imported. Let X be the maxi- mum mandatory instantaneous power that is imported from the rest of the grid in period T, and let Y be the av- erage power consumed in the cluster in the same period. Then, instantaneous D is computed as the ratio of the two (Equation (19)). instantaneous DY (19) The characteristics of the energy resources such as predictability, controllability, responsiveness and avail- ability affect the independence of the cluster. For exam- ple, if a cluster has more predictable energy resources, then the possible supply shortages can be predicted early enough, and hence the controllable energy resources can be appropriately managed to locally compensate the sup- ply shortage, thereby reducing dependence on the exter- nal grid. The impact of adding a new energy resource can be computed in the same fashion as it was done for the previous cluster performance indicators. 4.5. Convenience Convenience of a cluster measures the perception of the people about the suitability of the energy resources to maintain their comforts as mentioned in Section 3.8. As shown in Equation (20), the convenience of a cluster V can be obtained by summing up the individual convenience k v of all the energy resources in the cluster, that were calculated using Equation (8). Thus, the value added by adding a new energy resource can be obtained by recomputing Equation (20) with the new energy re- source incorporated in the cluster. 1 1N k k Vv N (20) 5. A Case Study In order to verify the theoretical model developed in the preceding section, we present a simplified case study. The clusters used in our case study are modeled based on the design of the green village project of the TUDelft [20]. The green village project aims at building a sus- tainable village at TUDelft campus based on green en- 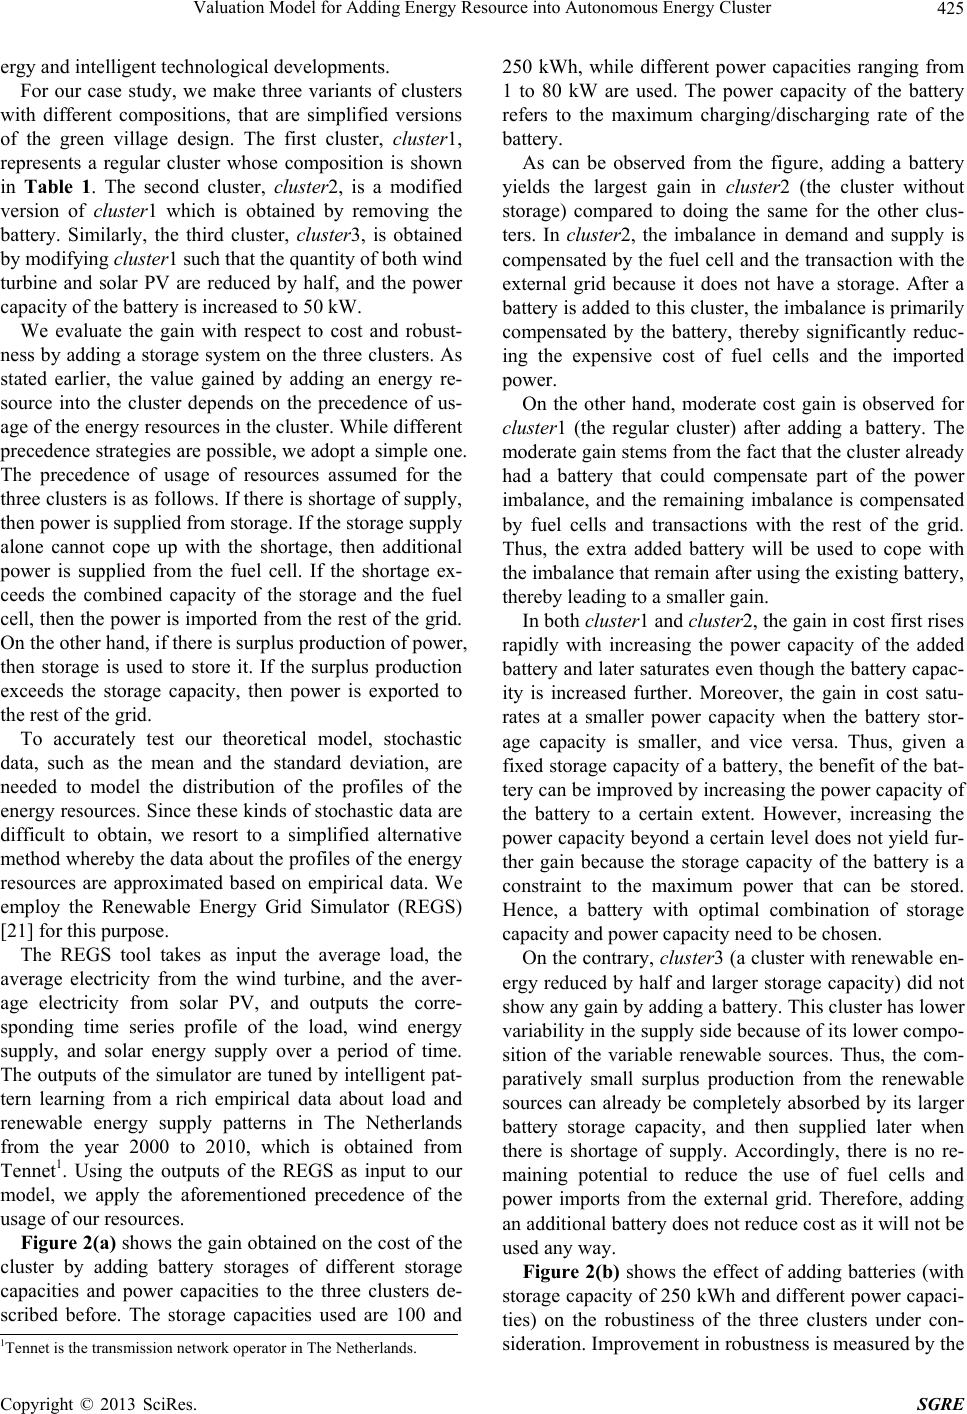 Valuation Model for Adding Energy Resource into Autonomous Energy Cluster Copyright © 2013 SciRes. SGRE 425 ergy and intelligent technological developments. For our case study, we make three variants of clusters with different compositions, that are simplified versions of the green village design. The first cluster, cluster1, represents a regular cluster whose composition is shown in Table 1. The second cluster, cluster2, is a modified version of cluster1 which is obtained by removing the battery. Similarly, the third cluster, cluster3, is obtained by modifying cluster1 such that the quantity of both wind turbine and solar PV are reduced by half, and the power capacity of the battery is increased to 50 kW. We evaluate the gain with respect to cost and robust- ness by adding a storage system on the three clusters. As stated earlier, the value gained by adding an energy re- source into the cluster depends on the precedence of us- age of the energy resources in the cluster. While different precedence strategies are possible, we adopt a simple one. The precedence of usage of resources assumed for the three clusters is as follows. If there is shortage of su pply, then power is supplied from storage. If the storage supply alone cannot cope up with the shortage, then additional power is supplied from the fuel cell. If the shortage ex- ceeds the combined capacity of the storage and the fuel cell, then the power is imported from the rest of the grid. On the other hand, if there is surplus production of power, then storage is used to store it. If the surplus production exceeds the storage capacity, then power is exported to the rest of the grid. To accurately test our theoretical model, stochastic data, such as the mean and the standard deviation, are needed to model the distribution of the profiles of the energy resources. Since these kinds of stochastic data are difficult to obtain, we resort to a simplified alternative method whereby the data about the profiles of the energy resources are approximated based on empirical data. We employ the Renewable Energy Grid Simulator (REGS) [21] for this purpose. The REGS tool takes as input the average load, the average electricity from the wind turbine, and the aver- age electricity from solar PV, and outputs the corre- sponding time series profile of the load, wind energy supply, and solar energy supply over a period of time. The outputs of the simulator are tuned by intelligent pat- tern learning from a rich empirical data about load and renewable energy supply patterns in The Netherlands from the year 2000 to 2010, which is obtained from Tennet1. Using the outputs of the REGS as input to our model, we apply the aforementioned precedence of the usage of our resources. Figure 2(a) shows the gain obtained on the cost of the cluster by adding battery storages of different storage capacities and power capacities to the three clusters de- scribed before. The storage capacities used are 100 and 250 kWh, while different power capacities ranging from 1 to 80 kW are used. The power capacity of the battery refers to the maximum charging/discharging rate of the battery. As can be observed from the figure, adding a battery yields the largest gain in cluster2 (the cluster without storage) compared to doing the same for the other clus- ters. In cluster2, the imbalance in demand and supply is compensated by the fuel cell and the transaction with the external grid because it does not have a storage. After a battery is added to this clu ster, the imbalance is primarily compensated by the battery, thereby significantly reduc- ing the expensive cost of fuel cells and the imported power. On the other hand, moderate cost gain is observed for cluster1 (the regular cluster) after adding a battery. The moderate gain stems from the fact that the cluster already had a battery that could compensate part of the power imbalance, and the remaining imbalance is compensated by fuel cells and transactions with the rest of the grid. Thus, the extra added battery will be used to cope with the imbalance that remain after using the existing battery, thereby leading to a smaller gain. In both cluster1 and cluster2, the gain in cost first rises rapidly with increasing the power capacity of the added battery and later saturates even though the battery capac- ity is increased further. Moreover, the gain in cost satu- rates at a smaller power capacity when the battery stor- age capacity is smaller, and vice versa. Thus, given a fixed storage capacity of a battery, the benefit of the bat- tery can be improved by increasing the power capacity of the battery to a certain extent. However, increasing the power capacity beyond a certain level does not yield fur- ther gain because the storage capacity of the battery is a constraint to the maximum power that can be stored. Hence, a battery with optimal combination of storage capacity and power capacity need to be chosen. On the contrary, cluster3 (a cluster with renewable en- ergy reduced by half and larger storage capacity) did not show any gain by adding a battery. This cluster has lower variability in the supply side because of its lower compo- sition of the variable renewable sources. Thus, the com- paratively small surplus production from the renewable sources can already be completely absorbed by its larger battery storage capacity, and then supplied later when there is shortage of supply. Accordingly, there is no re- maining potential to reduce the use of fuel cells and power imports from the external grid. Therefore, adding an additional battery d oes no t reduce co st as it will not be used any way. Figure 2(b) shows the effect of adding batteries (with storage capacity of 250 kWh and different power capaci- ties) on the robustiness of the three clusters under con- sideration. Improvement in robustness is measured by the 1Tennet is the transmission network operator in The Netherlands.  Valuation Model for Adding Energy Resource into Autonomous Energy Cluster Copyright © 2013 SciRes. SGRE 426 Table 1. The composition of the cluster1. Power capacity (kW) Capacity factor (%) Storage capacity (kWh) Fixed cost (€/unit) Variable cost (€/kWh) Fixed emission (kg/unit) Variable emission (kg/kWh) Monthly failure rate Cycle efficiency (%) Quantity Wind turbine 50 0.33 150,000 0 100,000 0 0.001 2 Solar PV 0.23 0.24 575 0 1000 0 0.001 160 Fuel cell 35 350,000 0.15 19,250 0 0.001 1 Battery 20 100 650 €/kWh65 €/cycle1000 kg/kWh0 0.001 99 1 Simple load 105 1 (a) (b) Figure 2. The impact of adding storage systems to the clus- ters. (a) Improvement on cost (battery capacity: 100 kWh, 250 kWh); (b) Improvement on robustness (battery capac- ity: 250 kWh). increase in the number of days it takes before occurrence of a power outage. As can be observed, adding a battery did not improve the ro bu stness of cluster3. Given the low composition of the v ariable renewable sources, the exist- ing battery can already provide enough flexibility that could be used to store the surplus productions of the re- newable sources and reuse it later to improve the robust- ness of the cluster. Hence, adding a new battery does not improve the robustness because there is no extra surplus production to store and reuse. On the other hand, adding a battery yielded larger ro- bustness improvement in cluster1 (the regular cluster) than in cluster2 (the cluster with no battery). Although this sounds counter intuitive, it can be explained as fol- lows. Batteries are used to improve robustness if they are not being used at full capacity when the events (failure, fluctuation, or power-shortage) occur in the cluster. At the occurrence of these events, the reserve capacity of the batteries can be exploited to minimize the vulnerability of the cluster. Cluster1 already has a battery, hence the probability that the newly added battery is used at full capacity is smaller. Hence, the new added battery will have larger reserve capacity that could be used to im- prove robustness of the cluster. Whereas, cluster2 did not have a battery, and thus the newly added battery is more likely to have smaller reserve capacity, thereby leading to smaller robustness improvement. The results in Figures 2(a) and (b) clearly confirm that the value gained by adding an energy resource to a cluster depends on the composition of the cluster, as well as the precedence of the usage of its energy resources. Thus, our proposed valuation model enables the operator of the cluster to wisely choose the appropriate energy resources that could be added to achieve the desired per- formance improvement. Similar simulations could be re- peated with the other performance indicators of the clus- ter. 6. Discussions and Conclusions In this paper, we have developed a valuation model for evaluating the value gained by adding an energy resource into an autonomous energy cluster. Our model presents a characterization of energy resources using wide range of parameters, namely cost, emission, failure rate, predict-  Valuation Model for Adding Energy Resource into Autonomous Energy Cluster Copyright © 2013 SciRes. SGRE 427 ability, availability, controllability, responsiveness, and -convenience. Moreover, comprehensive set of perform- ance indicators of a cluster, that relate to environmental, economical and social values, are considered and model- ed. Based on this model, the impacts of adding an energy resource into a cluster is analyzed. We also presented a case study to test our proposed theoretical model which endorsed the strength of the model to evaluate the value an energy resource adds to a cluster. Our model also re- veals that the value added by an energy resource depends both on the composition of the cluster and the precedence of the usage of energy resources in the cluster. Developing appropriate stochastic data that better cap- ture the behaviors of the energy resources could help to analyze the benefits of the valuation model more thor- oughly. Further, more realistic and synthetic test cases could be employed to evaluate the proposed valuation mo- del. Our proposed valuation model can be used as a basis to design optimal composition of a cluster, whereby cer- tain energy resources are added to or removed from the cluster depending on their impact on the desirable per- formance indicators. REFERENCES [1] OECD/IEA, “Medium-Term Renewable Energy Market Report,” 2012. http://www.iea.org/Textbase/npsum/MTrenew2012SUM. pdf [2] International Energy Agency, “Distributed Generation in Liberalized Electricity Markets,” 2002. http://gasunie.eldoc.ub.rug.nl/FILES/root/2002/3125958/ 3125958.pdf [3] N. Hatziargyriou, N. Jenkins, G. Strbac, J. A. P. Lopes, J. Ruela and A. Engler, “MICROGRIDS—Large Scale In- tegration of Micro-Generation to Low Voltage Grids,” CIGRE C6-309, Paris, 2006. [4] European Parliament, “All New Buildings to Be Zero Energy from 2019,” Committee on Industry, Research and Energy, Brussels, 2009. http://www.europarl.europa.eu/sides/getDoc.do?language =en&type=IM-PRESS&reference=20090330IPR52892 [5] IEA-ETSAP and IRENA, “Electricity Storage Technol- ogy,” 2012. http://www.irena.org/DocumentDownloads/Publications/I RENA-ETSAP%20Tech%20Brief%20E18%20Electricity -Storage.pdf [6] D. Kottick, M. Blau and D. EEdelstein, “Battery Energy Storage for Frequency Regulation in an Island Power System,” IEEE Transactions on Energy Conversion, Vol. 8, No. 3, 1993, pp. 455-459. doi:10.1109/60.257059 [7] G. Mulder, F. D. Ridder and D. Six, “Electricity Storage for Grid-connected Household Dwellings with PV Pan- els,” Solar Energy, Vol. 84, 2010, pp. 1284-1293. doi:10.1016/j.solener.2010.04.005 [8] P. F. Ribeiro, B. K. Johnson, M. L. Crow, A. Arsoy and Y. Liu, “Energy Storage Systems for Advanced Power Applications,” Proceedings of the IEEE, Vol. 89, No. 12, December 2001, pp. 1744-1756. doi:10.1109/5.975900 [9] E. Negeri and N. Baken, “Distributed Storage Manage- ment Using Dynamic Pricing in a Self-Organized Energy Community,” Self-Organizing Systems, Springer, Berlin Heidelberg, 2012, pp. 1-12. [10] International Energy Agency, “Technology Roadmap: Electric and Plug-In Hybrid Electric Vehicles,” 2011. http://www.iea.org/publications/freepublications/publicati on/EV_PHEV_Roadmap.pdf [11] J. P. Lopes, F. J. Soares and P. R. Almeida, “Integration of Electric Vehicles in the Electric Power System,” Pro- ceedings of the IEEE, Vol. 99, No. 1, 2011, pp. 168-183. doi:10.1109/JPROC.2010.2066250 [12] E. Negeri and N. Baken, “Smart Integration of Electric Vehicles in an Energy Community,” Proceedings of the 1st International Conference on Smart Grids and Green IT Systems, Porto, Portugal, SciTePress, 2012, pp. 25-32. [13] H. Farhangi, “The Path of the Smart Grid,” IEEE Power and Energy Magazine, Vol. 8, No. 1, 2010, pp. 18-28. doi:10.1109/MPE.2009.934876 [14] Y.X. Yu and W. Luan. “Smart Grid and Its Implementa- tions,” Proceedings of the CSEE, Vol. 29, No. 34, 2009, pp. 1-8. [15] K. Dielmann and A. van der Velden, “Virtual Power Plants (VPP)—A New Perspective for Energy Genera- tion?” Proceedings of the 9th International Scientific and Practical Conference on Modern Techniques and Tech- nologies, April 2003, pp. 18-20. [16] F. Provoost, J. Myrzik and W. Kling, “Setting Up Autonomous Controlled Networks,” 39th International Universities Power Engineering Conference (UPEC), Vol. 3, 2004, pp. 1190-1194. [17] E. Negeri, N. Baken and M. Popov, “Holonic Architec- ture of the Smart Grid,” Smart Grid and Renewable En- ergy, Vol. 4, No. 2, 2013, pp. 202-212. doi:10.4236/sgre.2013.42025 [18] A. Alarcon-Rodriguez, G. Ault and S. Galloway, “Multi- Objective Planning of Distributed Energy Resources: A Review of the State-of-the-Art,” Renewable and Sustain- able Energy Reviews, Vol. 14, No. 5, 2010, pp. 1353- 1366. doi:10.1016/j.rser.2010.01.006 [19] J. B. machowski, “Power System Dynamics: Stability and Control,” Wiley, Hoboken, USA, 2011. [20] A. Van Wijk, “Welcome to the Green Village,” IOS Press, Delft 2013. http://www.thegreenvillage.org [21] The Renewable Energy Grids Simulator Tool. http://arnekaas.nl/REGS/?id=1
|