 Vol.4, No.8A, 9-15 (2013) Agricultural Sciences http://dx.doi.org/10.4236/as.2013.48A002 A framework for the use of decision-support tools at various spatial scales for the management of irrigated agriculture in West-Africa Joost Wellens1,2*, Farid Traoré3, Mamadou Diallo4, Bernard Tychon2 1Association pour la Promotion de l’Education et de la Formation à l’Etranger (APEFE), Brussels, Belgium; *Corresponding Author: Joost.Wellens@gmail.com 2Département Sciences et Gestion de l’Environnement, Université de Liège, Arlon, Belgium 3Institut de l’Environnement et de Recherche Agricole (INERA), Ouagadougou, Burkina Faso 4Observatoire de l’Eau, Bobo-Dioulasso, Burkina Faso Received 26 May 2013; revised 27 June 2013; accepted 16 July 2013 Copyright © 2013 Joost Wellens et al. This is an open access article distributed under the Creative Commons Attribution License, which permits unrestricted use, distribution, and reproduction in any medium, provided the original work is properly cited. ABSTRACT The Kou watershed, situated in the Southwest- ern part of Burkina Faso, has succumbed since a couple of decades in a typical theater play of anarchistic water management. With its 1800 km², this small watershed holds the second larg- est city of Burkina Faso (Bobo-Dioulasso), a for- mer State ran irrigated rice scheme and several informal agricultural zones. Despite the abun- dance on water resourc es, most water users find themselves regularly facing to water shortages due to an increase in population and low irriga- tion efficiencies. Local stakeholders are hence in need of easy-to-use and low-cost decision support tool s for the mo nitoring and exploi t ation of the water resources at different spatial and user levels. A top-to-bottom string of adapted water management tools has been successfully installed to tackle the problems: from w atershed (top) to field level (bottom), passing by the 1200 ha irrigation scheme. Land use maps have been derived from time-series of free satellite images. Combined with data from a network of hydro- logic gauging stations, regional water use maps were established. SIMIS was put in place for the public-private management of the regions irri- gated rice scheme. Day to day water use on ir- rigated plots was followed by soil humidity and crop canopy measurements. A simple field-crop- water balance model Aqua Crop was used by extension workers to draft optimal irrigation charts. Each tool was applied independently, re- quiring only limited data; but their combined results contributed to an improved integrated water management. Keyw ords: Irrigation; Remote Sensing; Multi-Level; Decision-Support Tool 1. INTRODUCTION By 2030 irrigated land is predicted to increase by 28% [1]. In sub-Saharan Africa rapid population growth, cou- pled with recurring droughts, has led to a renewed call for irrigation development [2]. In Burkina Faso alone, the State has introduced several water and agriculture related programs. Water is from now on to be managed at a watershed level, and big State funded irrigation sch- emes are to raise their productivity and efficiency, and where water is available smallholder irrigation initiatives are being promoted. In such a situation water manage- ment becomes complex because it involves various spa- tial scales, multiple stakeholders and varying go als. Stud- ies exist on multi-user and multi-level water management using integrated computer models [3,4], but they require most often highly skilled operators and vast amounts of data; both are not easily available everywhere. Local stakeholders in Burkina Faso needed easy-to- use and low-cost decision support tools for the monitor- ing and exploitation of their water resources at different user and spatial levels: 1) for watershed agencies at re- gional level, 2) for water user associations at irrigation scheme level and 3) for extension services at field level. This study shows how different tools have been devel- oped or adapted to tackle water management problems at different scales or levels, and how th eir combined results contribute to an integrated water management approach. Copyright © 2013 SciRes. OPEN A CCESS  J. Wellens et al. / Agricultural Sciences 4 (2013) 9-15 10 2. STUDY AREA The Kou watershed, situated in the Southwestern part of Burkina Faso, is relative rich on water resources due to several sources and a perennial water course. Unfor- tunately these resources are increasingly being solicited by a rapidly growing irrigation demand, due to an in- crease in population and low irrigation efficiencies. The main irrigation water users are presented in Fig- ure 1. In the upstream regions, river banks and low lands are occupied by informal irrigated agriculture. The occu- pied surface has been estimated at 864 ha [5]. Water is directly diverted, siphoned or pumped for basin or fur- row irrigation to a vast patchwork of smallholder plots. No water regulation exists in these parts, the most up- stream user is first and best served. More downstream is the 1200 ha irrigation scheme named the “Kou Valley” established in 1973. Since 1993 structural adjustment programs (SAPs) forced the management of the scheme by State officials to be hastily transferred to a new and inexperienced Water Users Association (WUA). Mainte- nance works declined, yields started falling and an in- crease in upstream water use made it harder to meet the overall water needs, resulting in almost a quarter of the farmers abandoning their plots. 3. MATERIALS AND METHODS 3.1. Regional Level In order to monitor regional irrigation, available water resources and agricultural water use need to be observed and compared. The available water resources are since Figure 1. Scheme of the watershed’s water users; with the available water resources, demands and extractions. (a) 286 ha [5, 31 ,3 4]; ( b) 578 h a and 53% irrigated by river diversion [ 5, 31 , 34]. longtime being followed by a national network of hy- drometric gauging stations (Figure 1). As for agricultural water use, a map of the irrigated areas was needed. Several mapping studies exists using remote sensing, however few studies have focused on the complex sub- Saharan landscape. Irrigated agriculture in tropical sub- Saharan Africa is characterized by highly fragmented smallholder plots with average sizes of 0.5 ha, seldom exceeding 1 ha. In a such a context high-resolution im- ages (Quickbird, Ikonos) are most appropriate, since the size of the fields are easily 3 - 4 times greater than the pixel size of the satellite image [6]. But such data are costly and not always available [7]. Hence a low-cost remote sensing method based on Landsat images was developed. Although freely available, the 30 m resolution Landsat images bring with them the problem of mixels. These are pixels that contain information about more than on type of ground cover [8] and are usually important sources of inaccuracy in image classifications [9]. However, when several images of the study area taken at different times are available, it is possible to use the information pro- vided at each time to improve the classification of each image using multi-te mporal analysis meth ods. The multi- temporal analysis of classified images has great potential for identifying irrigated areas [10,11]. Change detection is the process of identifying differ- ences in the state of an object or phenomenon by ob- serving it at different times. The change detection analy- sis technique for this study focused on a pixel-by-pixel post-classification comparison. This method generates a complete matrix of pixel trajectories for a series of clas- sified images. Expert knowledge-based classification (or post-classification) was used to allow anomalies in a given pixel trajectory to be studied for the entire series of images [12]. All images were spatially and radiometrically cor- rected, in the first stage a maximum-likelihood classifi- cation (MLC) was applied. Classification assessment was determined by the overall accuracy (percentage) and Kappa coefficients of the error matrix [13,14]. Whatever the results of MLCs, they are still prone to error because of noises due to similarities of the spectral responses of certain land cover categories [15]. The MCL process was followed by change detection analysis. Change detection analysis enabled to detect trajectories unlikely to be ob- served in reality in the study region. For example, be- cause of the marked intensification of agriculture, it was unusual to see a transition of irrigated cropland towards rangeland or natural vegetation. Simple rules for pixel trajectory correction were defined: 1) A pixel of natural vegetation can evolve towards rangeland or crops, or it can retain its original state. 2) A pixel of rangeland can evolve towards crops or Copyright © 2013 SciRes. OPEN A CCESS  J. Wellens et al. / Agricultural Sciences 4 (2013) 9-15 11 retain its original state; evolution towards natural vegetation is fairly unlik ely. 3) A pixel of crops can retain only its original status. Evolution towards natural vegetation is unlikely be- cause of the pressure on agricultural land. Once the pixel trajectories are corrected, the post- classification images are assessed again based on the overall accuracy and Kappa coefficients. 3.2. Irrigation Scheme Level To tackle the water management problems of the Kou Valley’s WUA, a public-private partnership (PPP), based on the “outsour cing through service or manag ement con- tracts” model [16], was established. State officials, a pri- vate operator specialized in water management (Obser- vatoire de l’Eau) and a technical assistance, funded by the Association pour la Promotion de l’Educationet d e la Formation à l’Etranger (APEFE) and Wallonie-Bruxelles International (WBI), joined forces. Technical studies were conducted to assess the water problems, including: mapping the scheme and creating a database, monitoring land use and evaluating the water distribution through a set of efficiency parameters [17]. The analysis of the scheme’s land occupations and performance indicators clearly demonstrated the need for a decision-support too l to achieve a more equitable water distribution [18]. Lozano and Mateos [19] show amongst a list of decision-support tools, that SIMIS is a useful tool for irrigation scheme management, especially when fixed rotation is used to achieve equity during peak pe- riods. SIMIS is the FAO decision support-tool for irriga- tion scheme management [20,21]. Throughout the study, public awareness and participa- tory work sessions were organized. Based on the varied soil characteristics (filtering sandy or heavy clayish) and the scheme’s two most cultivated crops, paddy rice and maize, different management scenarios were presented. At all times, farmers were encouraged to express their opinions and the various scenarios were fine-tuned ac- cordingly. The WUA finally adopted a deficit irrigation [22] based scenario: land use was optimized by taking account of the different soil types (maize on sandy soils and rice on clayish soils) with paddy rice under deficit irrigation. At the end of each jointly managed irrigation season, an evaluation was carried out. Proposed vs actual land use and proposed vs observed discharges at the head of the different secondary canals were presented to the WUA. Farmers talked about encountered difficulties and recommendations were made for the following irrigated season. 3.3. Field Level FAO has developed AquaCrop, a field-crop-water- productivity simulatio n for use as a decision support-tool in planning and analysis [23,24]. It uses a relatively small number of parameters to be adjusted according to case and crop. Often intuitive default input-parameters that can be determined using simple methods [25] are sufficient. Elaborating efficient irrigation schedules merely on the basis of individual field research is rather difficult and time consuming. Crop water productivity models, such as AquaCrop , offer a more than convenien t solution [26]. Once calibrated and validated, adapted irrigation schedules can be elaborated. AquaCrop has been assessed on several cabbage fields in the region [27]. Few field data were required. Weather and soil data were provided by the respective competent State agencies. Irrigation calendars were registered. The gravimetric soil water content was measured weekly in layers of each 0.2 m thick up to a depth of 0.6 m. These measurements were repeated in three replications per treatment and served to evaluate the soil water balance simulation. All supplementary needed crop data were derived on each field by taking weekly tens of overhead photos at 2 m above the canopy cover [28]. Irrigation calendars were developed to give farmers simple guidelines on how to adjust their irrigation during the growing season. For the design of irrigation calen- dars, the irrigation application depth is often considered as fixed. Fixed application depths in combination with a variable irrigation interval result in an efficient use of the irrigation water [29]. For simplicity and to promote adoption by farmers, the number of irrigation scheduling calendars should be kept to a minimum. This requires some generalization. Irrigation calendars for each crop are normally determined for two planting dates, for the major soils and perhaps for two different initial soil wa- ter contents at the beginning of the irrigation season [30]. 4. RESULTS AND DISCUSSION 4.1. Regional Results A Landsat-4 TM (taken on 5 May 1988), a Landsat-7 ETM (20 April 2000) and a Landsat-5 TM (24 June 20 0 9) were used. Vegetation was divided into three main class- es: farmland (irrigated crops class); rangeland (pasture class); and trees and shrubs (natural vegetation class). The variety of crops, the small size of plots and the im- agery resolution (30 m) did not allow more detailed sub- classes, but this was quite sufficient for the purpose of the study. Thanks to post-processing, classification accu- racies grew from 85% - 92% to 95% - 98% [31]. The study showed that irrigated areas have increased by almost 70% in 20 years, particularly during the past 10 years. As reported by Ouédraogo [32], most of range- lands converted to irrigated farmlands because of an Copyright © 2013 SciRes. OPEN A CCESS  J. Wellens et al. / Agricultural Sciences 4 (2013) 9-15 12 influx of migrants from regions with poorer access to water. The falling costs of farm equipment (pumps) and the popularity of some high-yielding crops such a banana also explained the increase in cultivated land. Figure 1 links available water resources, estimated water use (difference between 2 gauging stations) and estimated water need [33]. A standard gross water need of 1 l/s/ha was assumed [34]. It is evident that in a gen- eral way all upstream irrigation is highly inefficient, in some regions water use is twice the water need. A situa- tion that weighs heavily on the downstream irrigation scheme who faces chronic water shortages. Additional hydrometric stations are being installed to guarantee a complete coverage of the region. This method of retrieving information is particularly useful in developing countries where lack of information is a major constraint to the efficient management of natural resources. It is also best suited to these countries, because it applies a low-cost and easy-to-understand process for monitoring expansion and water use of irri- gated crops. 4.2. Irrigation Scheme Results Detailed irrigation calendars were elaborated using SIMIS, a water distribution was proposed from head- work to parcel level (Figure 2). Important was the in- stallation of “discharge legends” (Figure 3) next to the hydrometric scales at the head of each secondary canal, giving the farmers an idea of the water being consumed by the different secondary canals and hence stimulating control based on peer pressure [35]. An evaluation of the PPP was carried out. Land use was surveyed. Discharges at the head of each secondary were monitored daily and a survey was conducted to assess farmers’ satisfaction with the PPP. Some impro- vement was noted, but none of the changes was signifi- cantly different from the ex-ante situation [18]. More farmers had access to water, though not all needs were met. In general, the more equitable water distribution was respected, but much work remains to be done. How- ever in a place where water is becoming scarcer, a further decline in water management was avoided. A substantial proportion of the scheme’s farming population (198 out of 1291 plot owners) was probed upon their satisfaction. With 90%, the overall response was very positive and most are willing to continue to participate in this PPP-based management scheme. Al- most a quarter said they’ve seen an improvement in their livelihood because of better water distribution, but none said with how much. 4.3. Field Results Figure 4 shows, as an example, simulated and ob- Figure 2. Proposed discharge file card; with equitable dis- charge in green. Figure 3. Example of an irrigation distribution calendar (www.ge-eau.org/simis.html). Copyright © 2013 SciRes. OPEN A CCESS 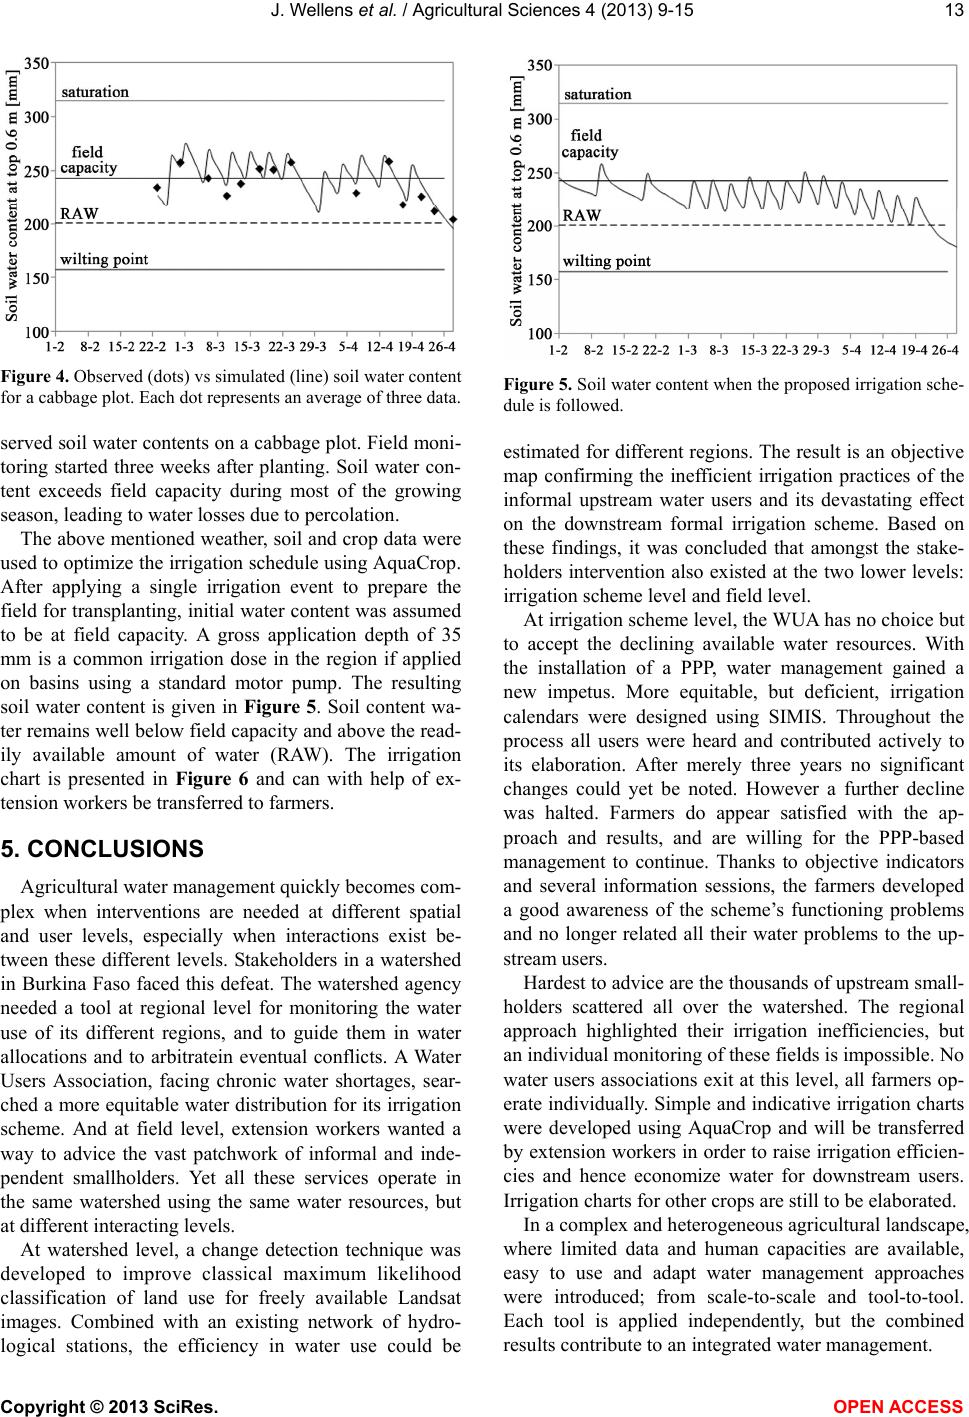 J. Wellens et al. / Agricultural Sciences 4 (2013) 9-15 13 Figure 4. Observed (dots) vs simulated (line) soil water content for a cabbage plot. Each dot represents an average of three data. served soil water contents on a cabbage plot. Field moni- toring started three weeks after planting. Soil water con- tent exceeds field capacity during most of the growing season, leading to water losses due to percolation . The above mentioned weather, soil and crop data were used to optimize the irrigation schedule using AquaCrop. After applying a single irrigation event to prepare the field for transplanting, initial water content was assumed to be at field capacity. A gross application depth of 35 mm is a common irrigation dose in the region if applied on basins using a standard motor pump. The resulting soil water content is given in Figure 5. Soil content wa- ter remains well below field capacity and above the read- ily available amount of water (RAW). The irrigation chart is presented in Figure 6 and can with help of ex- tension workers be transferred to farmers. 5. CONCLUSIONS Agricultural water management quickly becomes com- plex when interventions are needed at different spatial and user levels, especially when interactions exist be- tween these different levels. Stakeholders in a watershed in Burkina Faso faced this defeat. The watershed agency needed a tool at regional level for monitoring the water use of its different regions, and to guide them in water allocations and to arbitratein eventual conflicts. A Water Users Association, facing chronic water shortages, sear- ched a more equitable water distribution for its irrigatio n scheme. And at field level, extension workers wanted a way to advice the vast patchwork of informal and inde- pendent smallholders. Yet all these services operate in the same watershed using the same water resources, but at different interacting levels. At watershed level, a change detection technique was developed to improve classical maximum likelihood classification of land use for freely available Landsat images. Combined with an existing network of hydro- logical stations, the efficiency in water use could be Figure 5. Soil water content when the proposed irrigation sche- dule is followed. estimated for different regions. The result is an objective map confirming the inefficient irrigation practices of the informal upstream water users and its devastating effect on the downstream formal irrigation scheme. Based on these findings, it was concluded that amongst the stake- holders intervention also existed at the two lower levels: irrigation scheme level and field level. At irrigation scheme level, the WUA has no choice but to accept the declining available water resources. With the installation of a PPP, water management gained a new impetus. More equitable, but deficient, irrigation calendars were designed using SIMIS. Throughout the process all users were heard and contributed actively to its elaboration. After merely three years no significant changes could yet be noted. However a further decline was halted. Farmers do appear satisfied with the ap- proach and results, and are willing for the PPP-based management to continue. Thanks to objective indicators and several information sessions, the farmers developed a good awareness of the scheme’s functioning problems and no longer related all their water problems to the up- stream users. Hardest to advice are the thousands of upstream small- holders scattered all over the watershed. The regional approach highlighted their irrigation inefficiencies, but an individual monitoring of these fields is impossible. No water users associations exit at this level, all farmers op- erate individually. Simple and indicative irrigation charts were developed using AquaCrop and will be transferred by extension workers in order to raise irrigation efficien- cies and hence economize water for downstream users. Irrigation charts for other crops are still to be elaborated. In a complex and heterogeneous agricultural landscape, where limited data and human capacities are available, easy to use and adapt water management approaches were introduced; from scale-to-scale and tool-to-tool. Each tool is applied independently, but the combined esults contribute to an integrated water management. r Copyright © 2013 SciRes. OPEN A CCESS  J. Wellens et al. / Agricultural Sciences 4 (2013) 9-15 Copyright © 2013 SciRes. 14 Figure 6. Example of an irrigation chart for cabbage cultivated in the region of Bobo-Dioulasso on a clayish soil. In response to a request from the Ministry of Agricul- ture of Burkina Faso, this approach is also being intro- duced in other watersheds in the regions of Banfora and Mogtedo. 6. ACKNOWLEDGEMENTS OPEN A CCESS This study is part of a larger project entitled “Structural strengthen- ing of the management capacity of water resources for agriculture by means of decision support tools (Burkina Faso)” (see www.ge-eau.org). The authors gratefully acknowledge the funding for this project pro- vided by “Association pour la Promotion de l’Education et de la For- mation à l’Etranger” (APEFE) and “Wallonie-Bruxelles International” (WBI). REFERENCES [1] FAO (2002) World agriculture: Towards 2015/2030. Food and Agriculture Organization, Rome. [2] Urama K.C. (2005) Land-use intensification and envi- ronmental degradation: Empirical evidence form irrigated and rain-fed farms in south eastern Nigeria. Journal of Environmental Management, 75, 199-217. [3] Victoria, F.B., ViegasFilho J.S., Pereira, L.S., Teixeira, J.L. and Lanna, A.E. (2005) Multi-scale modelling for water resources planning and management in rural basins. Agricultural Water Management, 77, 4-20. dx.doi.org/10.1016/j.agwat.2004.09.037 [4] Bergez, J.E., Leenhardt, D., Colomb, B., Dury, J., Car- pani, M., Casagrande, M., Charron, M.H., Guillaume, S., Therond, O. and Willaume, M. (2012) Computer-model tools for a better ag ricultural water management: Tackling managers’ issues at different scales—A contribution form systemic agronomists. Computer and Electronics in Ag- riculture, 86, 89-99. dx.doi.org/10.1016/j.compag.2012.04.005 [5] Wellens, J., Sawadogo, I., Diallo, M., Dakouré, D., Com- paoré, N.F., Traoré, F. and Tychon, B. (2007) Recen- sement exhaustif des activités hydro-agricoles du Bassin du Kou. http://www.ge-eau.org/recensement.html [6] Lillesand, T.M., Kiefer, R.W. and Chipman, J.W. (2004) Remote sensing and image interpretation. Wiley, New York. [7] Wellens, J., Midekor , A., Traore, F. and Tychon, B. (2013) An easy and low-cost method for preprocessing and matching small-scale amateur aerial photography for as- sessing agricultural land use in Burkina Faso. Interna- tional Journal of Applied Earth Observation and Geoin- formation, 23, 273-278. dx.doi.org/10.1016/j.jag.2012.09.007 [8] Foody, G. M. (2004) Estimation sub-pixel land cover clas- sification accuracy assessment. Remote Sensing of Envi- ronment, 26, 469-478. [9] Wang, Z., Hu, G. and Yao, S. (2007) Decomposition mixed pixel of remote sensing image based on tray neural network model. In: Kang, L., Liu, Y. and Zeng, S., Eds., Advances in Computation and Intelligence, Springer, Heidelberg, 305-309. dx.doi.org/10.1007/978-3-540-74581-5_33 [10] Ozdogan, M. and Gutman, G. (2008) A new methodology to map irrigated areas using multi-temporal MODIS and ancillary data: An application example in the continental US. Remote Sensing of Environment, 112, 3520-3537. dx.doi.org/10.1016/j.rse.2008.04.010 [11] Heller, E., Rhemtulla, J.M., Lele, S., Kalacska, M., Ba di- ger, S., Sengupta, R. and Ramankutty, N. (2012) mapping crop types, irrigated areas, and cropping intensities in heterogeneous landscapes of southern India using multi- temporal medium-resolution imagery: Implications for assessing water use in agriculture. Photogrammetric En- gineering and Remote Sensing, 78, 815-827. [12] Zhou, Q., Li, B. and Sun, B. (2008) Modelling spatio- temporal pattern of landuse change using multitemporal remotely sensed imagery. ISPRS Congress Beijing, 3-1 1 July 2008, Beijing, 729-734. [13] Foody, G.M. (2002) Status of land cover classification accuracy assess ment. Remote Sensing of Environment, 80, 185-201. dx.doi.org/10.1016/S0034-4257(01)00295-4 [14] Congalton, R.G. and Green, K. (2009) Assessing the ac- curacy of remotely sensed data: Principles and practices. CRC/Taylor & Francis, Boca Raton. [15] Manandhar, R., Odeh, I. and Ancev, T. (2009) Improving the accuracy of land use and land cover classification of landsat data using post-classification enhancement. Re- mote Sensing, 1, 330-344.dx.doi.org/10.3390/rs1030330 [16] World Bank (2007) Emerging Public-private partnerships in irrigation development and management. Water Sector Board Discussion Paper Series, Paper No. 10, The World Bank, Washington DC. 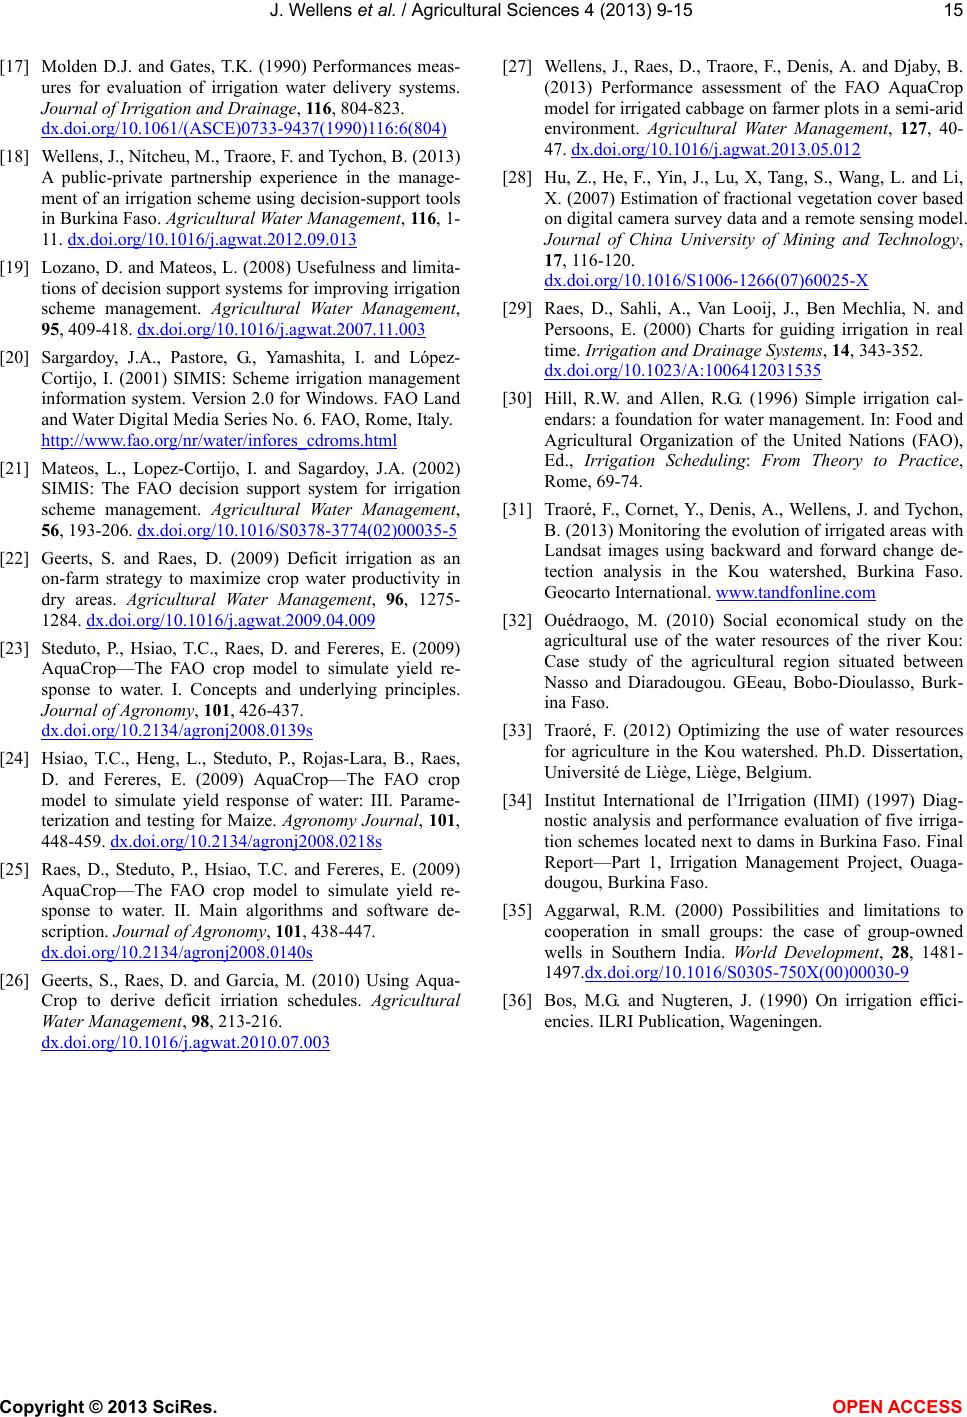 J. Wellens et al. / Agricultural Sciences 4 (2013) 9-15 15 [17] Molden D.J. and Gates, T.K. (1990) Performances meas- ures for evaluation of irrigation water delivery systems. Journal of Irrigation and Drainage, 116, 804-823. dx.doi.org/10.1061/(ASCE)0733-9437(1990)116:6(804) [18] Wellens, J., Nitcheu, M., Traore, F. and Tychon, B. (2013) A public-private partnership experience in the manage- ment of an irrigation scheme using decision-support tools in Burkina Faso. Agricultural Water Management, 116, 1- 11. dx.doi.org/10.1016/j.agwat.2012.09.013 [19] Lozano, D. and Mateos, L. (2008) Usefulness and limita- tions of decision support systems for improving irrigation scheme management. Agricultural Water Management, 95, 409-418. dx.doi.org/10.1016/j.agwat.2007.11.003 [20] Sargardoy, J.A., Pastore, G., Yamashita, I. and López- Cortijo, I. (2001) SIMIS: Scheme irrigation management information system. Ve rsion 2.0 for Windows. FAO Land and Water Digital Media Series No. 6. FAO, Rome, Italy. http://www.fao.org/nr/water/infores_cdroms.html [21] Mateos, L., Lopez-Cortijo, I. and Sagardoy, J.A. (2002) SIMIS: The FAO decision support system for irrigation scheme management. Agricultural Water Management, 56, 193-206. dx.doi.org/10.1016/S0378-3774(02)00035-5 [22] Geerts, S. and Raes, D. (2009) Deficit irrigation as an on-farm strategy to maximize crop water productivity in dry areas. Agricultural Water Management, 96, 1275- 1284. dx.doi.org/10.1016/j.agwat.2009.04.009 [23] Steduto, P., Hsiao, T.C., Raes, D. and Fereres, E. (2009) AquaCrop—The FAO crop model to simulate yield re- sponse to water. I. Concepts and underlying principles. Journal of Agronomy, 101, 426-437. dx.doi.org/10.2134/agronj2008.0139s [24] Hsiao, T.C., Heng, L., Steduto, P., Rojas-Lara, B., Raes, D. and Fereres, E. (2009) AquaCrop—The FAO crop model to simulate yield response of water: III. Parame- terization and testing for Maize. Agronomy Journal, 101, 448-459. dx.doi.org/10.2134/agronj2008.0218s [25] Raes, D., Steduto, P., Hsiao, T.C. and Fereres, E. (2009) AquaCrop—The FAO crop model to simulate yield re- sponse to water. II. Main algorithms and software de- scription. Journal of Agronomy, 101, 438-447. dx.doi.org/10.2134/agronj2008.0140s [26] Geerts, S., Raes, D. and Garcia, M. (2010) Using Aqua- Crop to derive deficit irriation schedules. Agricultural Water Management, 98, 213-216. dx.doi.org/10.1016/j.agwat.2010.07.003 [27] Wellens, J., Raes, D., Traore, F., Denis, A. and Djaby, B. (2013) Performance assessment of the FAO AquaCrop model for irrigated cabbage on farmer plots in a semi-arid environment. Agricultural Water Management, 127, 40- 47. dx.doi.org/10.1016/j.agwat.2013.05.012 [28] Hu, Z., He, F., Yin, J., Lu, X, Tang, S., Wang, L. and Li, X. (2007) Estimation of fractional vegetation cover based on digital camera survey data and a remote sensing model. Journal of China University of Mining and Technology, 17, 116-120. dx.doi.org/10.1016/S1006-1266(07)60025-X [29] Raes, D., Sahli, A., Van Looij, J., Ben Mechlia, N. and Persoons, E. (2000) Charts for guiding irrigation in real time. Irrigation and Drainage Systems, 14, 343-352. dx.doi.org/10.1023/A:1006412031535 [30] Hill, R.W. and Allen, R.G. (1996) Simple irrigation cal- endars: a foundation for water management. In: Food and Agricultural Organization of the United Nations (FAO), Ed., Irrigation Scheduling: From Theory to Practice, Rome, 69-74. [31] Traoré, F., Cornet, Y., Denis, A., Wellens, J. and Tychon, B. (2013) Monitoring the evolution of irrigated areas with Landsat images using backward and forward change de- tection analysis in the Kou watershed, Burkina Faso. Geocarto International. www.tandfonline.com [32] Ouédraogo, M. (2010) Social economical study on the agricultural use of the water resources of the river Kou: Case study of the agricultural region situated between Nasso and Diaradougou. GEeau, Bobo-Dioulasso, Burk- ina Faso. [33] Traoré, F. (2012) Optimizing the use of water resources for agriculture in the Kou watershed. Ph.D. Dissertation, Université de Liège, Liège, Belgium. [34] Institut International de l’Irrigation (IIMI) (1997) Diag- nostic analysis and performance evalua tion of five irriga- tion schemes located next to dams in Burkina Faso. Final Report—Part 1, Irrigation Management Project, Ouaga- dougou, Burkina Faso. [35] Aggarwal, R.M. (2000) Possibilities and limitations to cooperation in small groups: the case of group-owned wells in Southern India. World Development, 28, 1481- 1497.dx.doi.org/10.1016/S0305-750X(00)00030-9 [36] Bos, M.G. and Nugteren, J. (1990) On irrigation effici- encies. ILRI Publication, Wageningen. Copyright © 2013 SciRes. OPEN A CCESS
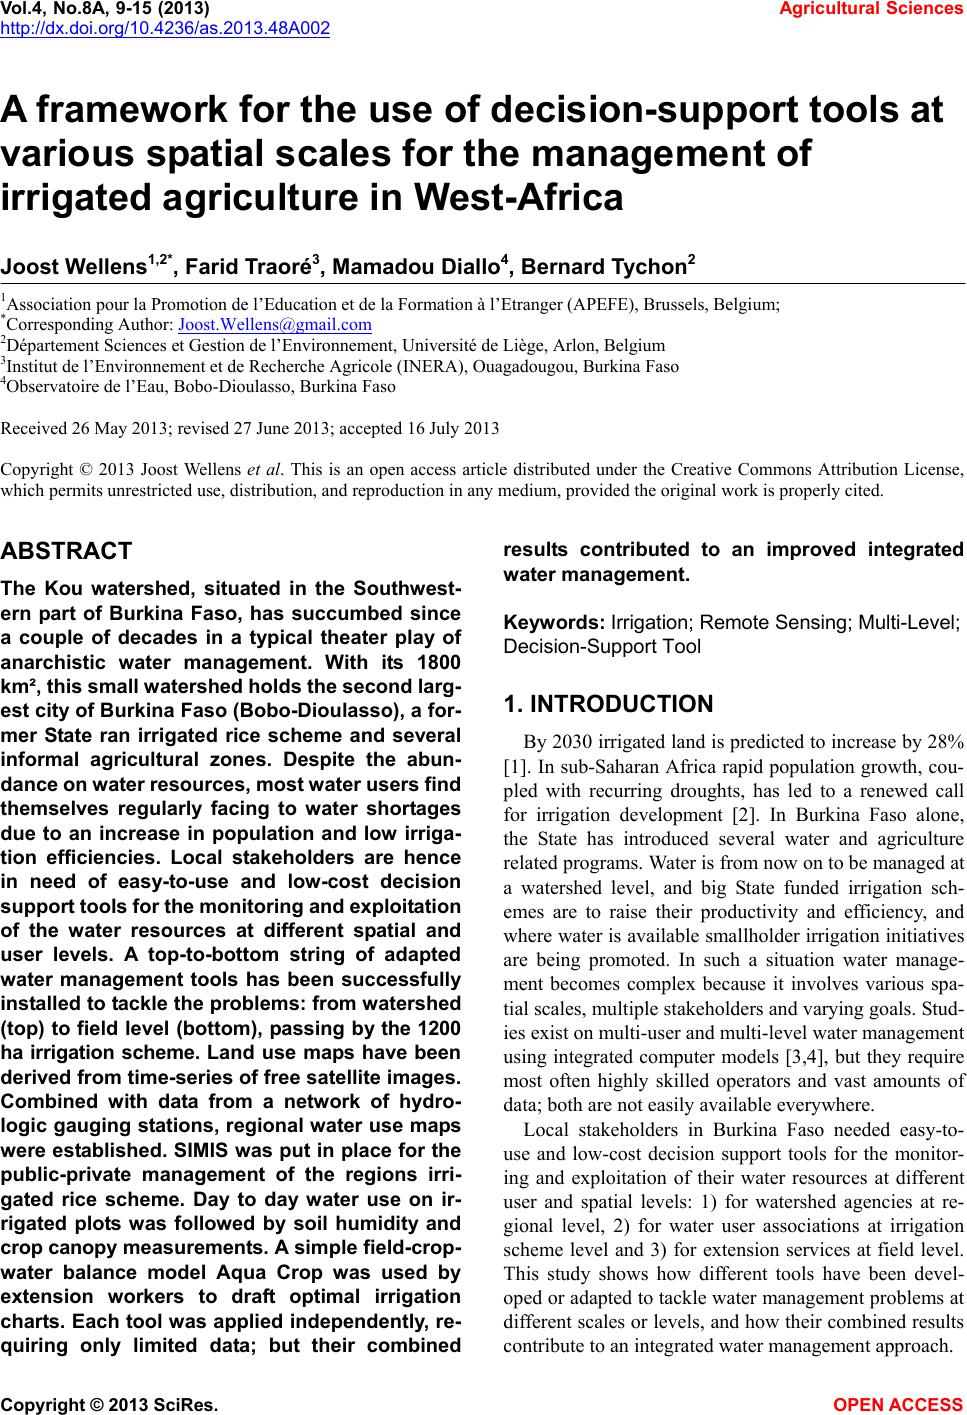
|