Journal of Environmental Protection, 2013, 4, 5-15
http://dx.doi.org/10.4236/jep.2013.48A2002 Published Online August 2013 (http://www.scirp.org/journal/jep)
Environmental Impact Assessment of GHG Emissions
Generated by Coal Life Cycle and Solutions for Reducing
CO2
Cristian Dincă1, Călin-Cristian Cormoş2, Horia Necula1
1Power Plant Department, University Politehnica Bucharest, Bucharest, Romania; 2Facultatea de Chimieşi de Inginerie Chimică,
Universitatea Babeş-Bolyai, Cluj-Napoca, Romania.
Email: crisflor75@yahoo.com, cormos@chem.ubbcluj.ro, horia@energ.pub.ro
Received June 14th, 2013; revised July 12th, 2013; accepted August 9th, 2013
Copyright © 2013 Cristian Dincă et al. This is an open access article distributed under the Creative Commons Attribution License,
which permits unrestricted use, distribution, and reproduction in any medium, provided the original work is properly cited.
ABSTRACT
The objective of this paper consists of evaluating the coal life cycle and proposing technical solutions for reducing
GHG emissions. After applying the life cycle assessment on the coal life cycle, it was noticed that the power engineer-
ing stage has a bigger environmental impact on different indicator impacts. In order to reduce the GHG emissions the
CO2 chemical absorption process was integrated in the power plant based on the circulating fluidized bed combustion
technology. Two cases were analyzed: super-critical and ultra-supra-critical parameters. For each case the environ-
mental indicators (global warming potential, abiotic depletion potential, human toxicity potential, photochemical poten-
tial, acidification potential, eutrophisation potential) were evaluated in order to estimate the environmental effects on
the coal life cycle with CO2 capture process. After the integration of the CO2 capture post-combustion process into the
power plant, the GHG emissions decreased from 450,760 CO2 equiv. tons to 75,937 CO2 equiv. tons for super-critical
parameters and from 438122 CO2 equiv. tons to 73245 CO2 equiv. tons for ultra-supra-critical parameters respectively.
In order to increase the absorption capacity of the MEA solvent the SO2 emissions were reduced from flue gases and
consequently the acidification potential was reduced too in both cases. On the contrary, the amount of fuel increased in
order to maintain the functional unit as a result of the efficiency penalty of the CO2 capture integration in the power
plant.
Keywords: CO2 Capture; Coal; LCA; Amines
1. Introduction
The coal is nowadays one of the main primary energies
which the energy sector uses for covering the electricity
demand. However, despite the fact that it is attracttive for
the energy sector, the coal combustion poses some envi-
ronmental issues. According to latest data, the reserve
reported to production (R/P) ratios vary significantly [1]:
for oil it is about 45.7 years, for natural gas 62.8 years
and for coal 119 years. Coal is in the best position as it
gives the longest energy independence, and its reserves
are more uniformly spread, which makes the world mar-
ket more stable and prices are not so volatile. The con-
cerning aspects linked with coal usage in the energy sec-
tor are CO2 emissions. For example, for the generation of
one MWh of electricity, the CO2 emission in the case of
natural gas is about 350 - 400 kg, and in the case of the
coal is about 800 - 900 kg [2]. The continuation of coal
usage for power generation is sustainable only if CO2 is
captured and then safely stored for a long time.
The need to increase the security of primary energy
sources and to reduce CO2 emissions, leads to the large
scale utilization of renewable energy sources (solar, wind,
tides, biomass etc.) at a large scale. In this context, the
European Commission has set a target for the EU that
until 2020, 20% of the whole energy mix should be cov-
ered by renewable energy sources as well as that there
should be a 20% cut of CO2 emissions compared with
1990 levels [3]. Furthermore, the European Union is
prepared to cut 30% of CO2 emissions by 2020 if other
developed countries proceed to similar cuts. Along this
line, Romania has a significant potential of renewable
energy sources, just to mention the ones related to this
project proposal various biomass sorts (e.g. sawdust,
agricultural wastes, etc.). Regarding the environmental
Copyright © 2013 SciRes. JEP
Environmental Impact Assessment of GHG Emissions Generated by Coal Life Cycle and Solutions for Reducing CO2
6
protection and the mitigation of climate change, the re-
ports of Intergovernmental Panel on Climate Change—
IPCC [4] established on scientific basis that the climate
change and the rise of global temperature levels noticed
over the past 50 years are linked with human activity and
associated with greenhouse gas emissions (mainly CO2).
According to IPCC statistics, the sectors that generate the
highest CO2 emissions are: the power generation (21.3%),
the industrial sector (16.8%) and the transport sector
(14.0%). These constantly increasing greenhouse gas
emissions are responsible for an increase in temperatures,
which is expected to continue over the coming decades to
reach up to +1.4˚ to +5.8˚C globally by the year 2100
(compared with 1990 temperatures). Temperature in-
creases are causing severe droughts in some parts of the
world and extreme weather conditions. One main target
related to the limitation of global warming is to take seri-
ous actions to limit the global average temperature in-
crease to 2˚C compared with preindustrial levels. Re-
search shows that stabilizing the level of greenhouse
gases at 450 ppm would lead to a 1 in 2 chances to reach
the target of 2˚C compared with a 1 in 6 chance if levels
reach 550 ppm and a 1 in 16 chance if the level hits 650
ppm. In terms of reducing greenhouse gas emissions this
means that the global emissions must fall by almost 50%
compared with 1990 levels by 2050, which implies a 60
to 80% reduction for developed countries [5].
In order to mitigate the climate change, a special atten-
tion is given to the reduction of CO2 emissions by means
of capture and storage (CCS) techniques. When it comes
to CO2 capture, there are several options: post-combus-
tion capture, pre-combustion capture, oxy-combustion or
different emerging new technologies which are very
promising in terms of reducing CO2 capture penalties e.g.
chemical looping, polymeric membranes, enzymatic sys-
tems etc. [6,7]. Some of the potential industries with sig-
nificant CO2 reduction capabilities considering stationary
sources are: power generation and some industrial sectors
having large energy consumptions (e.g. cement, metal-
lurgy, chemical, pulp and paper etc.).
Over the last period, several scientific papers have
analyzed different power generation technologies based
on coal using the life cycle assessment [8-19]. The scien-
tific analyses focused on CO2 capture post and oxy
combustion technology integration in the energy power
plants [8,9]. Also, other authors have developed and
adapted the life cycle assessment methodology by inte-
grating CCS technology in the energy units [10,11].
Kather et al. and Husebye et al. studied the technical and
economic effects of the capture, transport and storage
technology integration in the pulverized coal combustion
power plant [12,13]. In another paper the authors devel-
oped a database on the emissions generated in the power
plant stage, and they determined the stripper performance
in terms of energy [14]. In the same vein, in the paper of
Jassim et al., the authors have created an absorber/strip-
per model [15]. Lawal et al. have elaborated a model
based on CO2 capture integration in the coal fired power
plant at a demonstrative scale [16].
However, these works are focused on assessing emis-
sions of greenhouse gases in the stage of converting coal
into electricity. Just a few scientific papers take into con-
sideration all the coal life cycle stages but without tack-
ing in consideration energy production using the circu-
lating fluidized bed coal combustion technology. There-
fore, this paper is intended to assess the environmental
impact considering the coal life cycle by integrating the
circulating fluidized bed combustion equipped with CO2
capture by chemical absorption unit.
In this paper we analyzed the coal life cycle energy
with power generation in a circulating fluidized bed
combustion technology. The inventory and the impact
assessment were based on the life cycle analysis method-
ology and on the CML methodology proposed by the
University of Leiden (Netherlands) [17]. In this analysis,
we have identified all the greenhouse gases throughout
the coal life cycle (extraction, treatment, transport and
combustion stage) and we specified the contribution of
every gas to the total CO2 equivalent.
2. Material and Methods
2.1. Life Cycle Assessment Methodology
In this paper we used the life cycle methodology in order
to evaluate the GHG emissions generated by the entire
coal life cycle. The life cycle assessment permits identi-
fying and quantifying all the greenhouses gases gener-
ated throughout the entire coal life cycle. According to
ISO, the LCA methodology consists in four steps: Goal
and Scope, Life Cycle Inventory (LCI) analysis, Life Cy-
cle Impact Assessment (LCIA) and Interpretation [17].
2.2. Definition of Scope and Goal
The objective of the paper consists in evaluating the
greenhouses gases generated by the coal life cycle in the
followings stages: coal extraction, coal treatment, coal
transport and coal combustion for electricity generation.
The environmental effects on the CO2 capture chemical
absorption process integration in the power plant will be
also evaluated.
The paper analyzed two cases concerning the electric-
ity required by the processes before the combustion stage.
Figure 1 presents the coal life cycle in the case when the
energy required by every stage is provided by the coal
life cycle. 1
cb
M
, 2
cb
M
, 3
cb
M
represent the amount of
fuel required by the energy unit in order to provide the
electricity for the process. ex
cb
M
, tr
cb
M
, tp
cb
M
represent
Copyright © 2013 SciRes. JEP
Environmental Impact Assessment of GHG Emissions Generated by Coal Life Cycle and Solutions for Reducing CO2
Copyright © 2013 SciRes. JEP
7
Figure 3 presents the processes included in the coal
life cycle. The power plant is equipped with a CO2 cap-
ture post-combustion system. For the amine regeneration,
a steam flow is extracted from the steam turbine, (S).
the amount of raw coal extracted, the amount before the
treatment process and the amount of coal that is trans-
ported to the consumer.
The efficiency for every process (extraction, treatment
and transport) is defined by: ex
, tr
, tp
. is the
annual electricity produced by the power plant.
t
ELegend:
e—the electricity consumed in the extraction proc-
ess, in MWh;
E
Figure 2 shows the case when the energy required by
each of the process above mentioned is generated by the
national energy system.
tr —the electricity consumed in the treatment proc-
ess, in MWh;
E
tp —the electricity consumed in the transport process,
in MWh.
E
The cases analyzed in this paper are divided in two
groups: Case 1 refers to the coal life cycle without CO2
capture; Case 2 refers to the coal life cycle with CO2
capture process. In both cases the electricity required by
the processes of the coal life cycle (extracting, treatment,
transport stage) is provided by the national energy sys-
tem. The cases are:
2.3. Functional Unit
In this analysis, in order to compare the coal life cycle
with and without the CO2 capture section we have pro-
posed the functional unit: the annual electricity required
for a consumer. The electricity required by the consumer
c
E from the residential and tertiary sector is:
Case 1: Coal life cycle without CO2 capture section;
Case 2: Coal life cycle with CO2 capture section.
In the second case, the energy generated by the na-
tional energy system takes into account the primary en-
ergy in the mix of national energy. So, the pollutant
emission

p
e generated by the energy consumed by
every process is determined with the relation 1.
y
cp
EEN
y
(2)
where:
p
E—represents the annual electricity required by a
person, in MWh/year/pers;
1
ni
p
p
i
e
e (1)
N—the number of persons;
The amount of the fuel necessary to be produced by
the electricity unit
t
E is:
where:
c
te
E
E
(3)
i
p
e—pollutant emission according to the primary en-
ergy used, i, in g/kWh.
The energy needed for the upstream stages of the en-
ergy production stage comes from the national power
grid and it correspondsto the mix: coal—38%; hydro—
27%; nuclear—20%; natural gas—13% petroleum—2%
[18].
e
—represents the efficiency of the electricity distri-
bution process (taking into account the electricity loss),
in %.
Table 1 presents all the specific emissions (in gr/kg
fuel) generated by the coal life cycle for extraction,
1
cb
M
2
cb
M
3
cb
M
ex
cb
M
tr
cb
M
tp
cb
M
en
cb
M
ex
tr
tp
U.E. U.E.U.E.
Extraction Treatment Trantsport Energy
production E
t
Figure 1. Coal life cycle—Case 1.
ex
cb
M
tr
cb
M
tp
cb
M
en
cb
M
ex
tr
tp
National energy ststem
Extraction Treatment Trantsport Energy
production E
t
Figure 2. Coal life cycle—Case 2.
Environmental Impact Assessment of GHG Emissions Generated by Coal Life Cycle and Solutions for Reducing CO2
8
ex
cb
M
tr
cb
M
tp
cb
M
en
cb
M
Extraction
Treatment
Tr antsp ort
Energy National System
E
t
E
tp
E
tr
E
e
S
Emissions
Emissions
Raw
Material
Thermo-electrical
Power plant
Nuclear-electrical
Power plant
Hydro-electrical
Power plant
Power plant
Power generation
CO2 capture
post-
combustion
Figure 3. The boundaries of the studied system.
Table 1. The emissions generated by the each stage of the coal life cycle, in gr/kg.
Emission Extraction Treatment Transport Combustion
NH3 0.0494 0.0245 2.21 × 10⁷ 0.000121
CO2 3.643 3.74 0.039 1103.187
CO 0.00381 0.00322 0.00322 0.1737
HCl 1.31 × 10⁹ 3.05 × 10⁹ 3.1 × 10¹⁰ 4.07 × 10⁵
HF 2.43 × 10⁹ 5.26 × 10⁹ 1.64 × 10¹¹ 1.96 × 10⁶
H2S 1.03 × 10⁹ 1.12 × 10⁹ 6.87 × 10¹³ 1.7 × 10⁷
CH4 0.6391 0.00738 2.04 × 10⁶ 9.89 × 109
NOx 0.0191 0.0173 0.000413 0.00943
N2O 0.000316 0.000466 5.5 × 10⁷ 3.4639
Praf 0.00789 0.00153 4.12 × 10⁵ 0.00353
SO2 0.0412 0.0112 2.13 × 10⁴ 10.198
C6H6 - - - 7.2598
treatment, transport and combustion stage. In order to
determine the emissions generated in the energy process
for producing the annual electricity , relation 4
is used. All the emissions collected are determined ac-
cording to the functional unit. As a result, the emissions
given in Table 1 are corrected with the fuel mass
corresponding to the analyzed stage.
_ik rec
P

ik
P
i
comb
M
_
i
ik recikcomb
PPM (4)
2.4. Coal Life Cycle Impact Assessment
The methodology CML was used for quantifying the
GHG emissions collected in the inventory analysis. The
impact analysis is a methodology where the potential
impact of the resource requirements and emissions is
classified, characterized and evaluated. The impact as-
sessment includes three steps:
Classification: relates the emissions to the relevant
impact categories;
Characterization: quantifies the contribution of emis-
sions to the relevant impact categories (e.g., convert
NOx to SO2 equivalents);
Evaluation: ranks the relevant impact categories.
Table 2 shows all environmental indicators for energy
solutions evaluation.
Figures 4-6 show the climate change impact evalua-
tion for different coal life cycles which takes into account
the extraction, treatment, transport and energy generation
stages: pulverized coal (sub-critical, supra-critical and
ultra-supra-critical parameters); circulating fluidized bed
Copyright © 2013 SciRes. JEP
Environmental Impact Assessment of GHG Emissions Generated by Coal Life Cycle and Solutions for Reducing CO2 9
Table 2. The environmental indicators.
Class impact Emissions participants Reference pollutant Impact scale
Global warming potential (GWP) CO2, CH4, N2O CO2-equiv. Global
Acidification potential (AP) SOx, NOx, HCl, HF, NH3 SO2-equiv. Regional, local
Eutrophication potential (EP) NO, NO2, NH3, 3
4
PO
3
4
PO
-equiv. Local
Photo-oxidant formation potential (POCP) NMHC C2H6-equiv. Local
Human toxicity potential (HTP) Dust, Hg, H2S, NO2, NH3, SO2 1,4 DCB equiv. Global, Regional, Local
Abiotic resources depletion potential (ADP) Coal Antimoniu eqiv. Global, Regional, Local
AP_sc AP_USC ASFC IGCC
AP
_
SC
Comparative assessment of different coal life cycle
according to climate change (CO
2
eqiuiv. tons)
20.86% 20.07%
19.37%
19.04%
20.66%
Figure 4. Global comparative assement of different coal life
cycles according to theclimate change.
AP_sc AP_USC ASFC IGCC AP_SC
Coal life cycle
0
GWP, [CO
2
equiv. tons]
Comparative assessment of different coal life cycle stage
according to climate change
Power generation
Transport
Treatment
Extraction
50000
100000
150000
200000
250000
300000
350000
400000
450000
500000
Figure 5. Comparative assessment of different coal life cycle
stages according to the climate change.
combustion (ASFC); and integrated gasification com-
bined cycle (IGCC). In addition, the contribution of the
coal life cycle stage to the climate is presented. The
power generation stage has the highest contribution to
the climate change due to the CO2 emissions generated
by coal combustion.
Figure 4 presents a comparison of different coal life
cycles with the energy conversion stage. The analysis of
different ways to produce the electricity from coal shows
AP_sc
Green house gases contribution to climate change
AP_USC ASFC IGCC
AP_SC
Coal life cycle
2O
CH4
370000
GWP, [CO2 equiv. tons]
380000
390000
400000
410000
420000
430000
440000
CO2
Figure 6. The contribution of green house gases to the
climate change power generation stage.
no obvious difference between the GWP impact indica-
tors. But, if we analyze the whole coal life cycle, we no-
tice that the power generation stage has the main contri-
bution to the climate change (>95%) independent of how
the energy technology was used.
For the reduction of the environmental impact of the
coal life cycle used in the energy sector the integration of
the CO2 capture section is necessary. In Figures 7-9 the
effects on the eutrophisation class impact is presented for
the coal life cycle.
The NO2 and NH3 are the pollutants that have a con-
tribution to the eutrophisation class. However, the NO2 is
the main pollutant and it is generated in the power gen-
eration stage. The NH3 is generated in the power genera-
tion stage as a result of the measures taken to reduce the
NOx emissions.
Figures 10-12 show the impact of the coal life cycles
according to POCP. In this case, the IGCC solution has a
small impact due to the SOx desulphurization before
syngas combustion.
NO2 and SO2 are the pollutants with the main contri-
bution to the POCP. The difference between technologies
consists in the measured applied for SO2 emissions re-
ducetion.
The effects on the environment according to human
toxicity of the coal life cycle are presented in Figures
13-15.
Copyright © 2013 SciRes. JEP
Environmental Impact Assessment of GHG Emissions Generated by Coal Life Cycle and Solutions for Reducing CO2
10
AP_sc AP_USC ASFC IGCC
AP_SC
Comparative assessment of different coal life cycle
according to eutrophisation (
3
4
PO
eqiuiv. tons)
18.98% 20.51%
19.79%
19.45%
21.27%
Figure 7. Global comparative assement of different coal life
cycles according to the eutrophisation.
AP_sc AP_USC ASFC IGCC AP_SC
Coal life c
y
cle
0
50
100
150
200
EP, [PO
43-
equiv. tons]
250
Comparative assessment of different coal life cycle stage
according to eutrophisation
Power generation
Transport
Treatment
Extraction
Figure 8. Comparative assessment of different coal life cycle
stages according to the eutrophisation.
AP_sc
The emissions contribution to the eutrophisation
AP_USC ASFC IGCC AP_SC
Coal life c
y
cle
N
O
2
N
H
3
0
20
40
60
80
100
120
140
160
180
EP, [PO
43
-
equiv. tons]
200
Figure 9. The contribution of the emissions to the
eutrophisation.
AP_sc AP_USC ASFC IGCC
AP_SC
Comparative assessment of different coal life cycle
according to POCP (C
2
H
6
eqiuiv. tons)
14.51%
22.39%
21.61%
21.24%
20.26%
Figure 10. Global comparative assement of different coal
life cycle according to POCP.
AP_sc AP_USC ASFC IGCC AP_SC
Coal life cycle
0
20
40
60
80
100
120
140
160
180
POCP, [C
2
H
6
equiv. tons]
200
Comparative assessment of different coal life cycle stage
according to POCP
Power generation
Transport
Treatment
Extraction
Figure 11. Comparative assessment of different coal life
cycle stages according to POCP.
AP_s c
The emissions contribution to the POCP
AP_USC ASFC IGC CAP_SC
Coal life cycle
N
O
2
CH
4
SO
2
0
CO
20
40
60
80
100
120
140
160
180
POCP, [C
2
H
6
equiv. tons]
Figure 12. The contribution of the emissions to the POCP.
AP_sc AP_USC ASFC IGCC
AP_SC
Comparative assessment of different coal life cycle
according to HTP (1,4 DCB eqiuiv. tons)
14.54%
23.58%
22.75%
22.37%
16.76%
Figure 13. Global comparative assement of different coal
life cycles according to HTP.
AP_sc
Comparative assessment of different coal life cycle stage
according to HTP
AP_USC ASFC IGCC AP_SC
5000
4000
3000
2000
1000
0
Coal life cycle
Power generation
Transport
Treatment
Extraction
6000
HTP, [1.4 DCB equiv. tons]
Figure 14. Comparative assessment of different coal life
cycle stages according to HTP.
Copyright © 2013 SciRes. JEP
Environmental Impact Assessment of GHG Emissions Generated by Coal Life Cycle and Solutions for Reducing CO2 11
The IGCC and CFBC technology have a small envi-
ronmental impact considering HTP compared to pulver-
ized coal combustion.
The pollutants that contribute to the human toxicity
class are generated mainly during the power generation
stage. The other stages of the coal life cycle are a small
contribution to this environmental indicator (less than
2%).
The main pollutants that contribute to the human tox-
icity indicator are dust, NO2 and SO2, which are gener-
ated mostly in the combustion stage.
Figures 16-18 show the environmental impact of the
coal life cycle according to acidification.
Considering the low emissions of SO2 generated in the
combustion stage, IGCC have a small environmental
impact. In contrast, the pulverized coal has the biggest
environmental impact.
As in the POCP case, the SO2 emissions have the main
contribution, mainly generated during the power genera-
tion stage.
In Figure 19 a comparative assessment between dif-
ferent coal life cycles is presented. In order to produce
AP_sc
The emissions contribution to the HTP
AP_USC ASFC IGCCAP_SC
Coal life c
y
cle
H
2
S
HCl
N
O
2
N
H
3
SO
2
4000
3000
2000
1000
0
HTP, [1,4 DCB equiv. tons]
5000
6000
Hg
dust
Figure 15. The contribution of the emissions to the HTP.
AP_sc AP_USC ASFC IGCC
AP_SC
Comparative assessment of different coal life cycle
according to AP (SO
2
eqiuiv. tons)
14.02%
22.56%
21.77%
21.40%
20.25%
Figure 16. Global comparative assement of different coal
life cycles according to AP.
AP_sc
Comparative assessment of different coal life cycle stage
according to AP
AP_USC ASFC IGCC AP_SC
4500
4000
3500
3000
2500
2000
1500
1000
500
0
AP, [SO
2
equiv. tons]
Coal life cycle
Power generation
Transport
Treatment
Extraction
Figure 17. Comparative assessment of different coal life
cycle stages according to AP.
AP_sc
The emissions contribution to the AP
AP_USC ASFC IGCC
4500
AP_SC
Coal life cycle
H
2
S
HCl
N
O
2
N
H
3
SO
2
4000
3500
3000
2500
2000
1500
1000
500
0
AP, [SO
2
equiv. tons]
Figure 18. The contribution of the emissions to the AP.
ADP, [antimoniu equiv. tons]
3650
AP_s c
Comparative assessment of different coal life cycle
according to ADP(antimoniu eqiuiv. tons)
AP_USC ASFC IGCC
3700
3750
3800
3850
3900
3950
4000
4050
4100
4150
AP_S C
Figure 19. Comparative assement of different coal life
cycles according to ADP.
the energy required by the consumer, the pulverized coal
combustion with ultra-supra-critical parameters has the
lowest amount of coal compared to other technologies.
Therefore, in order to reduce the GHG emissions we
propose to integrate the CO2 capture section in the circu-
lating fluidized bed combustion and to analyze the global
environmental effects.
Copyright © 2013 SciRes. JEP
Environmental Impact Assessment of GHG Emissions Generated by Coal Life Cycle and Solutions for Reducing CO2
Copyright © 2013 SciRes. JEP
12
2.5. Circulating Fluidized Bed Combustion with
CO2 Capture
Figure 20 presents the CFBC pilot installation with CO2
chemical absorption process integration. The CO2 che-
mical absorption capture process includes an absorber
and a stripper unit. In order to increase the CO2 capture
performance the following process parameters were op-
timized in this study: MEA absorption capacity, the
thermal energy required for solvent regeneration, and the
CO2 capture efficiency. The optimization was performed
by varying the lean and rich loading value of solvent.
The difference between the last two parameters repre-
sents the MEA absorption capacity.
Legend:
A
—the rich loading solvent after the Absorber unit
(measure point);
B
—the rich loading solvent after the reservoir “MEA
rich” (measure point);
C
—the lean loading solvent after the economizer
(measure point);
D
—the lean loading solvent after the re-boiler unit
(measure point);
E
—the lean loading solvent after the reservoir “MEA
lean” (measure point);
T
—the temperature measure point;
I
—the electric current intensity measure point;
c.w. —cold water;
—the gas analyzer (TESTO).
Before entering the absorber unit, the flue gases are
desulphurized using 1.5% NaOH. The absorber unit is
realized by a modern packing design using aRaschig ring
with a nominal size of 16 mm [11]. Hence, the absorber
column has a number of 8 theoretical stages with the
contact surface area of around 120 m2/m3.
The coal composition was: C—21.55%; H—1.25%; O
—2.55%; N—0.65%; S—1%. For this last analysis of the
lignite used, the low heating value 7 543 MJ/kg.
Table 3 shows the range of variation for the process
parameters analyzed.
Flue gas out
Absorber
Lean
p
ump
c.w
c.w
Rich/Lean HX
Rich
pump
c.w
Electrical re-boiler
Blower
Flue gas in
Cooler
c.w
Stripper
CO
2
Condenser
+ Flash
T
T
I
T
T
TBE
D
C
T
I.
MEA MEA lean
Figure 20. The CO2 post-combustion section.
Environmental Impact Assessment of GHG Emissions Generated by Coal Life Cycle and Solutions for Reducing CO2 13
Table 3. The range of process parameters.
Process parameter Range of variation Process conditions
Solvent flow rate, kg/h 500 - 1800 pabs-ct.; 2
CO
-ct.; CMEA-ct.
CO2 partial pressure, atm ~0.11 n.a.
Temperature of absorption, ˚C 31 - 49 pabs-ct.; 2
CO
-ct.; CMEA-ct.
Pressure of absorption process, atm 1.1 - 2.1 n.a.
L/G ratio, kgl/kgg 0.45 - 1.62 pabs-ct.; 2
CO
-ct.; CMEA-ct.
CO2 efficiency,% ~90 pabs-ct.; CMEA-ct.
MEA concentration, wt.% ~25 pabs-ct.; 2
CO
-ct.
3. Results and Discussion
The objective of this paper was to ameliorate the envi-
ronmental impact on the coal life cycle by reducing the
GHG emissions generated during the power generation
stage. In this respect, we analyzed the integration of the
CO2 post-combustion capture in the circulated fluidized
bed combustion. We also, analyzed the effects on the
CO2 capture section integration in the power plant on the
environmental impact.
Firstly, the MEA capacity was determined by meas-
ureing the lean and rich loading solvent in different
points indicated in Figure 20 [11]. Thus, Table 4 shows
the values determined for the solvent.
As for the absorption capacity of MEA, the results
were validated in the similar study [18,19].
Points A, B, C, D, E are indicated in the legend of Fig-
ure 20. The difference between points A and E repre-
sents the absorption capacity of the MEA for 25% wt.
concentration in the solvent.
Figure 21 shows the variation of the energy required
by the solvent according to the CO2 capture efficiency
for different L/G ratio.
One can notice that for each L/G ratio a minimal value
of energy required is obtained for 90% CO2 capture effi-
ciency. The optimal value for L/G ratio was 0.7 kgl/kgg.
So, for a flue gas flow (according to coal flow and the
excess air) 0.7 kg of liquid solvent is necessary for a CO2
capture efficiency of 90%. This value for the solvent
prevents the metallic surface corrosion by using a higher
solvent flow.
Table 5 shows a comparative environmental assess-
ment between a power plant with circulating fluidized
bed combustion of coal with and without CO2 capture for
supra-critical and ultra-supra-critical parameters.
After the integration of the CO2 capture chemical ab-
sorption process in the power plant, and for the same
functional unit, the GWP impact indicator decreased
from 450,760 to 75,937 CO2 equiv. tons and from
438,122 to 73,245 CO2 equiv. tons.
But the CO2 capture process integration in the power
plant has reduced the power plant global efficiency with
almost 6%, which means that more fuel was needed in
order to accomplish the functional unit. However, for a
good absorption capacity of the MEA solvent, the flue
gas was desulphurized which permitted the considerable
reduction of the acidification potential indicators.
4. Conclusions
In this paper the coal life cycle was investigated from the
environmental point of view in order to identify the
amount of GHG emissions generated. Three energy solu-
tions (pulverized coal with sub-critical, supra-critical and
ultra-supra-critical parameters; circulating fluidized bed
combustion and integrated gasification with combined
cycle) were analyzed and compared from different indi-
cator impacts. The power generation stage has the main
contribution to the environmental impact for all the im-
pact indicators analyzed. As for the GHG emissions, the
main pollutant is CO2 for all the energy technologies
analyzed. In order to ameliorate the environmental im-
pact of the coal life cycle concerning the GHG emissions,
the CO2 capture by chemical absorption was proposed
for the integration in the ASFC technology.
In order to capture the CO2 the MEA solvent was used
(25% wt. in solvent).The MEA absorption capacity was
measured in various points of the experimental installa-
tion and the procedure was repeated for data validation.
The average MEA absorption capacity was 0.07 mol
CO2/ mol MEA. The energy required by the process for
the regeneration of the MEA solvent was 2.9 and 2.77
GJ/ tCO2 captured in the case of supra-critical and ul-
tra-supra-critical parameters. A steam flow was extracted
from the low pressure steam turbine (LPST) in order to
regenerate the MEA solvent. An energy penalty was
5.94% and 6.4% respectively for both cases.
On the other hand, for the coverage of the functional
unit more fuel is needed and in that case one can notice
an increase of the abiotic depletion potential with ap-
proximately 16% as compare to the power plant without
CO2 capture. In order to reduce the corrosive impact of
Copyright © 2013 SciRes. JEP
Environmental Impact Assessment of GHG Emissions Generated by Coal Life Cycle and Solutions for Reducing CO2
14
Table 4. Lean and rich loadings at the five points of the pilot installation (25% MEA), in (mol CO2/mol MEA).
Rich loading solvent Lean loading solvent
Sample A B C D E
1 0.51 0.574 0.52 0.317 0.434
2 0.506 0.568 0.518 0.325 0.429
3 0.503 0.578 0.512 0.318 0.444
4 0.521 0.584 0.518 0.314 0.438
5 0.517 0.569 0.517 0.324 0.432
6 0.501 0.567 0.524 0.319 0.429
7 0.497 0.566 0.513 0.32 0.421
8 0.489 0.571 0.509 0.317 0.43
9 0.502 0.575 0.511 0.318 0.433
Average 0.505 0.572 0.515 0.319 0.432
3
Energy required GJ/tCO
2
75
CO
2
capture efficiency, [%]
80 859095100
L/G = 1.9
L/G = 1.72
L/G = 1.48
L/G = 1.3
L/G = 1
L/G = 0.7
3.5
4
4.5
5
5.5
6
6.5
7
7.5
8
8.5
9
9.5
10
Energy required according to CO
2
capture efficiency
variation for different L/G rapport
Figure 21. The optimal value of the energy required according to the CO2 capture efficiency and L/G rapport.
Table 5. Comparative assessment between the power plants with and without CO2 capture.
Process Parameter Power plant without CO2 capture Power plant with CO2 capture
A B A B
Steam cycle parameters
Functional unit, MWh 420000 420000 420000 420000
CO2 removal steam generator output, kW - - 38550 39889
Heat consumed for main steam, kW 649265 623025 649265 623025
CO2 removal system parameters
MEA solvent concentration,% - - 25 25
Solvent regeneration energy, GJ/tonneCO2 - - 2.9 2.77
Steam flow in the LPST, kg/s 185.02 179.04 119.89 116.02
Steam extraction flow for MEA regeneration, kg/s - - 65.13 63.02
Plant performance parameter
Net plant efficiency,% 46.21 48.15 40.27 41.75
Energy penalty,% - - 5.94 6.4
Environment indicator
ADP, antimony equiv. tons 3994 3890 4651.6 4486.7
GWP, CO2 equiv. tons 450760 438122 75937 73245
POCP, C2H6 equiv. tons 163.18 158.61 63.48 61.23
HTP, 1,4 DCB equiv. tons 3655.7 3553.2 3996.1 3854.5
AP, SO2 equiv. tons 3728.6 3624.1 1179.3 1137.5
EP, equiv. tons
3
4
PO 205.21 199.45 238.49 230.03
Copyright © 2013 SciRes. JEP
Environmental Impact Assessment of GHG Emissions Generated by Coal Life Cycle and Solutions for Reducing CO2 15
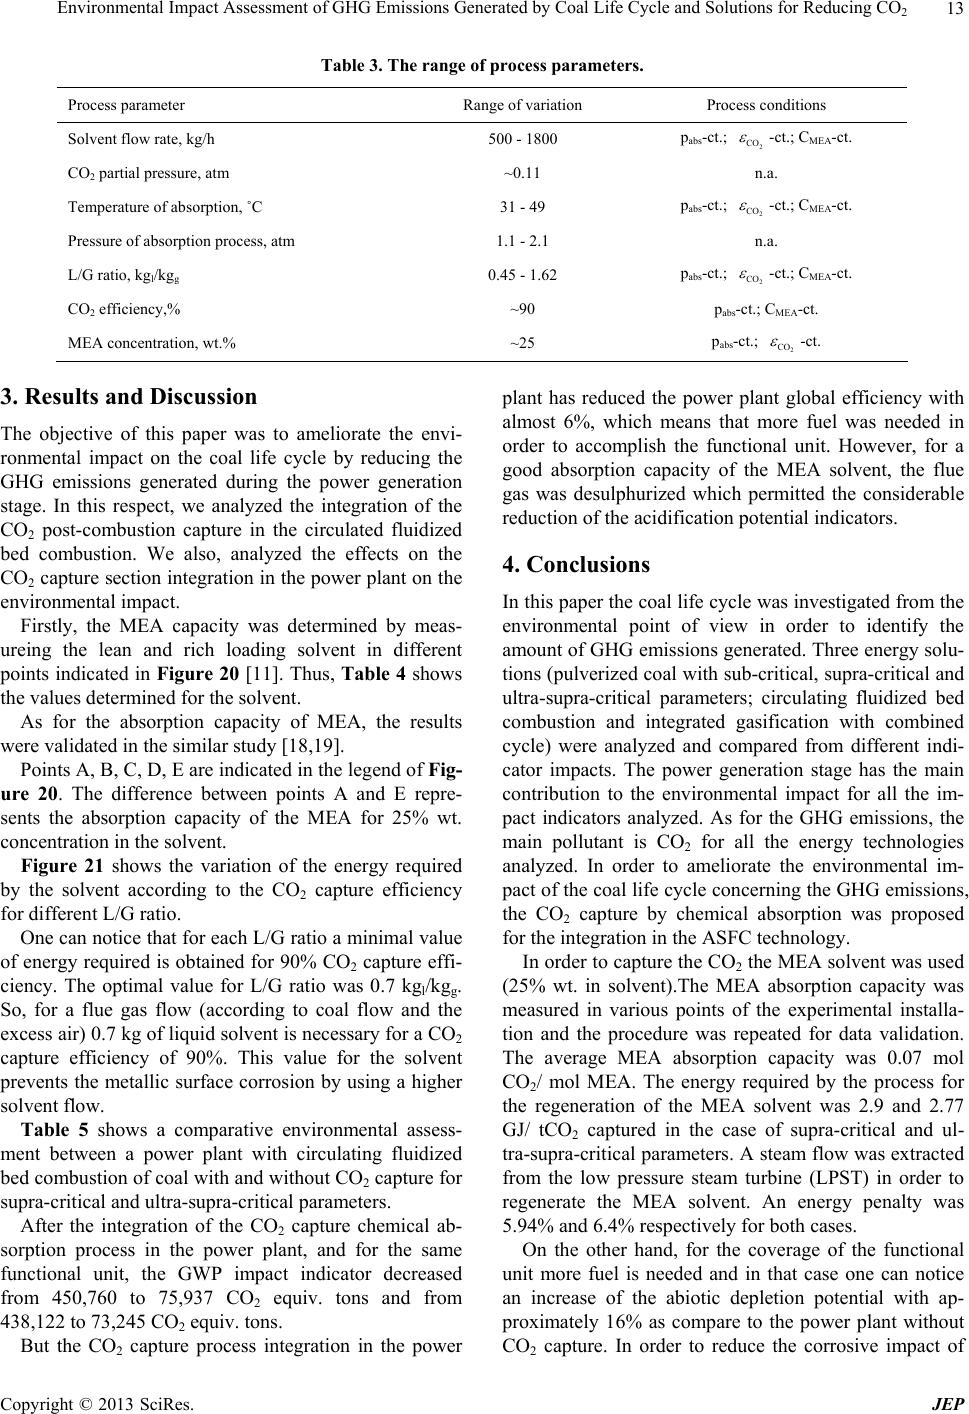
the MEA used, in this study it is obtained an L/G optimal
ratio. Thus, a small amount of MEA solvent is used for
the same amount of thermal energy used by the process.
By tacking in account the CO2 capture efficiency and the
minimal value for energy required by the process, the
L/G optimum was obtained 0.7 kgl/kgfg.
5. Acknowledgements
The study has been funded by the UEFISCDI within the
National Project number 38/2012 with the title: “Techni-
cal-economic and environmental optimization of CCS
technologies integration in power plants based on solid
fossil fuel and renewable energy sources (biomass)”—
CARBOTECH.
REFERENCES
[1] “Statistical Review of World Energy BP,” 2010.
www.bp.com
[2] E. Tzimas, A. Mercier, C. C. Cormos and S. Peteves,
“Trade-Off in Emissions of Acid Gas Pollutants and of
Carbon Dioxide from Fossil Fuels Power Plants with
Carbon Capture,” Energy Policy, Vol. 35, No. 8, 2007, pp.
3991-3998. doi:10.1016/j.enpol.2007.01.027
[3] European Commission, “DG Energy and Transport (TREN),
Strategic Energy Review,” 2009.
http://ec.europa.eu/energy
[4] “Intergovernmental Panel on Climate Change (IPCC), 4th
Assessments Report, Climate Change,” 2007.
www.ipcc.ch
[5] European Commission, “Strategy on Climate Change:
The Way Ahead for 2020 and Beyond,” 2007.
[6] “Intergovernmental Panel on Climate Change (IPCC),
Special Report, CO2 Capture and Storage,” 2005.
www.ipcc.ch
[7] J. D. Figueroa, T. Fout, S. Plasynski, H. McIlvired and R.
Srivastava, “Advances in CO2 Capture Technology—The
U.S. Department of Energy’s Carbon Sequestration Pro-
gram,” International Journal of Greenhouse Gas Control,
Vol. 2, No. 1, 2008, pp. 9-20.
doi:10.1016/S1750-5836(07)00094-1
[8] E. Favre, “Carbon Dioxide Recovery from Post-Combus-
tion Processes: Can Gas Permeation Membranes Compete
with Absorption,” Journal of Membrane Science, Vol.
294, No. 1-2, 2007, pp. 50-59.
doi:10.1016/j.memsci.2007.02.007
[9] E. Favre, R. Bounaceur and D. Roizard, “A Hybrid Proc-
ess Combining Oxygen Enriched Air Combustion and
Membrane Separation for Post Combustion Carbon Di-
oxide Capture,” Separation and Purification Technology,
Vol. 68, No. 1, 2009, pp. 30-36.
doi.org/10.1016/j.seppur.2009.04.003
[10] S. C. Page, A. G. Williamson and I. G. Mason, “Carbon
Capture and Storage: Fundamental Thermodynamics and
Current Technology,” Energy Policy, Vol. 37, No. 9,
2009, pp. 3314-3324. doi:10.1016/j.enpol.2008.10.028
[11] C. Dinca and A. Badea, “The Parameters Optimization
for a CFBC Pilot Plant Experimental Study of Post-Com-
bustion CO2 Capture by Reactive Absorption with MEA,”
International Journal of Greenhouse Gas Control, Vol.
12, 2013, pp. 269-279. doi:10.1016/j.ijggc.2012.11.006
[12] A. Kather and S. Linnenberg, “Evaluation of an Inte-
grated Post-Combustion CO2 Capture Process for Vary-
ing Loads in a Coal-Fired Power Plant Using Monoetha-
nolamine,” 4th International Conference on Clean Coal
Technologies, Dresden, 2009.
[13] J. Husebye, R. Anantharaman and S.-E. Fleten, “Techno-
economic Assessment of Flexible Solvent Regeneration
& Storage for Base Load Coal-Fired Power Generation
with Post Combustion CO2 Capture,” Energy Procedia,
Vol. 4, 2011, pp. 2612-2619.
doi:10.1016/j.egypro.2011.02.160
[14] B. A. Oyenekan and G. T. Rochelle, “Energy Performan-
ce of Stripper Configurations for CO2 Capture by Aque-
ous Amine,” Industrial & Engineering Chemistry Re-
search, Vol. 45, No. 8, 2006, pp. 2457-2464.
doi:10.1021/ie050548k
[15] M. S. Jassim and G. T. Rochelle, “Innovative Absorber/
Stripper Configurations for CO2 Capture by Aqueous
Monoethanolamine,” Industrial & Engineering Chemistry
Research, Vol. 45, No. 8, 2006, pp. 2465-2472.
doi:10.1021/ie050547s
[16] A. Lawal, M. Wang, P. Stephenson and O. Obi, “Demon-
strating Full-Scale Post-Combustion CO2 Capture for
Coal-Fired Power Plants through Dynamic Modelling and
Simulation,” Fuel, Vol. 101, 2012, pp. 115-128.
doi:10.1016/j.fuel.2010.10.056
[17] C. Dinca, A. Badea, et al., “A Multi-Criteria Approach to
Evaluate the Natural Gas Energy Systems,” Energy Pol-
icy, Vol. 35, No. 11, 2007, pp. 5754-5765,
doi:10.1016/j.enpol.2007.06.024
[18] L. Simon, E. Yannick, P. Graeme, Y. Artanto and K.
Hungerbuhler, “Rate Based Modeling and Validation of a
Carbon-Dioxide Pilot Plant Absorption Column Operat-
ing on Monoethanolamine,” Chemical Engineering Re-
search and Design, Vol. 89, No. 9, 2011, pp. 1684-1692.
doi:10.1016/j.cherd.2010.10.024
[19] Y. Zhang, H. Chen, C. Chen, J. M. Plaza, R. Dugas and G.
T. Rochelle, “Rate-Based Process Modeling Study of CO2
Capture with Aqueous Mono-Ethanolamine Solution,”
Industrial & Engineering Chemistry Research, Vol. 48,
No. 20, 2009, pp. 9233-9246. doi:10.1021/ie900068k
Copyright © 2013 SciRes. JEP