 Advances in Microbiology, 2013, 3, 403-411 http://dx.doi.org/10.4236/aim.2013.35055 Published Online September 2013 (http://www.scirp.org/journal/aim) Quantification of Zoonotic Bacterial Pathogens within Commercial Poultry Processing Water Samples Using Droplet Digital PCR Michael J. Rothrock Jr.1*, Kelli L. Hiett2, Brian H. Kiepper3, Kim Ingram1, Arthur Hinton1 1Poultry Processing and Swine Physiology Research Unit, USDA-Agricultural Research Service, Athens, Georgia 2Poultry Microbiological Safety Research Unit, USDA-Agricultural Research Service, Athens, Georgia 3Department of Poultry Science, University of Georgia, Athens, Georgia Email: *michael.rothrock@ars.usda.gov Received June 21, 2013; revised July 20, 2013; accepted July 31, 2013 Copyright © 2013 Michael J. Rothrock Jr. et al. This is an open access article distributed under the Creative Commons Attribution License, which permits unrestricted use, distribution, and reproduction in any medium, provided the original work is properly cited. ABSTRACT Raw poultry and poultry products are a significant source of zoonotic bacterial pathogen transmission; thus the sensitive detection of major zoonotic pathogens (Salmonella spp., Campylobacter jejuni, and Listeria monocytogenes) is a vital food safety issue. Recently, third generation PCR technology, known as droplet digital PCR (ddPCR) has been devel- oped to be more accurate and sensitive to detect genetic targets than current quantification methods, but this technology has not been tested within an industrial setting. There is an on-going study within our laboratory is investigating the effects of sampling times and sampling methods on the cultural and molecular (via qPCR) quantification of dominant zoonotic pathogens within a poultry processing facility. This presents a unique opportunity to compare the quantification resulted from this emerging, third generation technology to traditional quantification methods currently employed by the poultry industry. The results show that ddPCR detected pathogen-specific genes from more pathogen:sampling time combina- tions than either the qPCR or culturing methods from the final scalder and chiller tanks at three stages of processing (Start, Mid, and End). In fact, both ddPCR and qPCR substantially outperformed culture methods commonly used in poultry processing food safety-related studies, with Salmonella recovered only from the Mid and End sampling times from the scalder tank. While neither C. jejuni nor L. monocytogenes were recovered culturally, ddPCR was able to detect their respective genes commonly throughout the processing day in both the scalder and chiller water samples. Addition- ally, the use of unfiltered processing water provided significantly greater detection of bacterial and pathogen-specific gene abundances than did an analysis of larger volumes of filtered water. Considering the ddPCR-derived concentrations of the bacterial pathogens were consistent with what was previously found culturally in commercial poultry processing operations, ddPCR represented a significant advancement in poultry processing zoonotic pathogen quantification. Keywords: ddPCR; Poultry Processing; Zoonotic Pathogens; qPCR 1. Introduction The handling and consumption of poultry or poultry products have been repeatedly associated with the trans- mission of bacterial pathogens to the human population. Incidences of zoonoses originating from poultry products and processing environments have been reported for Salmonella spp. [1-3], Campylobacter jejuni [4,5], and Listeria monocytogenes [6,7]. Considering the high en- vironmental, economic, and public health costs of these zoonoses, a comprehensive understanding of the poultry production and processing parameters that allow for the survival/transmission of these bacterial pathogens is es- sential. To assess pathogen survival and transmission, accurate, sensitive, and highly specific quantification methods are needed. Historically, the quantification of foodborne pa- thogens in food production systems was based either on cultures or quantitative PCR (qPCR). While these me- thods have been used successfully, both come with cave- ats; either being time consuming and too ineffectively selective (culture-based) or dependent upon the proper standards and assay efficiencies (qPCR-based). To cir- cumvent these issues, third generation PCR technology, known as droplet digital PCR (ddPCR) was introduced *Corresponding author. C opyright © 2013 SciRes. AiM  M. J. ROTHROCK JR. ET AL. 404 to provide absolute quantification of target genes and the pathogens to possess those genes [8,9]. The advantages of ddPCR over qPCR-based assays are threefold: ddPCR is based on endpoint PCR (efficiency of primer/probe annealing is minimized); ddPCR does not require the use of standards for accurate quantification; and most impor- tantly, ddPCR is a high throughput (15,000 - 20,000 PCR reactions per well) assay. While ddPCR represents the newest quantification technology, only relatively pure bacterial or cell culture samples have been analyzed [9,10]. To our knowledge, this emerging third generation PCR technology has not been applied to complex environmental samples contain- ing mixed microbial populations, as well as organic/in- organic particulates/contaminants. Considering zoonotic foodborne pathogens can be detected in poultry carcasses but many times not within the limited sample volumes from the high capacity processing water tanks, the goal of this study is to determine the utility of ddPCR for the detection of Salmonella spp., C. jejuni, and L. monocy- togenes from the commercial poultry processing tank waters, and compare these results to common pathogen detection assays (cultural, qPCR). Water from the final scalder and chiller tanks in a commercial poultry proc- essing facility was sampled at three time points during the processing day (prior to the introduction of the first carcasses, halfway through the day, and after the last carcasses leave the tank) over three consecutive days. Additionally, the effect of water sampling method (raw water versus filtered samples) on-molecular-based detec- tion efficacy was also determined. 2. Materials and Methods 2.1. Sample Collection Processing water samples were collected from a com- mercial broiler processing facility. Small (~4.40 pounds) Cobb® broilers were processed at an average line speed of 364 birds per minute for 18 hr each day. For scalder water samples, 3 sterile 1-L plastic Nalgene® bottles (Fisher Scientific, Pittsburgh, PA) were used to collect 3 L of water from ~5 cm below the surface at the turn- around (midpoint) of the final scalder tank of a triple tank counterflow system. For chiller water samples, ster- ile 1-L Tri-pour beakers (Fisher Sci.) were placed in the basket end of a metal pole to retrieve 4 L of water from the posterior end of the counterflow chiller tank. In total, 3 sterile 1-L plastic Nalgene® bottles and 1 sterile 1-L glass Mason jar (for Oil and Grease content analysis; see below) were used to collect these samples. Samples were collected from these two tanks at three times during the processing shift: 1) prior to the first birds entering the cleaned and disinfected tanks (Start); 2) after 9 hours (~half of the processing day) of processing (Mid); and, 3) after the last birds left the tank and the waters were con- sidered “dirtiest” (End). Samples were taken from these three time points on three successive days, and were placed on ice for transport back to the laboratory for fur- ther sample processing and preparation. 2.2. Cultural Procedures Nalgene® bottles were vigorously shaken to homogenize samples, and 2 - 100 mL subsamples were placed into sterile 250-mL Corning Media Bottles (Fisher Sci.). The enumeration and isolation protocols were performed as previously described for each foodborne pathogen of interest: most probable number (MPN) analysis for Sal- monella spp. (Cason and Hinton, 2006); direct plate counting for C. jejuni using the CEFEX [11] and Campy- Check (Lastovica and Le Roux, 2001) methods; MPN and direct plate counting for L. monocytogenes (Donnelly et al., 1992). 2.3. DNA Extraction and qPCR Molecular quantification was applied to raw water taken directly from the initial water samples and from the fil- trate recovered from the filtration of the processing water samples. For the raw samples, DNA was extracted from two 0.5 mL aliquots using the FastDNA Spin Kit for Fe- ces according to manufacturer’s specifications (MP Bio, Solon, OH). For the filtrate samples, sterile pre-mois- tened (in 1X PBS) cheesecloth was used to initially filter 100 mL of the homogenized processing water samples into a fresh 1-L Tri-pour beaker. The cheesecloth was rinsed in 20 mL of 1X PBS and the resultant filtrate was divided into 3 - 40 mL subsamples and filtered simulta- neously through 3 separate 0.8 μm Nalgene filter units (Fisher Sci.). The three filtrate samples were combined in 1 sterile 250-mL centrifuge bottle (Beckman Coulter), and the cells were pelleted at 10000 rpm for 20 min at 4˚C. The pellet was re-suspended in 2 mL of 1X PBS and DNA was extracted from four 0.5 mL aliquots using the FastDNA Spin Kit for Feces (MPBio). For both the raw and filtrate samples, all individual DNA extracts were dry-pelleted using a VacufugeTM Plus (Eppendorf, Haup- page NY), and all extracts coming from a single sample were combined in 100 μL sterile molecular grade water. The DNA concentration in each sample was determined spectrophotometrically using the Take3® plate with the Synergy H4 multimode plate reader (BioTek, Winooski, VT). All DNA extracts were diluted in sterile molecular biology grade water (5 Prime, Inc., Gaithersburg, MD) so that 10 - 15 ng of genomic extract DNA was added to each qPCR reaction. All qPCRs were performed on the RealPlex 4S system (Eppendorf) in a total volume of 25 μL using the PerfeCta® qPCR Supermix (Quanta Bio- Copyright © 2013 SciRes. AiM  M. J. ROTHROCK JR. ET AL. Copyright © 2013 SciRes. AiM 405 sciences, Gaithersburg, MD) following the previously published thermocycling conditions and final primer/ probe concentrations (Table 1). 2.4. ddPCR DNA Amplification and Quantification Droplet digital PCR was performed as previously de- scribed [10] using the Bio-Rad QX100 system (Bio-Rad, Hercules, CA). In short, 1:10 dilutions of the DNA ex- tracts were used as templates for general or pathogen- specific PCR assays using primer/probe sets listed in Table 1. TaqMan-based PCR reaction mixtures (com- posed of 2X ddPCR MasterMix (Bio-Rad), 900 nM primers, 250 nM probe, 10 - 15 ng template DNA in a final volume of 20 μL) were mixed with droplet genera- tion oil (Bio-Rad) and loaded into an 8-channel dispos- able droplet generator cartridge (Bio-Rad). The cartridge was placed into the droplet generator (Bio-Rad) to create the ~20,000 droplets, which were collected from the droplet well of the cartridge and manually transferred to a 96-well PCR plate. The plate, after heat-sealing, was placed on a conventional thermal cycler (S1000; Bio-Rad) and amplified to end-point (40 cycles for all reactions). Upon completion, the 96-well plate was transferred to the droplet reader (Bio-Rad), and the droplets were auto- matically scanned from each well at a rate of ~32 wells/hr. Analysis of the ddPCR data was performed with the QuantaSoft analysis software package (Bio-Rad). 2.5. Processing Water Analyses Poultry processing water samples were analyzed using the appropriate Standard Method [12] for COD (chemical oxygen demand method 5220D), O & G (oil and grease method 5520D), TS (total solids method 2540B), TSS (total suspended solids method 2540D), and TKN (total Kjeldahl nitrogen method 4500-Norg C and 4500-NH3C). The concentration (mg/L) results from the final scalder and chiller tank processing water samples from all time points throughout the study are shown in Tables 2 and 3, respectively. 2.6. Statistical Analyses Prior to analysis, all quantification (cultural and mole- cular) data was log10-transformed to ensure the data was normally distributed. Prism 6.0b (GraphPad Software Inc., La Jolla, CA) was used to perform all regres- sion analyses, means comparisons (t-tests), and ANOVAs on the microbiological data. For one-way ANOVAs, Tukey’s post-tests were used to determine significant differences between pair-wise combinations. An alpha level of 0.05 was used to determine significance in all analyses. Table 1. ddPCR and qPCR primers and probe inform ation for this study. Target Oligo Final PCR mastermix concentration (nM) Tm (˚C) Reference Group Gene Name Sequence (5’-3’) qPCR ddPCR qPCR ddPCR 1055F ATG GCT GTC GTC AGC T 600 500 58 60 1392R ACG GGC GGT GTG TAC 600 500 All Bacteria 16S 16STaq1115-BHQ FAM-CAA CGA GCG-ZEN-CAA CCC-3IABkFQ200 250 (Harms et al. 2003) [28] Sal TTR-6-F CTC ACC AGG AGA TTA CAA CAT GG 400 500 65 60 Sal TTR-4-R AGC TCA GAC CAA AAG TGA CCA TC 400 500 Salmonella spp. ttr Sal TTR-5 ZEN FAM-CAC CGA CGG-ZEN-CGA GAC CGA CTT T -3IABkFQ 250 250 (Malorny et al. 2004) [29] hipO-Cj-F TCC AAA ATC CTC ACT TGC CAT T 500 500 60 60 hipO-Cj-R TGC ACC AGT GAC TAT GAA TAA CGA 500 500 Campylobacter jejuni hipO hipO-Cj-P FAM-TTG CAA CCT CAC TAG CAA AAT CCA CAG CT-BHQ-1 250 250 (He et al. 2010) [30] hlyA-LisM-F ACT GAA GCA AAG GAT GCA TCT G 600 500 60 60 hlyA-LisM-R TTT TCG ATT GGC GTC TTA GGA 600 500 Listeria monocytogenes hlyA hlyA-LisM-P FAM-CAC CAC CAG CAT CTC CGC CTG C -BHQ-1 200 250 (Suo et al. 2010) [31]  M. J. ROTHROCK JR. ET AL. 406 Table 2. Final scalder tank processing wa ter analyses at 3 times (Start, Mid, and End) during the processing shift 1. COD (mg/L) BOD (mg/L)2 TS (mg/L) TSS (mg/L) Start Mid End p-value Start MidEndp-value Start MidEndp-value Start Mid Endp-value Day 1 0 1723 2546 0 10141498 17714432176 2 775 1150 Day 2 7 1364 1375 4 802809 89 10131000 17 640 640 Day 3 3 2457 1833 2 14451078 11619461559 4 1090 780 Mean3 3b 1848a 1918a 0.0039 2b 1087a1128a0.0039 127b1467a1578a0.0113 8b 835a 857a0.0033 1COD = Chemical Oxygen Demand, BOD = Biological Oxygen Demand, TS = Total Solids, TSS = Total Suspended Solids; 2BOD was estimated from calcu- lated COD values using a 1.7:1.0 COD:BOD ratio that is consistent for the commercial processing plant from which these samples were collected (according to plant’s environmental quality manager); 3Superscript letters (a, b, c) indicate group mean separation from one-way ANOVA, based on the Tukey’s post-test. Table 3. Chiller tank processing water analyses at 3 times (Start, Mid, and End) during the pr ocessing shift1. COD (mg/L) BOD (mg/L)2 TS (mg/L) Start Mid End p-value StartMid End p-value StartMid End p-value Day1 0 1478 2609 0 869 1535 195 646 1440 Day2 82 1207 2144 48 710 1261 133 1294 1949 Day3 60 1346 2367 35 792 1392 348 1433 2176 Mean3 47c 1344b 2373a <0.0001 28b 790a 1396a <0.0001 225b 1124a 1855a 0.0029 TSS (mg/L) TKN (mg/L) Oil & Grease (mg/L)1 Start Mid End p-value StartMid End p-value StartMid End p-value Day1 2 350 550 0 114 97.2 0 76.2 119 Day2 18 275 595 1.0181 114 14 66.4 125 Day3 16 268 478 1.2791.8 137 7 96.2 192 Mean3 12c 298b 541a 0.0001 0.76b95.6a 116.1a 0.0002 7.0c 79.6b 145.3a 0.0016 1COD = Chemical Oxygen Demand, BOD = Biological Oxygen Demand, TS = Total Solids, TSS = Total Suspended Solids, TKN = Total Kjeldahl Nitrogen; 2BOD was estimated from calculated COD values using a 1.7:1.0 COD:BOD ratio that is consistent for the commercial processing plant from which these samples were collected (according to plant’s environmental quality manager); 3Superscript letters (a, b, c) indicate group mean separation from one-way ANOVA, based on the Tukey’s post-test. 3. Results and Discussion 3.1. Commercial Poultry Processing Water Analyses All processing water characteristics significantly in- creased after the beginning of the processing day for the final scalder (Table 2) and chiller (Table 3) tanks. This was expected since a variety of organics/particulates are introduced into these water tanks throughout the proc- essing day from the carcasses. All measured final scalder water samples reached a plateau value by the Mid sam- pling time that did not significantly change by the End sampling (Table 2). Conversely, only 2 of the tested va- riables in the chiller tank (TS and TKN) reached this plateau, with all other variables significantly increasing throughout the sampling day (Ta ble 3). These values are consistent with previous scalder and chiller tank assess- ments from within commercial processing facilities [13, 14], indicating that this study was run under normal in- dustry conditions. 3.2. Comparison of Processing Water Sampling Techniques Considering commercial poultry processing waters con- tain a variety of organic particulates (e.g. blood, feathers, oils/fats), two different water sampling methods were assessed for molecular analyses: 1) analysis of 1 mL of raw water sample, or 2) filtering 100 mL of processing water through a 0.8 μM filter (to remove particulates) and analyzing that cells in the filtrate. When looking at 16S rRNA gene copies (a molecular estimate of total bacteria) in these processing water samples, significantly higher total bacterial gene copies were recovered from both scalder (Figure 1(a)) and chiller (Figure 1(b)) wa- ters when using the 1 mL raw samples for both ddPCR (closed bars) and qPCR (open bars) as compared to the 100 mL filtrate samples. Additionally, 16S rRNA gene Copyright © 2013 SciRes. AiM 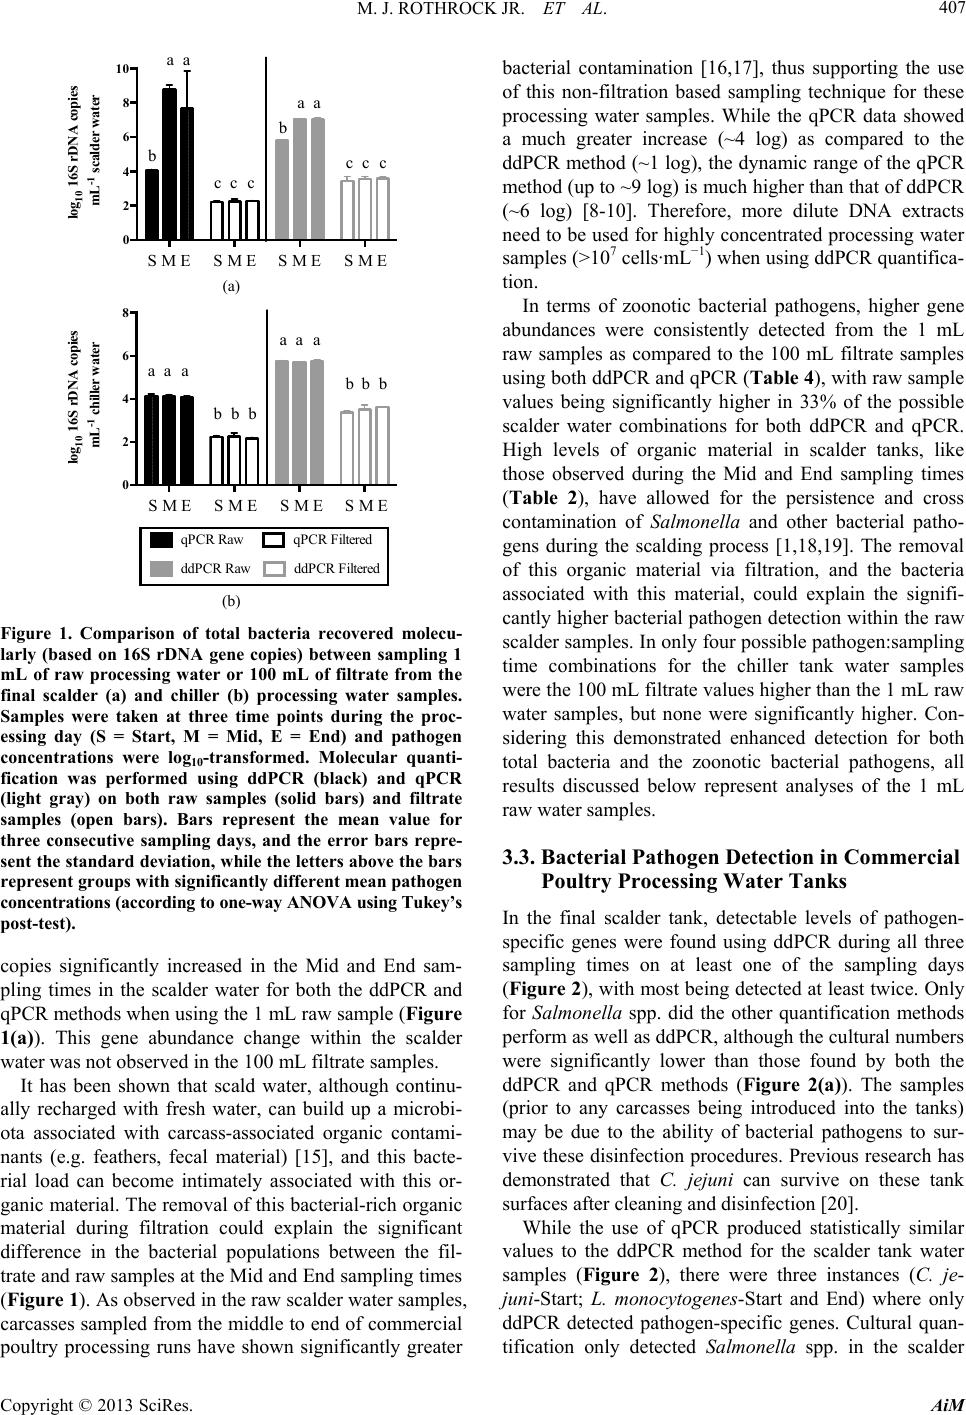 M. J. ROTHROCK JR. ET AL. 407 0 2 4 6 8 10 log 10 16S rDNA copie s mL -1 scalder water S M ES MES M ES M E A ccc ccc b b aa aa (a) 0 2 4 6 8 log 10 16S rDNA copies mL -1 chiller water qPCR Raw qPCR Filtered ddPCR RawddPCR Filtered S M ES M ES M ES M E bbb aaa bbb aaa B (b) Figure 1. Comparison of total bacteria recovered molecu- larly (based on 16S rDNA gene copies) between sampling 1 mL of raw processing water or 100 mL of filtrate from the final scalder (a) and chiller (b) processing water samples. Samples were taken at three time points during the proc- essing day (S = Start, M = Mid, E = End) and pathogen concentrations were log10-transformed. Molecular quanti- fication was performed using ddPCR (black) and qPCR (light gray) on both raw samples (solid bars) and filtrate samples (open bars). Bars represent the mean value for three consecutive sampling days, and the error bars repre- sent the standard deviation, while the letters above the bars represent groups with significantly different mean pathogen concentrations (according to one-way ANOVA using Tukey’s post-test). copies significantly increased in the Mid and End sam- pling times in the scalder water for both the ddPCR and qPCR methods when using the 1 mL raw sample (Figure 1(a)). This gene abundance change within the scalder water was not observed in the 100 mL filtrate samples. It has been shown that scald water, although continu- ally recharged with fresh water, can build up a microbi- ota associated with carcass-associated organic contami- nants (e.g. feathers, fecal material) [15], and this bacte- rial load can become intimately associated with this or- ganic material. The removal of this bacterial-rich organic material during filtration could explain the significant difference in the bacterial populations between the fil- trate and raw samples at the Mid and End sampling times (Figure 1). As observed in the raw scalder water samples, carcasses sampled from the middle to end of commercial poultry processing runs have shown significantly greater bacterial contamination [16,17], thus supporting the use of this non-filtration based sampling technique for these processing water samples. While the qPCR data showed a much greater increase (~4 log) as compared to the ddPCR method (~1 log), the dynamic range of the qPCR method (up to ~9 log) is much higher than that of ddPCR (~6 log) [8-10]. Therefore, more dilute DNA extracts need to be used for highly concentrated processing water samples (>107 cells·mL−1) when using ddPCR quantifica- tion. In terms of zoonotic bacterial pathogens, higher gene abundances were consistently detected from the 1 mL raw samples as compared to the 100 mL filtrate samples using both ddPCR and qPCR (Table 4), with raw sample values being significantly higher in 33% of the possible scalder water combinations for both ddPCR and qPCR. High levels of organic material in scalder tanks, like those observed during the Mid and End sampling times (Table 2), have allowed for the persistence and cross contamination of Salmonella and other bacterial patho- gens during the scalding process [1,18,19]. The removal of this organic material via filtration, and the bacteria associated with this material, could explain the signifi- cantly higher bacterial pathogen detection within the raw scalder samples. In only four possible pathogen:sampling time combinations for the chiller tank water samples were the 100 mL filtrate values higher than the 1 mL raw water samples, but none were significantly higher. Con- sidering this demonstrated enhanced detection for both total bacteria and the zoonotic bacterial pathogens, all results discussed below represent analyses of the 1 mL raw water samples. 3.3. Bacterial Pathogen Detection in Commercial Poultry Processing Water Tanks In the final scalder tank, detectable levels of pathogen- specific genes were found using ddPCR during all three sampling times on at least one of the sampling days (Figure 2), with most being detected at least twice. Only for Salmonella spp. did the other quantification methods perform as well as ddPCR, although the cultural numbers were significantly lower than those found by both the ddPCR and qPCR methods (Figure 2(a)). The samples (prior to any carcasses being introduced into the tanks) may be due to the ability of bacterial pathogens to sur- vive these disinfection procedures. Previous research has demonstrated that C. jejuni can survive on these tank surfaces after cleaning and disinfection [20]. While the use of qPCR produced statistically similar values to the ddPCR method for the scalder tank water samples (Figure 2), there were three instances (C. je- juni-Start; L. monocytogenes-Start and End) where only ddPCR detected pathogen-specific genes. Cultural quan- tification only detected Salmonella spp. in the scalder Copyright © 2013 SciRes. AiM  M. J. ROTHROCK JR. ET AL. Copyright © 2013 SciRes. AiM 408 Table 4. Comparison of 1 mL raw and 100 mL filtrate processing water-sampling techniques on recovered ddPCR- and qPCR-derived log10-transformed zoonotic pathogen concentrations1. ddPCR qPCR Final Scalder Tank Water Chiller Tank Water Final Scalder Tank Water Chiller Tank Water Target2 Sspp Cj Lm Sspp Cj Lm Sspp Cj Lm Sspp Cj Lm Raw 0.924 1.638 0.808 0.0000.8240.000 0.866 0.000 0.000 0.632 0.3940.373 Filtrate 0.261 0.000 0.000 0.6360.0000.000 0.002 0.000 0.000 0.158 0.0000.085 Start p-value3 0.4928 0.0452 0.5135 0.34690.3366>0.9990.0216 >0.999>0.999 0.4658 0.12850.4722 Raw 2.032 2.731 0.830 0.0000.8090.823 2.400 2.639 0.688 0.038 0.0000.689 Filtrate 0.317 0.147 0.000 0.0000.3011.508 0.143 0.000 0.000 0.000 0.1380.000Mid p-value 0.0222 0.00970.5018 >0.9990.5487 0.5461<0.00010.00200.1136 0.9528 0.57730.1014 Raw 1.092 1.165 0.846 1.0800.8101.660 0.675 1.148 0.000 0.883 0.0000.428 Filtrate 0.157 0.000 1.503 0.0000.1420.000 0.072 0.000 0.118 0.000 0.0190.000 End p-value 0.3379 0.19100.5937 0.12250.4328 0.15780.0905 0.11410.7738 0.1857 0.93890.2922 1Values represent log10-transformed means of zoonotic pathogen-specific gene abundances from three consecutive sampling days within the commercial poultry processing plant, and the p-values result from one-tailed t-tests; 2Pathogen abbreviations are: Sspp = Salmonella spp.; Cj = Campylobacter jejuni; Lm = Listeria monocytogenes; 3Bolded values indicate significant differences between the raw and filtered samples at the α = 0.05 level. log 10 Salmonella (copies or MPN) mL -1 scalder water Start Mid End -2 0 2 4 6 Cul t ural qPCR ddPCR A Start Mid End 0 1 2 3 4 5 og 10 . e uni ( op es or N) mL -1 scald er water Cultu al qPC R dd B tart Mid End 0 1 2 3 4 log 10 L. mono yto ene opies or N mL -1 scalder water Cultural qPCR ddPC R C (a) (b) (c) Figure 2. Quantification of zoonotic pathogens found within the final scalder tank of a commer cial poultry proce ssing faci lity. Samples were taken at three time points during the processing day (Star t, Mid, End) and log10-transformed pathogen quanti- fications were performed using ddPCR (checkered bars), qPCR (solid bars), and cultural methods (open bars). Bars repre- sent the mean value for three consecutive sampling days, and the error bars represent the standard deviation. Zoonotic pathogens tested for were (a) Salmonella spp.; (b) C. jejuni; and (c) L. monocytogenes. cial poultry processing plant [7]. The consistency of these ddPCR results with cultural results from previous commercial processing investigations, in addition to the significantly higher detection rate compared to cultural data from this current study, indicates the efficacy of ddPCR for bacterial pathogen detection within these samples. tank in two of the three sampling days, failing to detect and recover any of the other pathogens during this study. While these pathogens have been isolated from commer- cial scalder tanks previously [1,3,21,22], their recovery was significantly higher in the first two tanks of similar commercial triple scalder tank systems [19,23]; whereas the final scalder tank was sampled in the current study. While there are obvious arguments about the use of cultural versus molecular detection techniques (e.g. iso- lating a living organism versus the DNA signature of one), the ddPCR values for Salmonella were consistent with those found culturally in previous commercial scal- der tank studies [19,23]. Additionally, the ddPCR-based prevalence of C. jejuni and L. monocytogenes within the scalder water samples from this study were consistent with one of the few other studies to molecularly detect and culturally confirm these pathogens within a commer- In the chiller water samples, Salmonella spp., C. jejuni, and L. monocytogenes specific genes were detected in the End samples using ddPCR, and all but Salmonella spp. specific genes were present in the Mid samples (Figure 3). As was observed with the scalder water samples, ddPCR was able to detect pathogen-specific genes in more possible pathogen:sampling time combinations than either comparative quantification method. Pathogen de- tection in these chiller water samples was more sporadic than in the scalder tank samples, with ddPCR detecting  M. J. ROTHROCK JR. ET AL. 409 Start Mid End 0 2 4 6 o 10 Sa mone a (cop es or MPN) mL -1 chiller water Cultural qPCR ddPCR A (a) tart Mid End 0 1 2 3 4 5 log 10 C. jejuni (copies or CFU) mL -1 chiller wate r Cultural qPCR ddPCR B (b) log 10 L. monocytogenes (copies or MPN) mL -1 chiller water Start Mid End 0 1 2 3 4 Cultural qPCR ddPCR C (c) Figure 3. Quantification of zoonotic pathoge ns found within the chiller tank of a commercial poultry processing facility. Samples were taken at three time points during the proc- essing day (Start, Mid, End) and log10-transformed patho- gen quantifications were performed using ddPCR (check- ered bars) and qPCR (solid bars). None of the pathogens were recovered culturally from the chiller water Bars rep- resent the mean value for three consecutive sampling days, and the error bars represent the standard deviation. Zoono- tic pathogens tested for were (a) Salmonella spp., (b) C. jejuni, and (c) L. monocytogenes. these pathogens on only one of the three sampling days in most samples. Considering one of the main objectives is disinfection via chlorination in the chiller tank to re- duce bacterial loads [2,3,24], the lower and less consis- tent detection of pathogen-specific genes in this tank versus the scalder tank samples was expected. In com- parison to the qPCR-based method, ddPCR more consis- tently detected C. jejuni (Figure 3(b)) whereas qPCR more consistently detected Salmonella spp. (Figure 3( a)). The presence of each of these bacterial pathogens at some point during the processing run was surprising, but high organic matter loads (Table 3; COD, BOD) is known to reduce the bactericidal efficacy of chlorine within chiller tanks [1,25] None of the bacterial pathogens were detected cultur- ally from any of the chiller water samples. While Salmo- nella, C. jejuni, and L. monocytogenes have been previ- ously recovered culturally from commercial chiller tanks [1,2,7,21,26], chiller samples for this current study were retrieved from the distal end of the counterflow chiller tank (carcasses leave the tank and clean water enters the tank). This is important to note because ria, specifically Salmonella, cannot be detected using traditional culturing methods at the endpoint of the chiller tank, even if found in water samples from the proximal end of the tank [27]. It is also possible that the chlorine contained within these chiller samples confounded the cultural recovery, since its bactericidal effects potentially extended onto the se- lective media plates within the aliquot that was incubated. Considering the DNA extraction process claims to re- move contaminants such as chlorine, and ddPCR was the most robust pathogen quantification technique in the chiller water samples, ddPCR represents a powerful new tool effectively detect and quantify zoonotic pathogens within chiller water. 4. Conclusion These findings represent the first report of the use of third generation PCR technology to detect zoonotic bac- terial pathogen signatures in environmental samples along the poultry production continuum. While more validation of this ddPCR method needs to be performed on more poultry-related environmental sample types, the results of this study highlight the advantages of ddPCR and the potential for the integration of this highly sensi- tive and specific method into future poultry food safety research. Given the much higher throughput and absolute quantification of ddPCR while producing statistically similar results to qPCR in this study, this third generation technology represents a significant improvement in the molecular detection and quantification of zoonotic patho- gens in commercial industry environments. Obtaining cultural isolates is still essential within the regulatory framework of food safety research, but ddPCR represents a significant improvement in the ability to determine the presence and possible transmission of pathogen-specific genes within the poultry production environment, espe- cially given the low infectious dose of some of these zoonotic bacterial pathogens. 5. Acknowledgements The authors would like to acknowledge the expert tech- nical assistance of Latoya Wiggins, Nicole Bartenfeld, and Kathy Tate for their assistance in sampling and cul- Copyright © 2013 SciRes. AiM  M. J. ROTHROCK JR. ET AL. 410 tural work, as well as John Gamble and Laura Lee Ruth- erford for their assistance in sampling and molecular analyses. These investigations were supported equally by the Agricultural Research Service, USDA CRIS Projects “Pathogen Reduction and Processing Parameters in Poul- try Processing Systems” #6612-41420-017-00 and “Mo- lecular Approaches for the Characterization of Food- borne Pathogens in Poultry” #6612-32000-059-00. REFERENCES [1] S. Buncic and J. Sofos, “Interventions to Control Salmo- nella Contamination during Poultry, Cattle and Pig Slaughter,” Food Research International, Vol. 45, No. 2, 2012, pp. 641-655. doi:10.1016/j.foodres.2011.10.018 [2] J. M. Cox and A. Pavic, “Advances in Enteropathogen Control in Poultry Production,” Journal of Applied Mi- crobiology, Vol. 108, No. 3, 2010, pp. 745-755. doi:10.1111/j.1365-2672.2009.04456.x [3] S. Finstad, C. A. O’Bryan, J. A. Marcy, P. G. Crandall and S. C. Ricke, “Salmonella and Broiler Processing in the United States: Relationship to Foodborne Salmonello- sis,” Food Research International, Vol. 45, No. 2, 2012, pp. 789-794. doi:10.1016/j.foodres.2011.03.057 [4] C. R. Friedman, R. M. Hoekstra, M. Samuel, R. Marcus, J. Bender, B. Shiferaw, et al., “Risk Factors for Sporadic Campylobacter Infection in the United States: A Case- Control Study in FoodNet Sites,” Clincal Infectious Dis- ease, Vol. 38, Suppl. 3, 2004, pp. S285-S296. [5] E. M. Nielsen, V. Fussing, J. Engberg, N. L. Nielsen and J. Neimann, “Most Campylobacter Subtypes from Spo- radic Infections Can Be Found in Retail Poultry Products and Food Animals,” Epidemiology & Infection, Vol. 134, No. 4, 2006, pp. 758-767. doi:10.1017/S0950268805005509 [6] L. M. Lawrence and A. Gilmour, “Incidence of Listeria spp. and Listeria monocytogenes in Poultry Products and the Poultry Processing Environment, and Their Rapid Confirmation by Multiplex PCR,” Applied Environmental Microbiology, Vol. 60, No. 12, 1994, pp. 4600-4604. [7] M. G. R. Reiter, C. M. M. Bueno, C. Lopez and R. Jor- dano, “Occurrence of Campylobacter and Listeriamono- cytogenes in a Poultry Processing Plant,” Journal of Food Protection, Vol. 68, No. 9, 2005, pp. 1903-1906. [8] M. Baker, “Digital PCR Hits Its Stride,” Nature Methods, Vol. 9, No. 6, 2012, pp. 541-544. doi:10.1038/nmeth.2027 [9] L. B. Pinheiro, V. A. Coleman, C. M. Hindson, J. Herr- mann, B. J. Hindson, S. Bhat, et al., “Evaluation of a Dro- plet Digital Polymerase Chain Reaction Format for DNA Copy Number Quantification,” Analytical Chemistry, Vol. 84, No. 2, 2012, pp. 1003-1011. doi:10.1021/ac202578x [10] B. J. Hindson, K. D. Ness, D. A. Masquelier, P. Belgrader, N. J. Heredia, A. J. Makarewicz, et al., “High-Throughput Droplet Digital PCR System for Absolute Quantitation of DNA Copy Number,” Analytical Chemistry, Vol. 83, No. 22, 2011, pp. 8604-8610. doi:10.1021/ac202028g [11] N. J. Stern, B. Wojton and K. Kwiatek, “A Differential- Selective Medium and Dry Ice-Generated Atmosphere for Recovery of Campylobacterjejuni,” Journal of Food Pro- tection, Vol. 55, No. 7, 1992, pp. 514-517. [12] APHA, “Standard Methods for the Examination of Water and Wastewater,” 21st Edition, American Public Health Association, Washington DC, 2005, [13] D. Hamm, “Characteristics of Effluents in Ten South- eastern Poultry Processing Plants,” Poultry Science, Vol. 51, No. 3, 1972, pp. 825-829. doi:10.3382/ps.0510825 [14] W. C. Merka, “Processing Water and Wastewater,” In: A. R. Sams, Ed., Poultry Meat Processing, CRC Press LLC, Boca Raton, 2001, pp. 301-310. [15] F. L. Bryan and M. P. Doyle, “Health Risks and Conse- quences of Salmonella and Campylobacter jejuni in Raw Poultry,” Journal of Food Protection, Vol. 58, No. 3, 1995, pp. 326-344. [16] Z. Bełkot, “Bacterial Contamination of Chicken Car- casses as Influenced by the Time of Slaughter during the Day,” Medycyna Weterynaryjna, Vol. 67, No. 11, 2011, pp. 760-764. [17] P. Whyte, K. McGill, C. Monahan and J. D. Collins, “The Effect of Sampling Time on the Levels of Micro-Organ- isms Recovered from Broiler Carcasses in a Commercial Slaughter Plant,” Food Microbiology, Vol. 21, No. 1, 2004, pp. 59-65. doi:10.1016/S0740-0020(03)00040-6 [18] M. E. Berrang, J. A. Dickens and M. T. Musgrove, “Ef- fects of Hot Water Application after Defeathering on the Levels of Campylobacter, Coliform Bacteria, and Esche- richia coli on Broiler Carcasses,” Poultry Science, Vol. 79, No. 11, 2000, pp. 1689-1693. [19] J. A. Cason and A. Hinton Jr., “Coliforms, Escherichia- coli, Campylobacter, and Salmonella in a Counterflow Poultry Scalder with a Dip Tank,” International Journal of Poultry Science, Vol. 5, No. 9, 2006, pp. 846-849. doi:10.3923/ijps.2006.846.849 [20] M. B. Peyrat, C. Soumet, P. Maris and P. Sanders, “Re- covery of Campylobacterjejuni from Surfaces of Poultry Slaughterhouses after Cleaning and Disinfection Proce- dures: Analysis of a Potential Source of Carcass Con- tamination,” International Journal of Food Microbiology, Vol. 124, No. 2, 2008, pp. 188-194. doi:10.1016/j.ijfoodmicro.2008.03.030 [21] G. Figueroa, M. Troncoso, C. Ĺopez, P. Rivas and M. Toro, “Occurrence and Enumeration of Campylobacter spp. during the Processing of Chilean Broilers,” BMC Microbiology, Vol. 9, 2009, p. 94. [22] H. Yang, Y. Li and M. G. Johnson, “Survival and Death of Salmonella typhimurium and Campylobacterjejuni in Processing Water and on Chicken Skin during Poultry Scalding and Chilling,” Journal of Food Protection, Vol. 64, No. 6, 2001, pp. 770-776. [23] J. A. Cason, A. Hinton Jr. and K. D. Ingram, “Coliform, Escherichiacoli, and Salmonellae Concentrations in a Multiple-Tank, Counterflow Poultry Scalder,” Journal of Food Protection, Vol. 63, No. 9, 2000, pp. 1184-1188. [24] J. D. Stopforth, R. O’Connor, M. Lopes, W. E. Hill and M. Samadpour, “Validation of Individual and Multiple Sequential Interventions for Reduction of Microbial Po- pulations during Processing of Poultry Carcasses and Copyright © 2013 SciRes. AiM  M. J. ROTHROCK JR. ET AL. Copyright © 2013 SciRes. AiM 411 Parts,” Journal of Food Protection, Vol. 70, No. 6, 2007, pp. 1393-1401. [25] K. C. Tamblyn, D. E. Conner and S. F. Bilgili, “Utiliza- tion of the Skin Attachment Model (SAM) to Determine the Antibacterial Activity of Potential Carcass Treat- ments,” Poultry Science, Vol. 76, No. 9, 1997, pp. 1318- 1323. [26] C. Voidarou, D. Vassos, T. Kegos, A. Koutsotoli, A. Tsiotsias, J. Skoufos, et al., “Aerobic and Anaerobic Mi- crobiology of the Immersion Chilling Procedure during Poultry Processing,” Poultry Science, Vol. 86, No. 6, 2007, pp. 1218-1222. [27] J. K. Northcutt, D. Smith, R. I. Huezo and K. D. Ingram, “Microbiology of Broiler Carcasses and Chemistry of Chiller Water as Affected by Water Reuse,” Poultry Sci- ence, Vol. 87, No. 7, 2008, pp. 1458-1463. doi:10.3382/ps.2007-00480 [28] G. Harms, A. C. Layton, H. M. Dionisi, I. R. Gregory, V. M. Garrett, S. A. Hawkins, et al., “Real-Time PCR Quan- tification of Nitrifying Bacteria in a Municipal Wastewa- ter Treatment Plant,” Environmental Science and Tech- nology, Vol. 37, No. 2, 2003, pp. 343-351. doi:10.1021/es0257164 [29] B. Malorny, E. Paccassoni, P. Fach, C. Bunge, A. Martin and R. Helmuth, “Diagnostic Real-Time PCR for Detec- tion of Salmonella in Food,” Applied Environmental Mi- crobiology, Vol. 70, No. 12, 2004, pp. 7046-7052. doi:10.1128/AEM.70.12.7046-7052.2004 [30] Y. He, X. Yao, N. W. Gunther IV, Y. Xie, S.-I. Tu and X. Shi, “Simultaneous Detection and Differentiation of Cam- pylobacter jejuni, C. coli, and C. lari in Chickens Using a Multiplex Real-Time PCR Assay,” Food Analytical Me- thods, Vol. 3, No. 4, 2010, pp. 321-329. [31] B. Suo, Y. He, S.-I. Tu and X. Shi, “A Multiplex Real- Time Polymerase Chain Reaction for Simultaneous De- tection of Salmonells spp., Escherichia coli O157, and Listeria monocytogenes in Meat Products,” Foodborne Pathogens & Disease, Vol. 7, No. 6, 2010, pp. 619-628. doi:10.1089/fpd.2009.0430
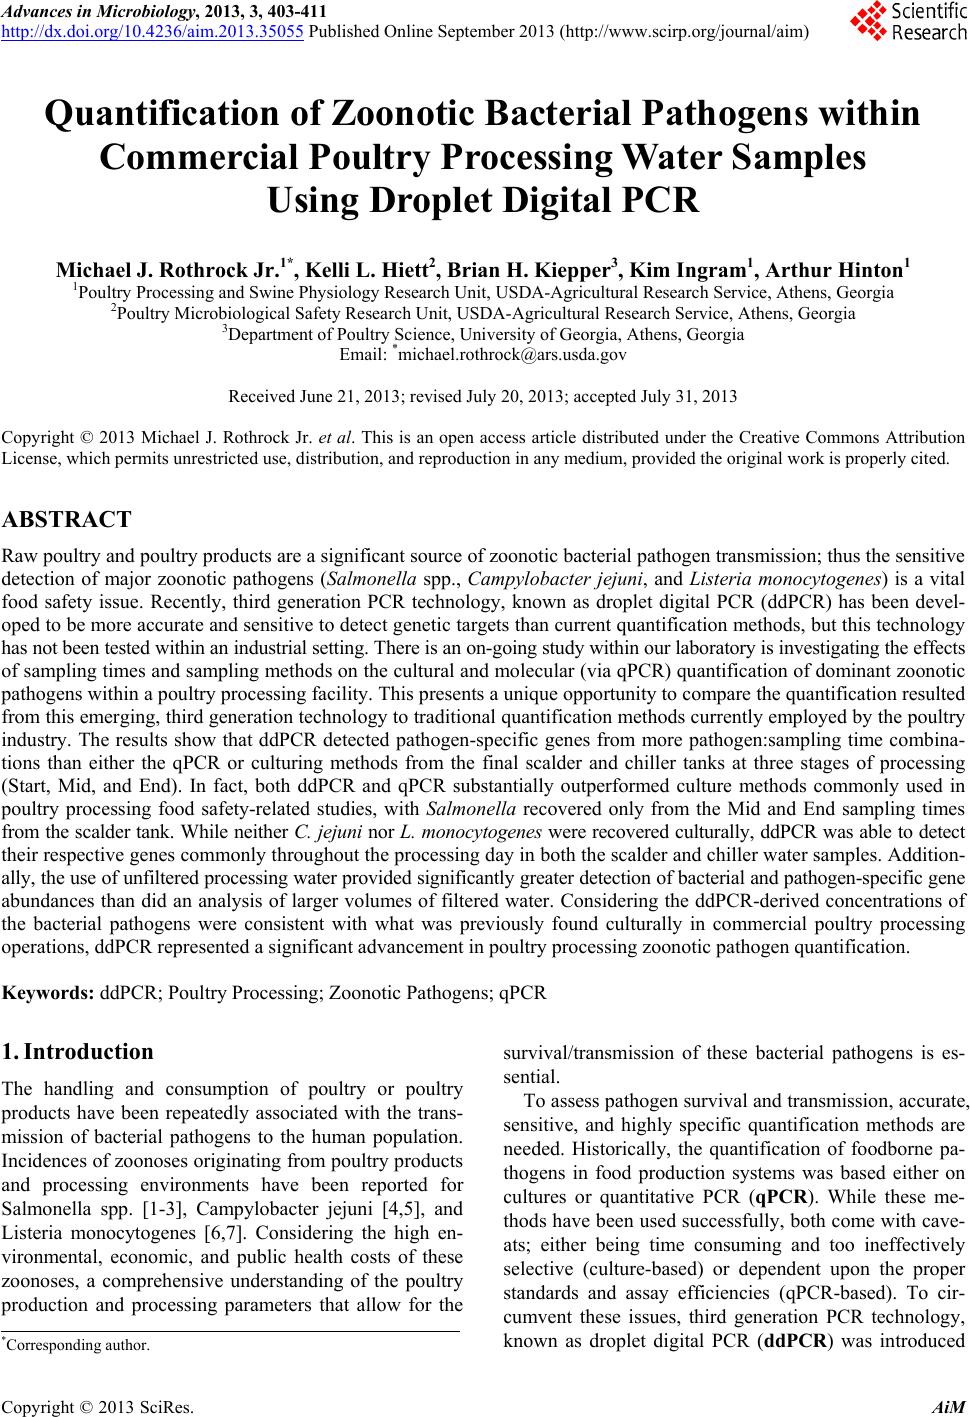
|