Paper Menu >>
Journal Menu >>
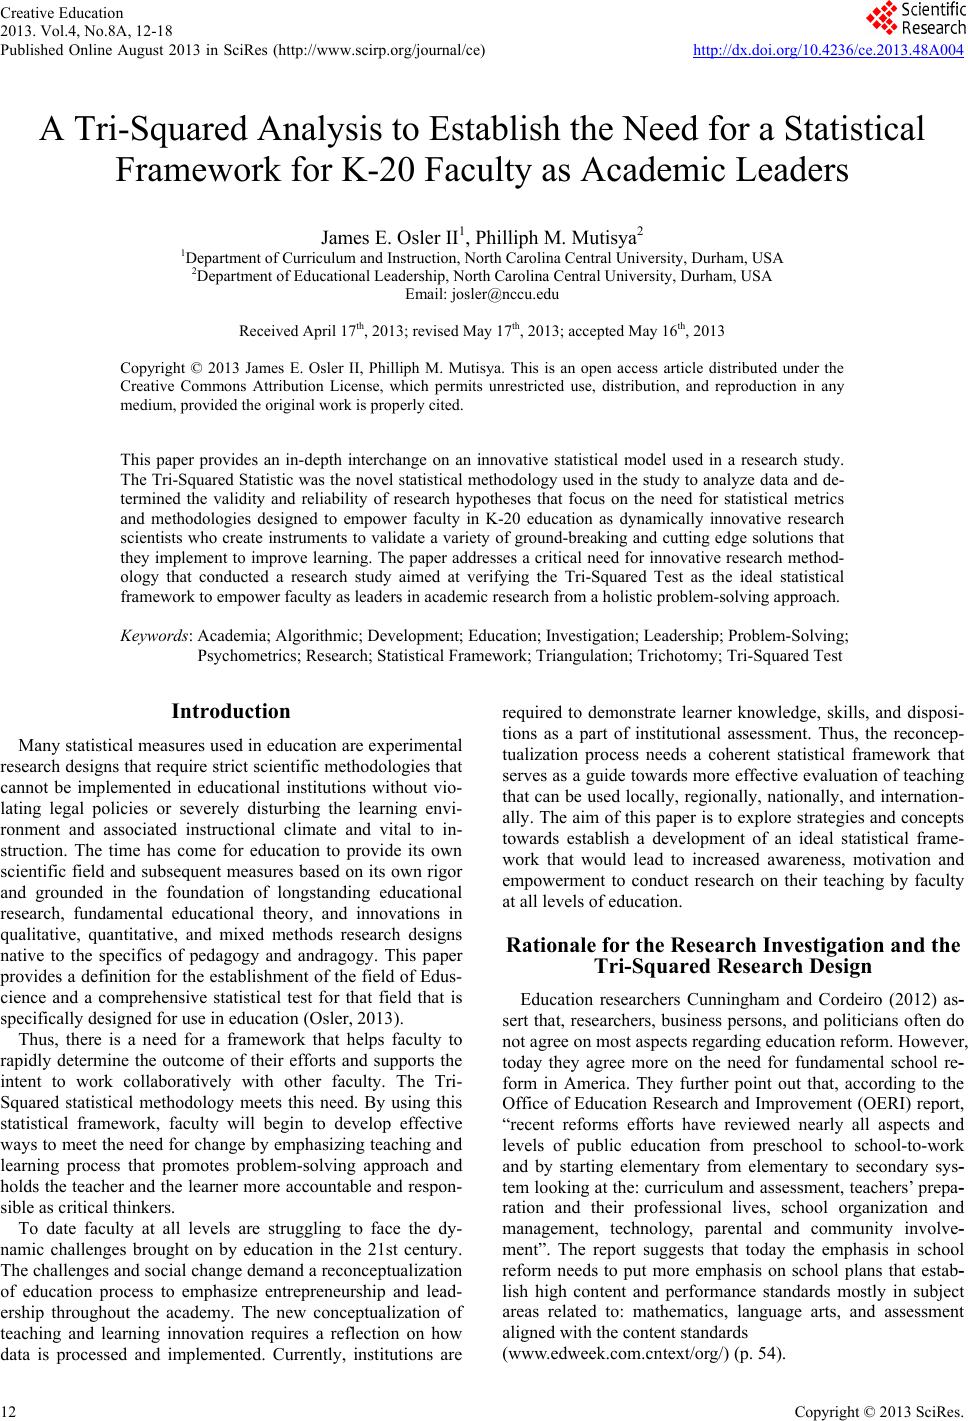 Creative Education 2013. Vol.4, No.8A, 12-18 Published Online August 2013 in SciRes (http://www.scirp.org/journal/ce) http://dx.doi.org/10.4236/ce.2013.48A004 Copyright © 2013 SciRes. 12 A Tri-Squared Analysis to Establish the Need for a Statistical Framework for K-20 Faculty as Academic Leaders James E. Osler II1, Philliph M. Mutisya2 1Department of Curriculum and Instruction, North Carolina Central University, Durham, USA 2Department of Educational Leadership, North Carolina Central University, Durham, USA Email: josler@nccu.edu Received April 17th, 2013; revised May 17th, 2013; accepted May 16th, 2013 Copyright © 2013 James E. Osler II, Philliph M. Mutisya. This is an open access article distributed under the Creative Commons Attribution License, which permits unrestricted use, distribution, and reproduction in any medium, provided the original work is properly cited. This paper provides an in-depth interchange on an innovative statistical model used in a research study. The Tri-Squared Statistic was the novel statistical methodology used in the study to analyze data and de- termined the validity and reliability of research hypotheses that focus on the need for statistical metrics and methodologies designed to empower faculty in K-20 education as dynamically innovative research scientists who create instruments to validate a variety of ground-breaking and cutting edge solutions that they implement to improve learning. The paper addresses a critical need for innovative research method- ology that conducted a research study aimed at verifying the Tri-Squared Test as the ideal statistical framework to empower faculty as leaders in academic research from a holistic problem-solving approach. Keywords: Academia; Algorithmic; Development; Education; Investigation; Leadership; Problem-Solving; Psychometrics; Research; Statistical Framework; Triangulation; Trichotomy; Tri-Squared Test Introduction Many statistical measures used in education are experimental research designs that require strict scientific methodologies that cannot be implemented in educational institutions without vio- lating legal policies or severely disturbing the learning envi- ronment and associated instructional climate and vital to in- struction. The time has come for education to provide its own scientific field and subsequent measures based on its own rigor and grounded in the foundation of longstanding educational research, fundamental educational theory, and innovations in qualitative, quantitative, and mixed methods research designs native to the specifics of pedagogy and andragogy. This paper provides a definition for the establishment of the field of Edus- cience and a comprehensive statistical test for that field that is specifically designed for use in education (Osler, 2013). Thus, there is a need for a framework that helps faculty to rapidly determine the outcome of their efforts and supports the intent to work collaboratively with other faculty. The Tri- Squared statistical methodology meets this need. By using this statistical framework, faculty will begin to develop effective ways to meet the need for change by emphasizing teaching and learning process that promotes problem-solving approach and holds the teacher and the learner more accountable and respon- sible as critical thinkers. To date faculty at all levels are struggling to face the dy- namic challenges brought on by education in the 21st century. The challenges and social change demand a reconceptualization of education process to emphasize entrepreneurship and lead- ership throughout the academy. The new conceptualization of teaching and learning innovation requires a reflection on how data is processed and implemented. Currently, institutions are required to demonstrate learner knowledge, skills, and disposi- tions as a part of institutional assessment. Thus, the reconcep- tualization process needs a coherent statistical framework that serves as a guide towards more effective evaluation of teaching that can be used locally, regionally, nationally, and internation- ally. The aim of this paper is to explore strategies and concepts towards establish a development of an ideal statistical frame- work that would lead to increased awareness, motivation and empowerment to conduct research on their teaching by faculty at all levels of education. Rationale for the Research Investigation and the Tri-Squared Research Design Education researchers Cunningham and Cordeiro (2012) as- sert that, researchers, business persons, and politicians often do not agree on most aspects regarding education reform. However, today they agree more on the need for fundamental school re- form in America. They further point out that, according to the Office of Education Research and Improvement (OERI) report, “recent reforms efforts have reviewed nearly all aspects and levels of public education from preschool to school-to-work and by starting elementary from elementary to secondary sys- tem looking at the: curriculum and assessment, teachers’ prepa- ration and their professional lives, school organization and management, technology, parental and community involve- ment”. The report suggests that today the emphasis in school reform needs to put more emphasis on school plans that estab- lish high content and performance standards mostly in subject areas related to: mathematics, language arts, and assessment aligned with the content standards (www.edweek.com.cntext/org/) (p. 54). 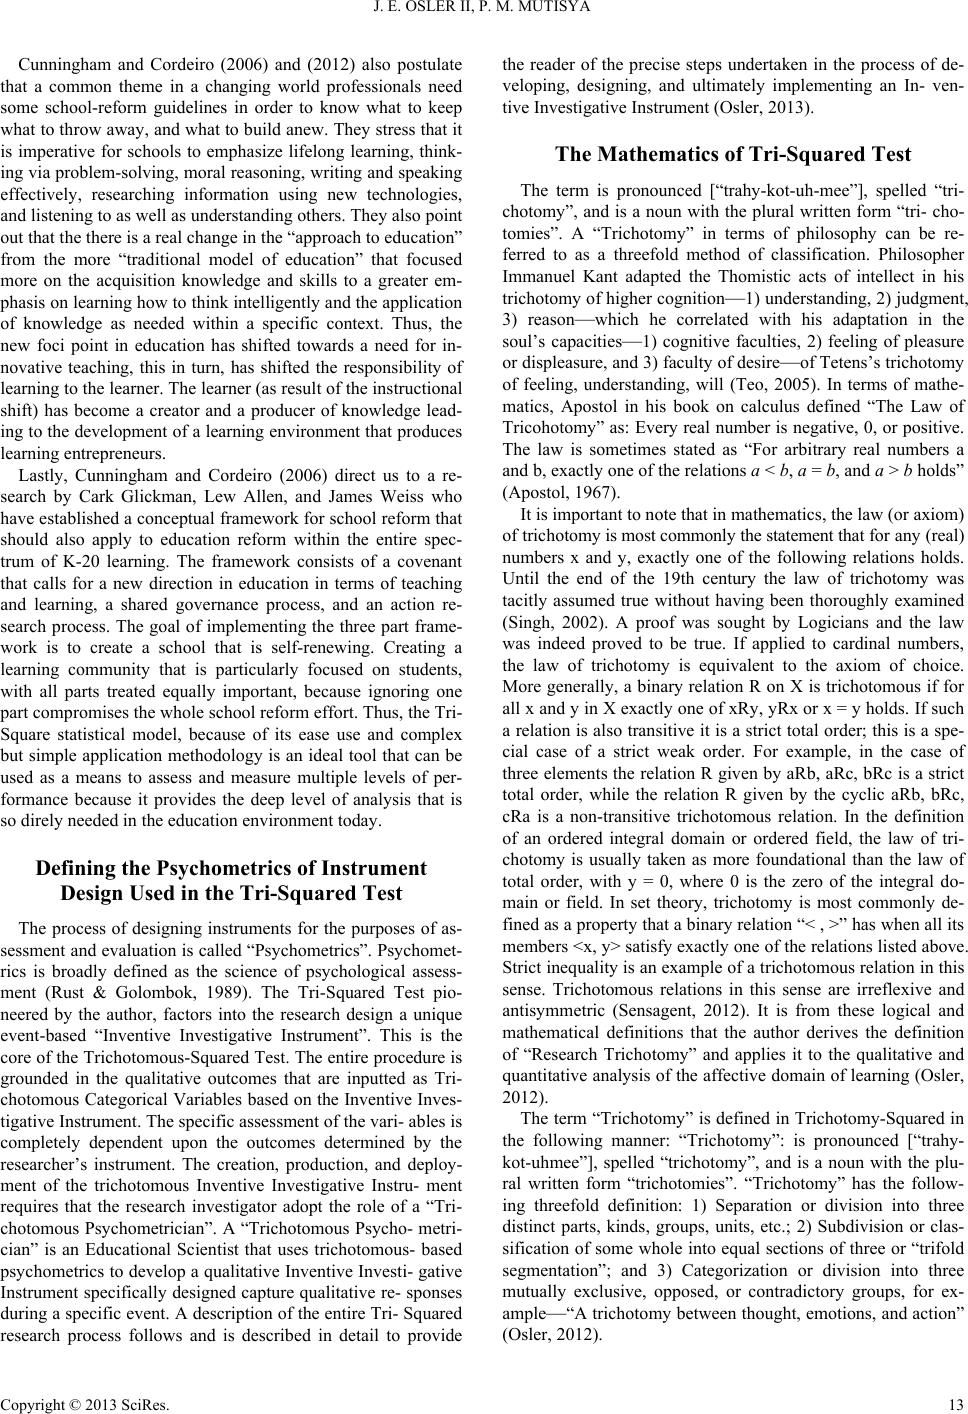 J. E. OSLER II, P. M. MUTISYA Cunningham and Cordeiro (2006) and (2012) also postulate that a common theme in a changing world professionals need some school-reform guidelines in order to know what to keep what to throw away, and what to build anew. They stress that it is imperative for schools to emphasize lifelong learning, think- ing via problem-solving, moral reasoning, writing and speaking effectively, researching information using new technologies, and listening to as well as understanding others. They also point out that the there is a real change in the “approach to education” from the more “traditional model of education” that focused more on the acquisition knowledge and skills to a greater em- phasis on learning how to think intelligently and the application of knowledge as needed within a specific context. Thus, the new foci point in education has shifted towards a need for in- novative teaching, this in turn, has shifted the responsibility of learning to the learner. The learner (as result of the instructional shift) has become a creator and a producer of knowledge lead- ing to the development of a learning environment that produces learning entrepreneurs. Lastly, Cunningham and Cordeiro (2006) direct us to a re- search by Cark Glickman, Lew Allen, and James Weiss who have established a conceptual framework for school reform that should also apply to education reform within the entire spec- trum of K-20 learning. The framework consists of a covenant that calls for a new direction in education in terms of teaching and learning, a shared governance process, and an action re- search process. The goal of implementing the three part frame- work is to create a school that is self-renewing. Creating a learning community that is particularly focused on students, with all parts treated equally important, because ignoring one part compromises the whole school reform effort. Thus, the Tri- Square statistical model, because of its ease use and complex but simple application methodology is an ideal tool that can be used as a means to assess and measure multiple levels of per- formance because it provides the deep level of analysis that is so direly needed in the education environment today. Defining the Psychometrics of Instrument Design Used in the Tri-Squared Test The process of designing instruments for the purposes of as- sessment and evaluation is called “Psychometrics”. Psychomet- rics is broadly defined as the science of psychological assess- ment (Rust & Golombok, 1989). The Tri-Squared Test pio- neered by the author, factors into the research design a unique event-based “Inventive Investigative Instrument”. This is the core of the Trichotomous-Squared Test. The entire procedure is grounded in the qualitative outcomes that are inputted as Tri- chotomous Categorical Variables based on the Inventive Inves- tigative Instrument. The specific assessment of the vari- ables is completely dependent upon the outcomes determined by the researcher’s instrument. The creation, production, and deploy- ment of the trichotomous Inventive Investigative Instru- ment requires that the research investigator adopt the role of a “Tri- chotomous Psychometrician”. A “Trichotomous Psycho- metri- cian” is an Educational Scientist that uses trichotomous- based psychometrics to develop a qualitative Inventive Investi- gative Instrument specifically designed capture qualitative re- sponses during a specific event. A description of the entire Tri- Squared research process follows and is described in detail to provide the reader of the precise steps undertaken in the process of de- veloping, designing, and ultimately implementing an In- ven- tive Investigative Instrument (Osler, 2013). The Mathematics of Tri-Squared Test The term is pronounced [“trahy-kot-uh-mee”], spelled “tri- chotomy”, and is a noun with the plural written form “tri- cho- tomies”. A “Trichotomy” in terms of philosophy can be re- ferred to as a threefold method of classification. Philosopher Immanuel Kant adapted the Thomistic acts of intellect in his trichotomy of higher cognition—1) understanding, 2) judgment, 3) reason—which he correlated with his adaptation in the soul’s capacities—1) cognitive faculties, 2) feeling of pleasure or displeasure, and 3) faculty of desire—of Tetens’s trichotomy of feeling, understanding, will (Teo, 2005). In terms of mathe- matics, Apostol in his book on calculus defined “The Law of Tricohotomy” as: Every real number is negative, 0, or positive. The law is sometimes stated as “For arbitrary real numbers a and b, exactly one of the relations a < b, a = b, and a > b holds” (Apostol, 1967). It is important to note that in mathematics, the law (or axiom) of trichotomy is most commonly the statement that for any (real) numbers x and y, exactly one of the following relations holds. Until the end of the 19th century the law of trichotomy was tacitly assumed true without having been thoroughly examined (Singh, 2002). A proof was sought by Logicians and the law was indeed proved to be true. If applied to cardinal numbers, the law of trichotomy is equivalent to the axiom of choice. More generally, a binary relation R on X is trichotomous if for all x and y in X exactly one of xRy, yRx or x = y holds. If such a relation is also transitive it is a strict total order; this is a spe- cial case of a strict weak order. For example, in the case of three elements the relation R given by aRb, aRc, bRc is a strict total order, while the relation R given by the cyclic aRb, bRc, cRa is a non-transitive trichotomous relation. In the definition of an ordered integral domain or ordered field, the law of tri- chotomy is usually taken as more foundational than the law of total order, with y = 0, where 0 is the zero of the integral do- main or field. In set theory, trichotomy is most commonly de- fined as a property that a binary relation “< , >” has when all its members <x, y> satisfy exactly one of the relations listed above. Strict inequality is an example of a trichotomous relation in this sense. Trichotomous relations in this sense are irreflexive and antisymmetric (Sensagent, 2012). It is from these logical and mathematical definitions that the author derives the definition of “Research Trichotomy” and applies it to the qualitative and quantitative analysis of the affective domain of learning (Osler, 2012). The term “Trichotomy” is defined in Trichotomy-Squared in the following manner: “Trichotomy”: is pronounced [“trahy- kot-uhmee”], spelled “trichotomy”, and is a noun with the plu- ral written form “trichotomies”. “Trichotomy” has the follow- ing threefold definition: 1) Separation or division into three distinct parts, kinds, groups, units, etc.; 2) Subdivision or clas- sification of some whole into equal sections of three or “trifold segmentation”; and 3) Categorization or division into three mutually exclusive, opposed, or contradictory groups, for ex- ample—“A trichotomy between thought, emotions, and action” (Osler, 2012). Copyright © 2013 SciRes. 13  J. E. OSLER II, P. M. MUTISYA Rationale for the Tri-Squared Research Statistic and Associated Research Methodology The Tri-Squared statistical model was used to analyze data to determine the attitudes and perceptions of faculty as leaders. Many statistical measures used in education are experimental research designs that require strict scientific methodologies that cannot be implemented in educational institutions without vio- lating legal policies or severely disturbing the learning envi- ronment and associated instructional climate that is vital to instruction. To promote the previously mentioned efforts to- wards empowering faculty in the areas of: social justice, em- powerment, and environmental equity novel statistical meas- ures and methods are required that are specifically designed for education and educational environmental needs. The time has come for education to provide its own scientific field and sub- sequent measures based in its own rigor and grounded in the foundation of longstanding educational research, fundamental educational theory, and innovations in qualitative, quantitative, and mixed methods research designs native to the specifics of pedagogy and andragogy (Osler, 2012). The Total Transformative Trichotomous-Squared Test pro- vides a methodology for the transformation of the outcomes from qualitative research into measurable quantitative values that are used to test the validity of hypotheses. The advantage of this research procedure is that it is a comprehensive holistic testing methodology that is designed to be static way of holis- tically measuring categorical variables directly applicable to educational and social behavioral environments where the es- tablished methods of pure experimental designs are easily vio- lated. The unchanging base of the Tri-Squared Test is the 3 × 3 Table based on Trichotomous Categorical Variables and Tri- chotomous Outcome Variables (see Table One Sample Re- search Report Table in the Appendices on p. 8). The emphasis the three distinctive variables provide a thorough rigorous ro- bustness to the test that yields enough outcomes to determine if differences truly exist in the environment in which the research takes place (see Table Two Sample Research Report Table in the Appendices on p. 11 and the Calculated Tri-Squared Table on p. 9). The Tri-Squared research procedure uses an innova- tive series of mathematical formulae that do the following as a comprehensive whole: 1) Convert qualitative data into quantita- tive data; 2) Analyze inputted trichotomous qualitative out- comes; 3) Transform inputted trichotomous qualitative out- comes into outputted quantitative outcomes; and 4) Create a standalone distribution for the analysis possible outcomes and to establish an effective––research effect size and sample size (see Figures 3 and 4 in the Appendices p. 11, respectively) with an associated alpha level to test the validity of an established research hypothesis (Osler, 2013). The Trichotomy-Squared Operational Methodology: The Tri-Squared Test Research Design The Tri-Squared Research Design Methods as used in this Study were conducted in the following four steps: 1) Design of an Inventive Investigative Instrument that has Trichotomous Categorical Variables and Trichotomous Out- come Variables based upon the initial research questions and hypotheses through a comprehensive holistic research Algo- rithmic Model of Tri-Squared Triangulation (Figure 1); Figure 1. The algorithmic model of Tri-Squared Triangulation. where, Vertex a = a = “authoring” = Constructing the Initial Tri-Squared Instrument Design; Vertex b = ∟b = “building” = Collecting the Tri-Squared Qualitative Instrument Responses; and Vertex c = c = “conveying” = Completing the final Tri-Squared Test Outcomes in a Comprehensive Quantitative Report. This model is exemplified in the Tri-Squared Test Standard 3 × 3 table is used to aggregate and report the Quali- tative Data outcomes (see Table 1); 2) Establish the research effect size, sample size with associ- ated Alpha level using the Tri-Squared Distribution table (with effect sizes and sample sizes [n] in intervals according to de- grees of freedom [d.f.] (see Table 2) and an associated Tri-Squared Probability Distribution Table (see Table 3); 3) Establish Mathematical Hypotheses; 4) Use the Tri-Squared Test as the data analysis procedure following the implementation of the inventive investigative instrument. This is the final step in the Tri-Squared Test (an example of the research design reporting methodology follows in the Standard Tri-Squared 3 × 3 Tabular Format can be found in the Appendices). The Tri-Squared Formula and Calculation Methodology The Tri-Squared Calculation: An example of how the 3 × 3 table of the quantitative output outcomes are determined as a result of the Tri-Squared Test formula: 2 2: s um xyy TriTTri TriTri where, the 3 × 3 Table of the Quantitative Output Outcomes = a1 a2 a3 b1 11rc Tri TT T 11 ab 12rc Tri TT T 21 ab 13rc Tri TT T 31 ab b2 11rc Tri TT T 12 ab 22rc Tri TT T 22 ab 23rc Tri TT T 32 ab b3 31rc Tri TT T 13 ab 32rc Tri TT T 23 ab 33rc Tri TT T 33 ab Trichotomous Transformation Conversion Input Variables = [a1], [a2], and [a3]. Trichotomous Transformation Conversion Output Variables = [b1], [b2], and [b3]. The Tri-Squared Test Standard 3 × 3 Transformation Table is used to transform the inputted Qualitative Data outcomes into outputted Quantitative Data Results and it is written in the fol- lowing format for the Transformation of Trichotomous Qualita- tive Outcomes into Trichotomous Quantitative Outcomes to Determine the Validity of the Research Hypothesis: 1) Detail the Previously Determined Tri-Squared Hypothesis Test: Re- Copyright © 2013 SciRes. 14  J. E. OSLER II, P. M. MUTISYA Copyright © 2013 SciRes. 15 Table 1. Determining the need for faculty as academic leaders through an in-depth research instrument to establish the Tri-Squared test as an effective statisti- cal model. This section of the survey is designed to assess the current level of collegiality at your institution. Please place and (X) in the box that best represents your response to the statement. Strongly Disagree Disagree Agree Strongly Agree 1) The relationship between the administration and faculty senate/council is collegial. 2) The relationship between non-senate faculty and faculty senators/council representative is collegial. 3) The relationship between the administration and staff senate is collegial. 4) The relationship between the administration and non-senate staff is collegial. 5) The relationship between the administration and undergraduate students is collegial. 6) The relationship between the administration and graduate students is collegial. 7) The relationship between the faculty and undergraduate students. 8) The relationship between the faculty and graduate students. 9) Faculty senate has a powerful position in influencing the university’s agenda. 10) Faculty senate has a powerful position in influencing educational policy. 11) Faculty senate has a powerful position in enforcing administrative accountability. 12) Faculty senate has a powerful position in creating university mandates. 13) What are the three (3) most common issues that face your institution regarding shared governance? ________________________________________________________________________________________________________________ ________________________________________________________________________________________________________________ 14) What changes should be made in order to promote increased shared governance at your institution? Please write comments below: ________________________________________________________________________________________________________________ ________________________________________________________________________________________________________________ This section of the survey is designed to assess the current perceptions of administrative officers at your institution. Please place and (X) in the box or space that best represents your response to the stated question. 15) The administration is in-touch with university problems. 16) The administration consults faculty senate, faculty on university matters prior to making decisions. 17) The administration takes faculty senate/faculty concerns seriously. 18) The administration has a genuine interest in shared governance. 19) The administration has a genuine respect for the faculty. 20) The university administrators are open to change. 21) Faculty senate and the administration have mutual respect for one another. 22) Faculty senate and the administration have mutual trust. 23) Faculty senate and the administration have mutual openness with each other (Transparency). 24) Faculty senate and the administration have an equal partnership in governance in protecting Academic Freedom. 25) As a faculty member, I am a leader within my department/academic unit. 26) As a faculty member, I am a leader within the university at large. 27) As a faculty member, I am a leader within my academic discipline/ field. Demograp hi cs 28) Ethnicity African-American White Asian Other Hispanic 29) Sex Female Male 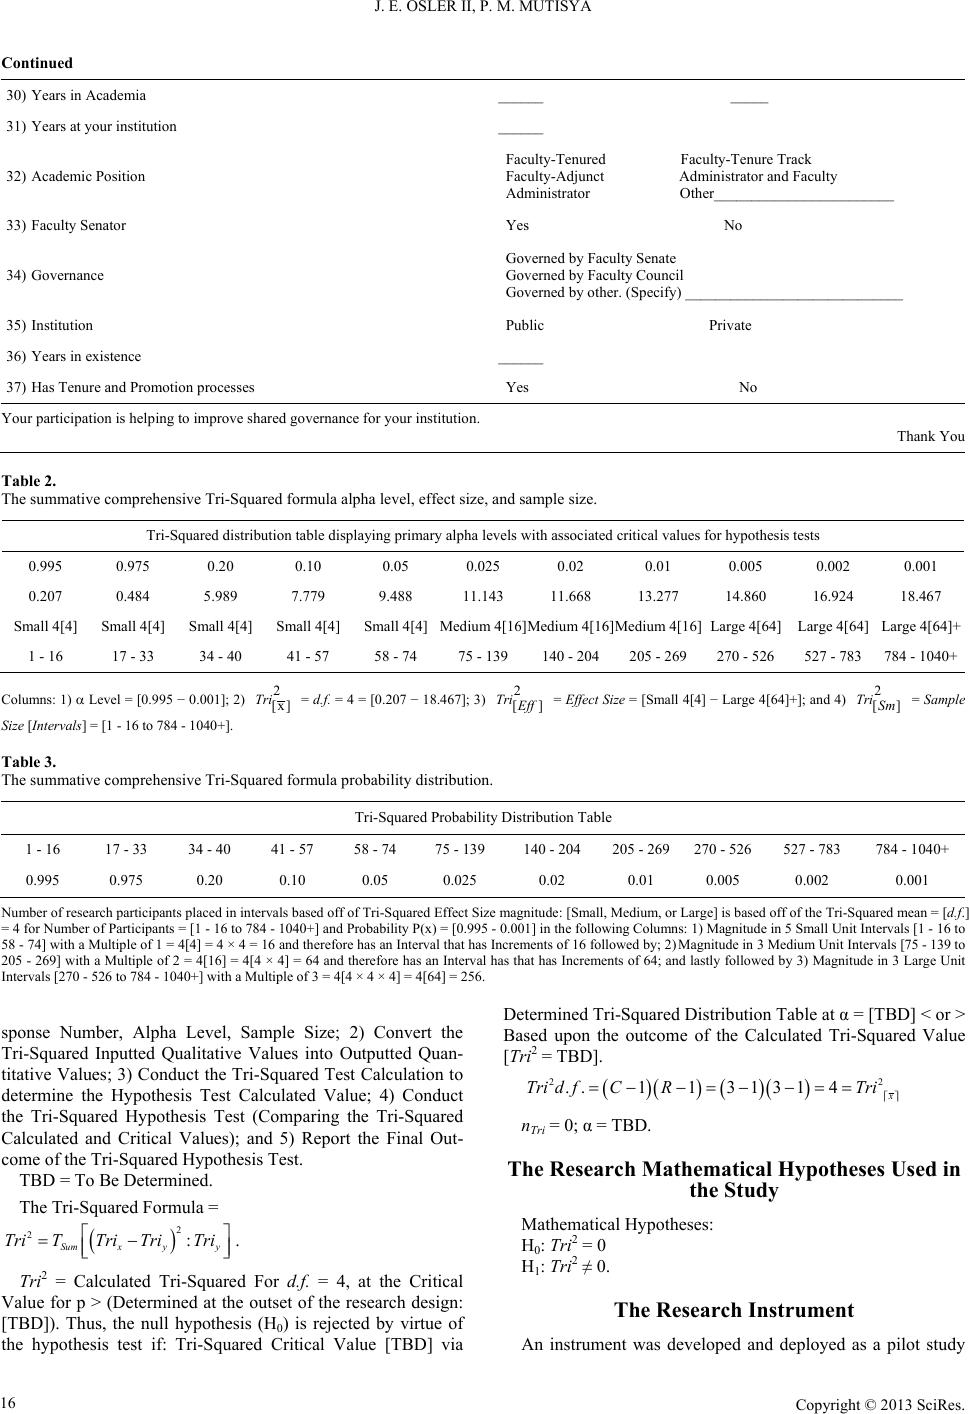 J. E. OSLER II, P. M. MUTISYA Continued 30) Years in Academia ______ _____ 31) Years at your institution ______ 32) Academic Position Faculty-Tenured Faculty-Tenure Track Faculty-Adjunct Administrator and Faculty Administrator Other________________________ 33) Faculty Senator Yes No 34) Governance Governed by Faculty Senate Governed by Faculty Council Governed by other. (Specify) _____________________________ 35) Institution Public Private 36) Years in existence ______ 37) Has Tenure and Promotion processes Yes No Your participation is helping to improve shared governance for your institution. Thank You Table 2. The summative comprehensive Tri-Squared formula alpha level, effect size, and sample size. Tri-Squared distribution table displaying primary alpha levels with associated critical values for hypothesis tests 0.995 0.975 0.20 0.10 0.05 0.025 0.02 0.01 0.005 0.002 0.001 0.207 0.484 5.989 7.779 9.488 11.143 11.668 13.277 14.860 16.924 18.467 Small 4[4] Small 4[4] Small 4[4]Small 4[4] Small 4[4]Medium 4[16]Medium 4[16]Medium 4[16]Large 4[64] Large 4[64] Large 4[64]+ 1 - 16 17 - 33 34 - 40 41 - 57 58 - 74 75 - 139 140 - 204 205 - 269 270 - 526 527 - 783 784 - 1040+ Columns: 1) Level = [0.995 − 0.001]; 2) 2 [x] Tri 2 [] Tri Eff 2 [] Tri Sm = d.f. = 4 = [0.207 − 18.467]; 3) = Effect Size = [Small 4[4] − Large 4[64]+]; and 4) = Sample Size [Intervals] = [1 - 16 to 784 - 1040+]. Table 3. The summative comprehensive Tri-Squared formula probability distribution. Tri-Squared Probability Distribution Table 1 - 16 17 - 33 34 - 40 41 - 57 58 - 74 75 - 139 140 - 204 205 - 269270 - 526 527 - 783 784 - 1040+ 0.995 0.975 0.20 0.10 0.05 0.025 0.02 0.01 0.005 0.002 0.001 Number of research participants placed in intervals based off of Tri-Squared Effect Size magnitude: [Small, Medium, or Large] is based off of the Tri-Squared mean = [d.f.] = 4 for Number of Participants = [1 - 16 to 784 - 1040+] and Probability P(x) = [0.995 - 0.001] in the following Columns: 1) Magnitude in 5 Small Unit Intervals [1 - 16 to 58 - 74] with a Multiple of 1 = 4[4] = 4 × 4 = 16 and therefore has an Interval that has Increments of 16 followed by; 2) Magnitude in 3 Medium Unit Intervals [75 - 139 to 205 - 269] with a Multiple of 2 = 4[16] = 4[4 × 4] = 64 and therefore has an Interval has that has Increments of 64; and lastly followed by 3) Magnitude in 3 Large Unit Intervals [270 - 526 to 784 - 1040+] with a Multiple of 3 = 4[4 × 4 × 4] = 4[64] = 256. sponse Number, Alpha Level, Sample Size; 2) Convert the Tri-Squared Inputted Qualitative Values into Outputted Quan- titative Values; 3) Conduct the Tri-Squared Test Calculation to determine the Hypothesis Test Calculated Value; 4) Conduct the Tri-Squared Hypothesis Test (Comparing the Tri-Squared Calculated and Critical Values); and 5) Report the Final Out- come of the Tri-Squared Hypothesis Test. TBD = To Be Determined. The Tri-Squared Formula = . 2 2: Sum xyy TriTTri TriTri Tri2 = Calculated Tri-Squared For d.f. = 4, at the Critical Value for p > (Determined at the outset of the research design: [TBD]). Thus, the null hypothesis (H0) is rejected by virtue of the hypothesis test if: Tri-Squared Critical Value [TBD] via Determined Tri-Squared Distribution Table at α = [TBD] < or > Based upon the outcome of the Calculated Tri-Squared Value [Tri2 = TBD]. 2 2 ..113131 4x Tri dfCRTri nTri = 0; α = TBD. The Research Mathematical Hypotheses Used in the Study Mathematical Hypotheses: H0: Tri2 = 0 H1: Tri2 ≠ 0. The Research Instrument An instrument was developed and deployed as a pilot study Copyright © 2013 SciRes. 16 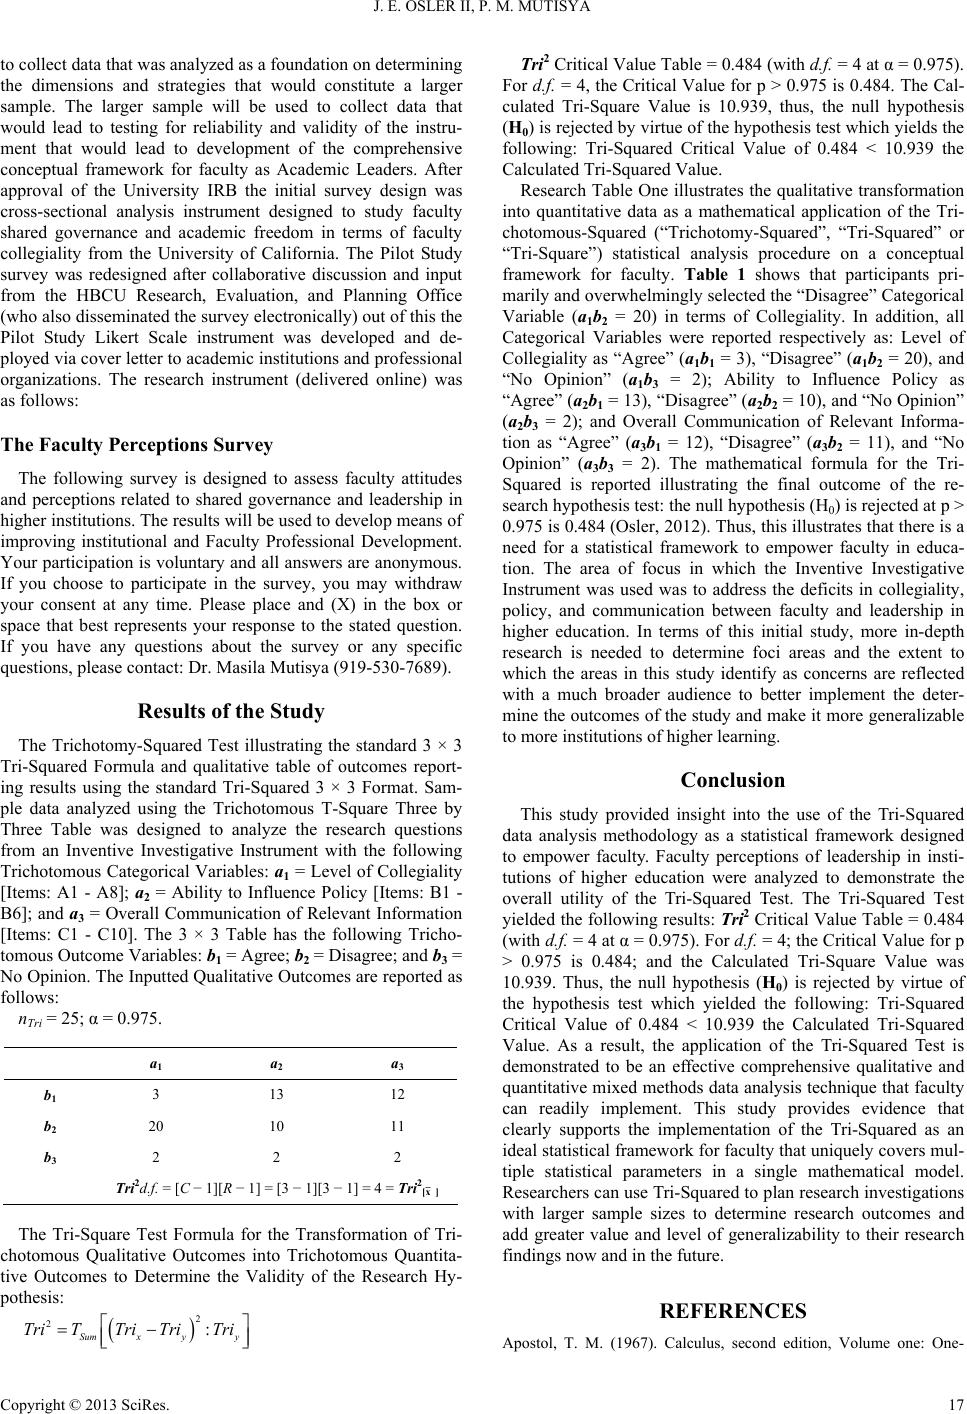 J. E. OSLER II, P. M. MUTISYA to collect data that was analyzed as a foundation on determining the dimensions and strategies that would constitute a larger sample. The larger sample will be used to collect data that would lead to testing for reliability and validity of the instru- ment that would lead to development of the comprehensive conceptual framework for faculty as Academic Leaders. After approval of the University IRB the initial survey design was cross-sectional analysis instrument designed to study faculty shared governance and academic freedom in terms of faculty collegiality from the University of California. The Pilot Study survey was redesigned after collaborative discussion and input from the HBCU Research, Evaluation, and Planning Office (who also disseminated the survey electronically) out of this the Pilot Study Likert Scale instrument was developed and de- ployed via cover letter to academic institutions and professional organizations. The research instrument (delivered online) was as follows: The Faculty Perceptions Survey The following survey is designed to assess faculty attitudes and perceptions related to shared governance and leadership in higher institutions. The results will be used to develop means of improving institutional and Faculty Professional Development. Your participation is voluntary and all answers are anonymous. If you choose to participate in the survey, you may withdraw your consent at any time. Please place and (X) in the box or space that best represents your response to the stated question. If you have any questions about the survey or any specific questions, please contact: Dr. Masila Mutisya (919-530-7689). Results of the Study The Trichotomy-Squared Test illustrating the standard 3 × 3 Tri-Squared Formula and qualitative table of outcomes report- ing results using the standard Tri-Squared 3 × 3 Format. Sam- ple data analyzed using the Trichotomous T-Square Three by Three Table was designed to analyze the research questions from an Inventive Investigative Instrument with the following Trichotomous Categorical Variables: a1 = Level of Collegiality [Items: A1 - A8]; a2 = Ability to Influence Policy [Items: B1 - B6]; and a3 = Overall Communication of Relevant Information [Items: C1 - C10]. The 3 × 3 Table has the following Tricho- tomous Outcome Variables: b1 = Agree; b2 = Disagree; and b3 = No Opinion. The Inputted Qualitative Outcomes are reported as follows: nTri = 25; α = 0.975. a1 a2 a3 b1 3 13 12 b2 20 10 11 b3 2 2 2 Tri2d.f. = [C − 1][R − 1] = [3 − 1][3 − 1] = 4 = Tri2[¯x ] The Tri-Square Test Formula for the Transformation of Tri- chotomous Qualitative Outcomes into Trichotomous Quantita- tive Outcomes to Determine the Validity of the Research Hy- pothesis: 2 2: Sum xyy TriTTri TriTri Tri2 Critical Value Table = 0.484 (with d.f. = 4 at α = 0.975). For d.f. = 4, the Critical Value for p > 0.975 is 0.484. The Cal- culated Tri-Square Value is 10.939, thus, the null hypothesis (H0) is rejected by virtue of the hypothesis test which yields the following: Tri-Squared Critical Value of 0.484 < 10.939 the Calculated Tri-Squared Value. Research Table One illustrates the qualitative transformation into quantitative data as a mathematical application of the Tri- chotomous-Squared (“Trichotomy-Squared”, “Tri-Squared” or “Tri-Square”) statistical analysis procedure on a conceptual framework for faculty. Table 1 shows that participants pri- marily and overwhelmingly selected the “Disagree” Categorical Variable (a1b2 = 20) in terms of Collegiality. In addition, all Categorical Variables were reported respectively as: Level of Collegiality as “Agree” (a1b1 = 3), “Disagree” (a1b2 = 20), and “No Opinion” (a1b3 = 2); Ability to Influence Policy as “Agree” (a2b1 = 13), “Disagree” (a2b2 = 10), and “No Opinion” (a2b3 = 2); and Overall Communication of Relevant Informa- tion as “Agree” (a3b1 = 12), “Disagree” (a3b2 = 11), and “No Opinion” (a3b3 = 2). The mathematical formula for the Tri- Squared is reported illustrating the final outcome of the re- search hypothesis test: the null hypothesis (H0) is rejected at p > 0.975 is 0.484 (Osler, 2012). Thus, this illustrates that there is a need for a statistical framework to empower faculty in educa- tion. The area of focus in which the Inventive Investigative Instrument was used was to address the deficits in collegiality, policy, and communication between faculty and leadership in higher education. In terms of this initial study, more in-depth research is needed to determine foci areas and the extent to which the areas in this study identify as concerns are reflected with a much broader audience to better implement the deter- mine the outcomes of the study and make it more generalizable to more institutions of higher learning. Conclusion This study provided insight into the use of the Tri-Squared data analysis methodology as a statistical framework designed to empower faculty. Faculty perceptions of leadership in insti- tutions of higher education were analyzed to demonstrate the overall utility of the Tri-Squared Test. The Tri-Squared Test yielded the following results: Tri2 Critical Value Table = 0.484 (with d. f. = 4 at α = 0.975). For d.f. = 4; the Critical Value for p > 0.975 is 0.484; and the Calculated Tri-Square Value was 10.939. Thus, the null hypothesis (H0) is rejected by virtue of the hypothesis test which yielded the following: Tri-Squared Critical Value of 0.484 < 10.939 the Calculated Tri-Squared Value. As a result, the application of the Tri-Squared Test is demonstrated to be an effective comprehensive qualitative and quantitative mixed methods data analysis technique that faculty can readily implement. This study provides evidence that clearly supports the implementation of the Tri-Squared as an ideal statistical framework for faculty that uniquely covers mul- tiple statistical parameters in a single mathematical model. Researchers can use Tri-Squared to plan research investigations with larger sample sizes to determine research outcomes and add greater value and level of generalizability to their research findings now and in the future. REFERENCES Apostol, T. M. (1967). Calculus, second edition, Volume one: One- Copyright © 2013 SciRes. 17 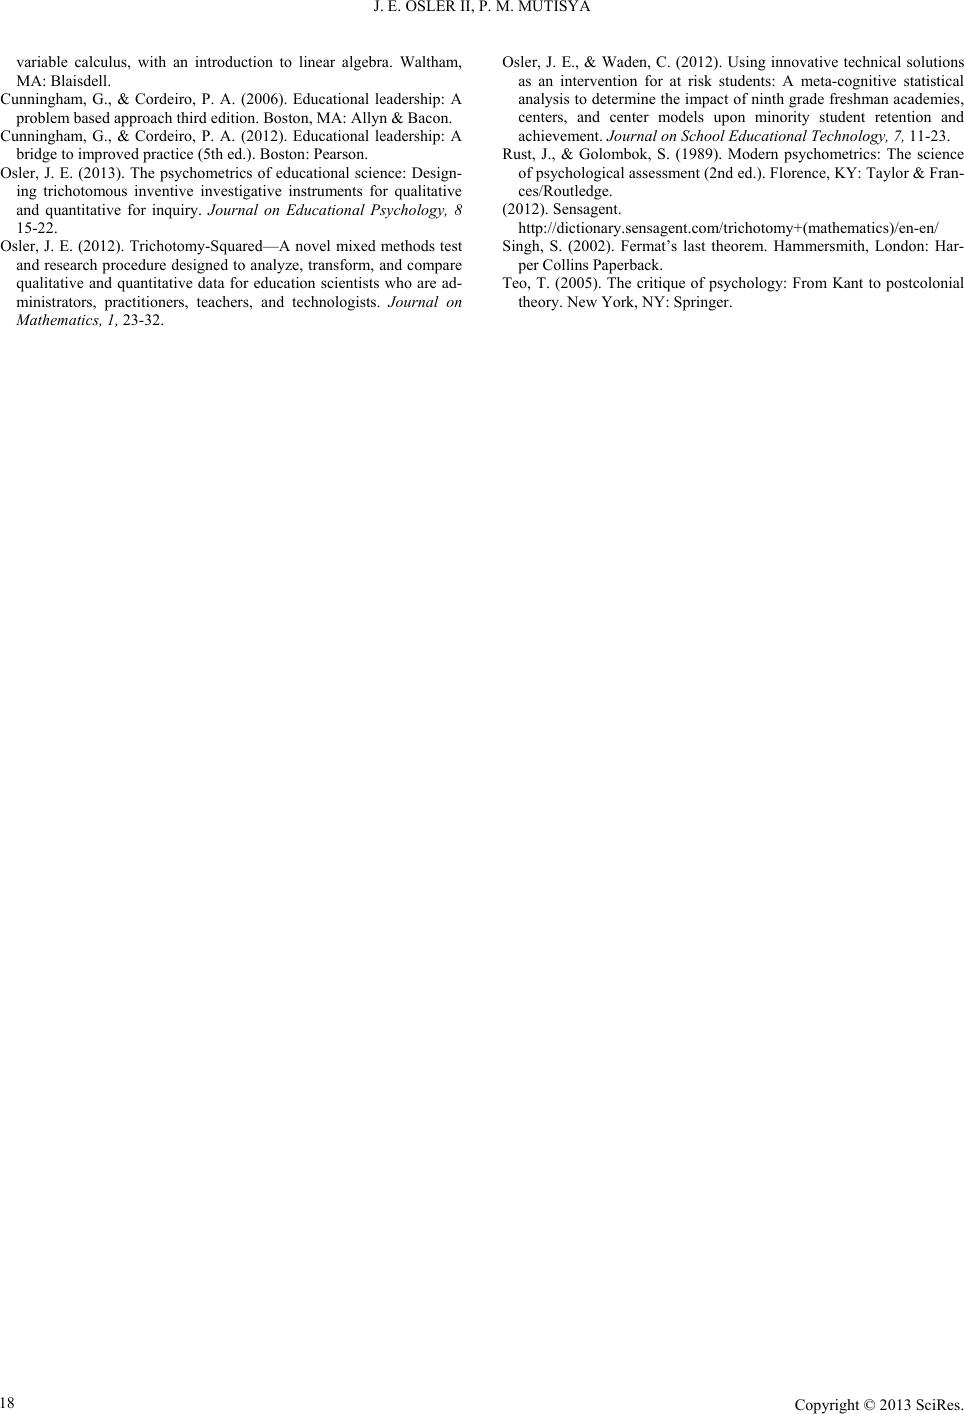 J. E. OSLER II, P. M. MUTISYA Copyright © 2013 SciRes. 18 variable calculus, with an introduction to linear algebra. Waltham, MA: Blaisdell. Cunningham, G., & Cordeiro, P. A. (2006). Educational leadership: A problem based approach third edition. Boston, MA: Allyn & Bacon. Cunningham, G., & Cordeiro, P. A. (2012). Educational leadership: A bridge to improved practice (5th ed.). Boston: Pearson. Osler, J. E. (2013). The psychometrics of educational science: Design- ing trichotomous inventive investigative instruments for qualitative and quantitative for inquiry. Journal on Educational Psychology, 8 15-22. Osler, J. E. (2012). Trichotomy-Squared—A novel mixed methods test and research procedure designed to analyze, transform, and compare qualitative and quantitative data for education scientists who are ad- ministrators, practitioners, teachers, and technologists. Journal on Mathematics, 1, 23-32. Osler, J. E., & Waden, C. (2012). Using innovative technical solutions as an intervention for at risk students: A meta-cognitive statistical analysis to determine the impact of ninth grade freshman academies, centers, and center models upon minority student retention and achievement. Journal on School Educational Technology, 7, 11-23. Rust, J., & Golombok, S. (1989). Modern psychometrics: The science of psychological assessment (2nd ed.). Florence, KY: Taylor & Fran- ces/Routledge. (2012). Sensagent. http://dictionary.sensagent.com/trichotomy+(mathematics)/en-en/ Singh, S. (2002). Fermat’s last theorem. Hammersmith, London: Har- per Collins Paperback. Teo, T. (2005). The critique of psychology: From Kant to postcolonial theory. New York, NY: Springer. |