International Journal of Geosciences, 2013, 4, 993-1001
http://dx.doi.org/10.4236/ijg.2013.46092 Published Online August 2013 (http://www.scirp.org/journal/ijg)
Fault Plane Identification Using Three
Components Local Waveforms
Bagus Jaya Santosa
Physics Department, Faculty Mathematics and Science, ITS Jl. ArifRahman Hakim I, Surabaya, Indonesia
Email: bjs@physics.its.ac.id
Received December 9, 2012; revised March 12, 2013; accepted April 6, 2013
Copyright © 2013 Bagus Jaya Santosa. This is an open access article distributed under the Creative Commons Attribution License,
which permits unrestricted use, distribution, and reproduction in any medium, provided the original work is properly cited.
ABSTRACT
A research has been conducted to estimate earthquake source parameters that occurred on June 3rd, 13th, 18th and 19th,
2008. The data used to determine the parameters of earthquakes source are three components local waveform that are
recorded by three MY broadband stations (IPM, KOM and KUM) and PSI, Poseidon. In this research, we report a focal
mechanism of events using three components local waveform analysis. The seismogram data are inverted to achieve the
earthquake source parameters. Source parameters of earthquakes extracted after the reduction variant of each event are
over 56%. To identify the fault plane, the HC-plot method is used.
Keywords: 3 Components Local Waveform; Earthquake Source Parameters
1. Introduction
Earthquake is a natural phenomenon, in shape of natural
shock from earth interior which propagates to the surface.
There are three types of earthquake that is commonly
known. The first one is tectonic earthquake that has close
relation to fault formation, as a direct consequence from
slab collision. This type of earthquake usually has a
magnitude more than 5 Richter Scale. Vulcanic earth-
quake is an earthquake that is related to volcano activity.
This earthquake can be classified as micro to moderate
earthquake, and usually has a magnitude less than 4
Richter Scale. The third type is a collapse that is caused
by avalanche which is a minor earthquake. The magni-
tude of this earthquake is very small that it can not be felt
in the surface. It has the shape of tremor and can only be
detected by seismometer. Large fault is also one of the
earthquake sources. Such as Semangko fault that divides
Sumatra Island. The fault is a weak zone that can be eas-
ily affected by tectonic earthquake. There are two zones
where the earthquake strikes the most in Sumatra, which
are: 1) slab subduction zone that is located in West Su-
matran ocean which has a potency of causing earthquake
with a relatively big magnitude and has a good chance of
causing tsunami; 2) Sumatra fault zone known as Se-
mangko (Figure 1). Semangko fault is a very active fault
in the land that separate Sumatra Island into two part,
spreading out along Bukit Barisan mountain range, from
Semangko bay in Sunda strait until Aceh in north. Se-
mangko fault is the most active fault in the world. The
earthquakes that occur in Java and Sumatra is a geody-
namic implication of an active deformation around Sunda
(Java) trench [1,2]. West Sumatra is the boundary of
ocean slab which consists of two faulting systems, which
are strike-slip faulting system that rotate toward right
direction (dextral) and interface dip-slip subduction which
has bigger influence [2]. Slope convergence that points
Figure 1. Epicenter position of 03/05/2008, 13/05/2008, 18/
05/2008 and 19/05/2008 (star) events and 4 stations (IPM,
KUM, KOM and PSI) (triangle).
C
opyright © 2013 SciRes. IJG
B. J. SANTOSA
994
toward north direction from Indian and Australian slabs
is moving toward South East Asia with the velocity of 60
mm/yr [3]. Slab convergence is divided into a slip paral-
lel to the trench accomodated by Sumatra fault and per-
pendicular slip which is accomodated by subduction zone
interface [2]. Sumatra fault has caused tens of earthquakes
with a magnitude 7 M 7.7, also several minor events,
in the last century. Subduction on India-Australia slab
was occured at Sumatra slab boundary with the velocity
around 60 mm/yr toward N11˚E. Oblique convergence
partitioned into trench parallel to slip-mostly accomo-
dated by Sumatra faulting zone and trench perpendicular
to slip-mostly accomodated by subduction zone. More
detailed map of Sumatra faulting zone (SFZ) shows that
Sumatra fault consist of many segments. The influence of
the fault segmentation to the dimension of seismic source
shows that the dimension for future seismic events also
influenced by fault geometry [2]. Understanding the cracks
caused by an active fault is the fundamental purpose that
has not been achieved in earthquake science. The main
reason of the slow development is the data rareness and
relevant analysis on how strain accumulate on the region
around fault and how does the fault release that accumu-
lated strain [4]. The event on 2008/05/03, 2008/05/13 and
2008/05/19/05 were occured in the sea and triggered by
subduction, while the one that happened on 2008/05/19
was occured in the land and triggered by Semangko fault.
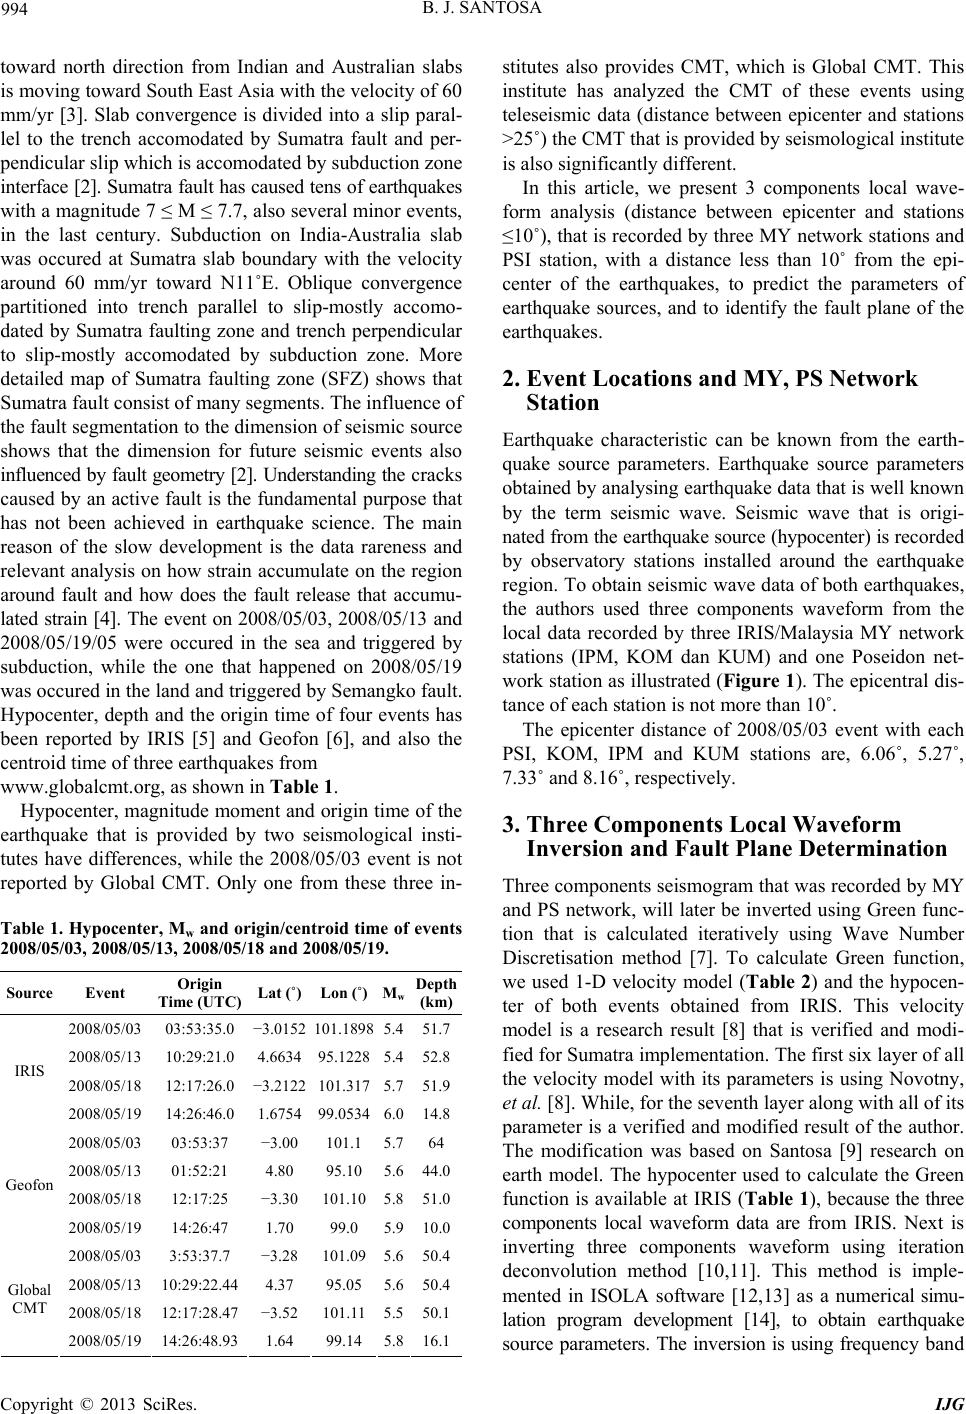
Hypocenter, depth and the origin time of four events has
been reported by IRIS [5] and Geofon [6], and also the
centroid time of three earthquakes from
www.globalcmt.org, as shown in Table 1.
Hypocenter, magnitude moment and origin time of the
earthquake that is provided by two seismological insti-
tutes have differences, while the 2008/05/03 event is not
reported by Global CMT. Only one from these three in-
Table 1. Hypocenter , Mw and origin/centroid time of events
2008/05/03, 2008/05/13, 2008/05/18 and 2008/05/19.
Source Event Origin
Time (UTC)Lat (˚) Lon (˚) MwDepth
(km)
2008/05/03 03:53:35.0 3.0152 101.1898 5.451.7
2008/05/13 10:29:21.0 4.6634 95.1228 5.452.8
2008/05/18 12:17:26.0 3.2122 101.317 5.751.9
IRIS
2008/05/19 14:26:46.0 1.6754 99.0534 6.014.8
2008/05/03 03:53:37 3.00 101.1 5.764
2008/05/13 01:52:21 4.80 95.10 5.644.0
2008/05/18 12:17:25 3.30 101.10 5.851.0
Geofon
2008/05/19 14:26:47 1.70 99.0 5.910.0
2008/05/03 3:53:37.7 3.28 101.09 5.650.4
2008/05/13 10:29:22.444.37 95.05 5.650.4
2008/05/18 12:17:28.473.52 101.11 5.550.1
Global
CMT
2008/05/19 14:26:48.931.64 99.14 5.816.1
stitutes also provides CMT, which is Global CMT. This
institute has analyzed the CMT of these events using
teleseismic data (distance between epicenter and stations
>25˚) the CMT that is provided by seismological institute
is also significantly different.
In this article, we present 3 components local wave-
form analysis (distance between epicenter and stations
10˚), that is recorded by three MY network stations and
PSI station, with a distance less than 10˚ from the epi-
center of the earthquakes, to predict the parameters of
earthquake sources, and to identify the fault plane of the
earthquakes.
2. Event Locations and MY, PS Network
Station
Earthquake characteristic can be known from the earth-
quake source parameters. Earthquake source parameters
obtained by analysing earthquake data that is well known
by the term seismic wave. Seismic wave that is origi-
nated from the earthquake source (hypocenter) is recorded
by observatory stations installed around the earthquake
region. To obtain seismic wave data of both earthquakes,
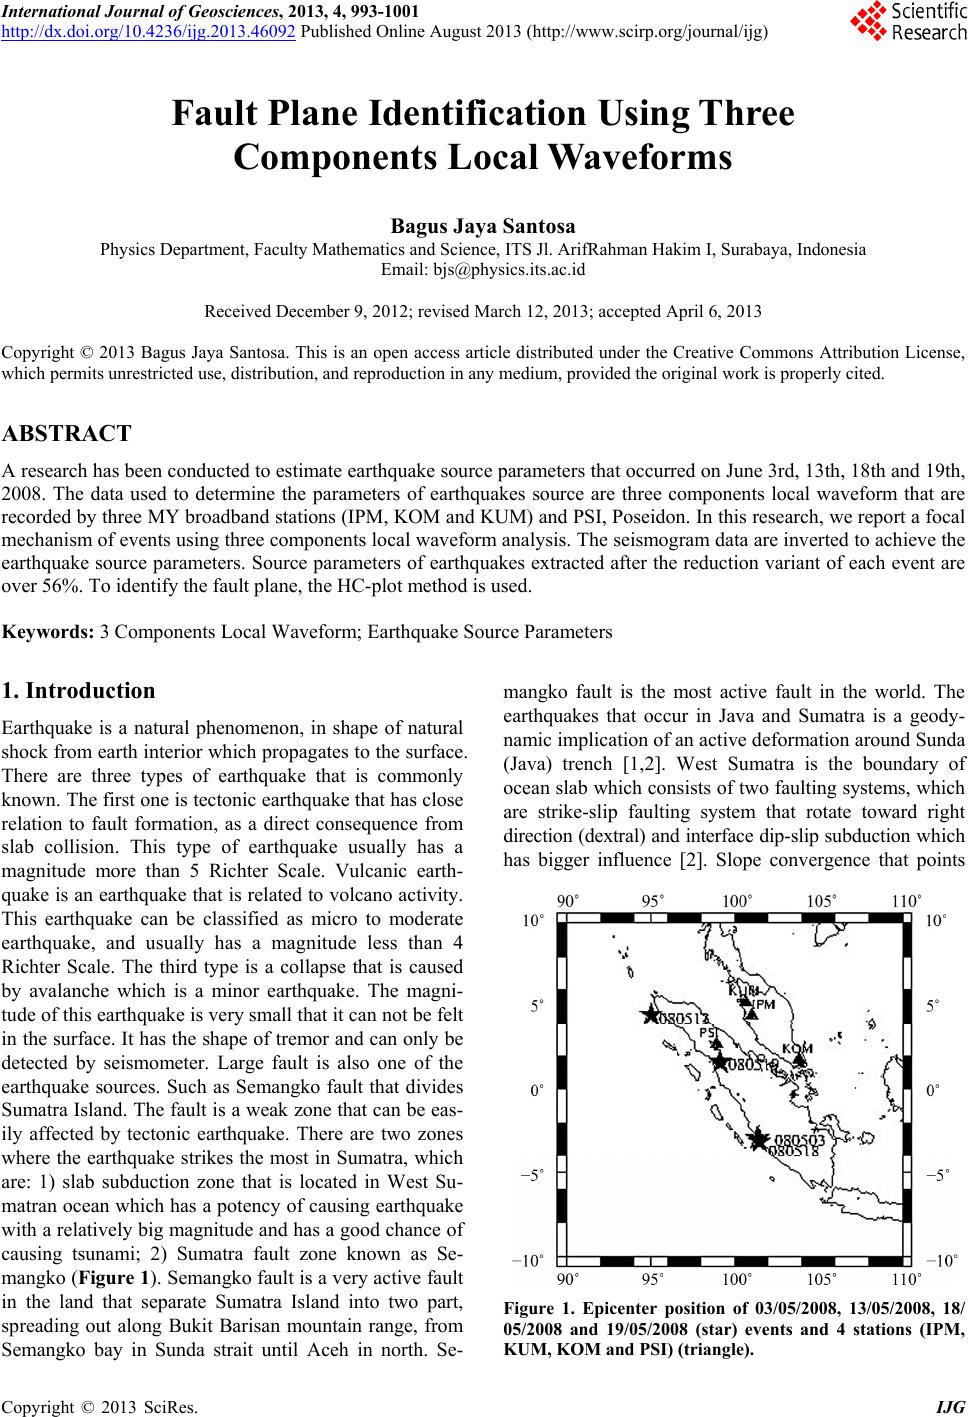
the authors used three components waveform from the
local data recorded by three IRIS/Malaysia MY network
stations (IPM, KOM dan KUM) and one Poseidon net-
work station as illustrated (Figure 1). The epicentral dis-
tance of each station is not more than 10˚.
The epicenter distance of 2008/05/03 event with each
PSI, KOM, IPM and KUM stations are, 6.06˚, 5.27˚,
7.33˚ and 8.16˚, respectively.
3. Three Components Local Waveform
Inversion and Fault Plane Determination
Three components seismogram that was recorded by MY
and PS network, will later be inverted using Green func-
tion that is calculated iteratively using Wave Number
Discretisation method [7]. To calculate Green function,
we used 1-D velocity model (Table 2) and the hypocen-
ter of both events obtained from IRIS. This velocity
model is a research result [8] that is verified and modi-
fied for Sumatra implementation. The first six layer of all
the velocity model with its parameters is using Novotny,
et al. [8]. While, for the seventh layer along with all of its
parameter is a verified and modified result of the author.
The modification was based on Santosa [9] research on
earth model. The hypocenter used to calculate the Green
function is available at IRIS (Table 1), because the three
components local waveform data are from IRIS. Next is
inverting three components waveform using iteration
deconvolution method [10,11]. This method is imple-
mented in ISOLA software [12,13] as a numerical simu-
lation program development [14], to obtain earthquake
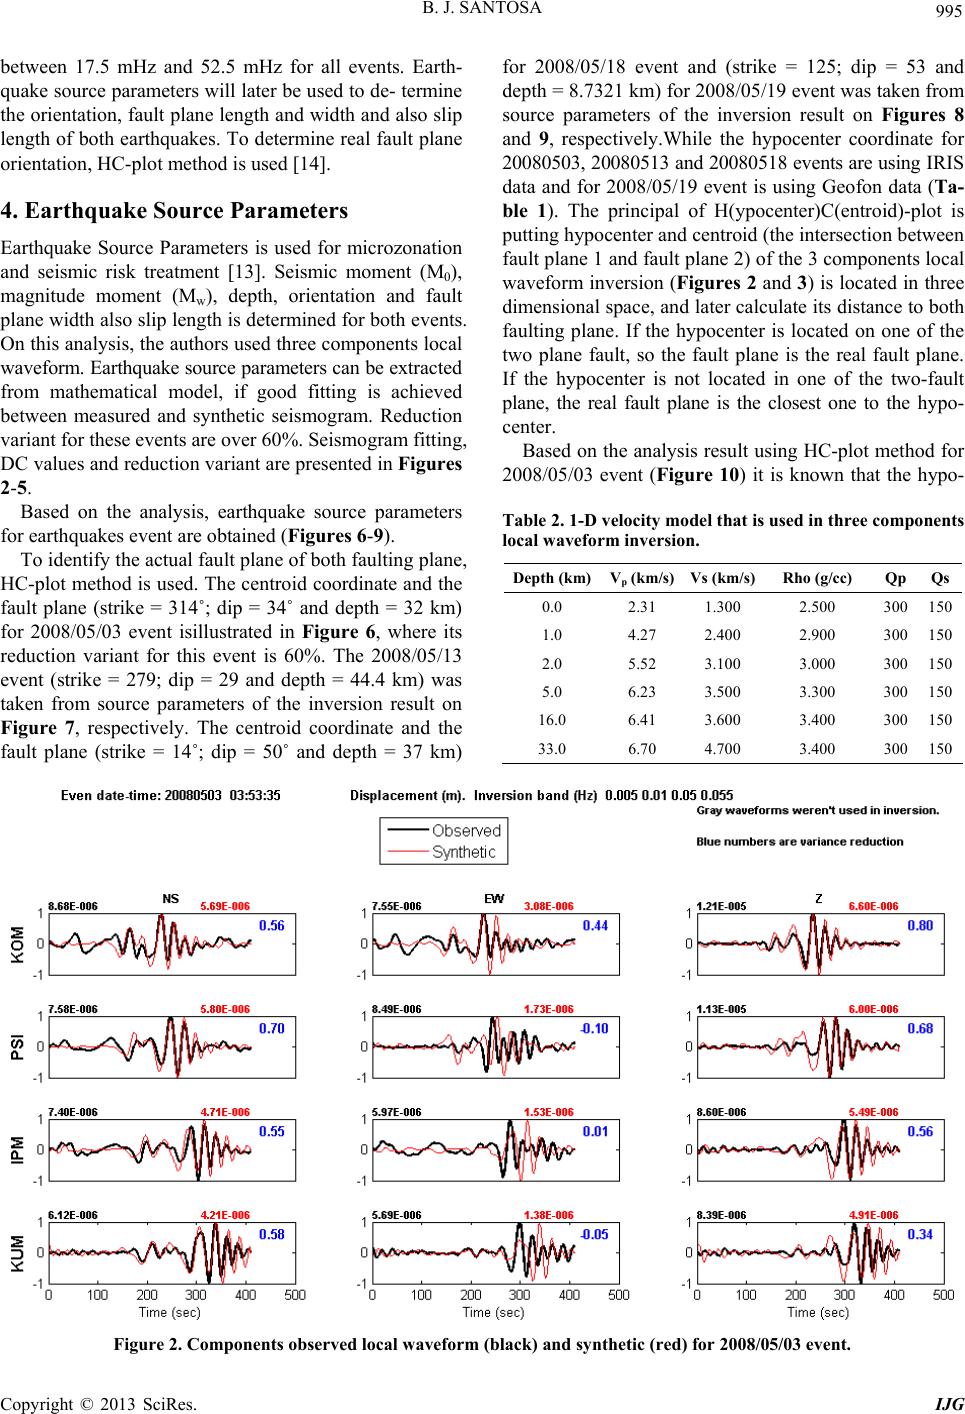
source parameters. The inversion is using frequency band
Copyright © 2013 SciRes. IJG
B. J. SANTOSA
Copyright © 2013 SciRes. IJG
995
between 17.5 mHz and 52.5 mHz for all events. Earth-
quake source parameters will later be used to de- termine
the orientation, fault plane length and width and also slip
length of both earthquakes. To determine real fault plane
orientation, HC-plot method is used [14].
4. Earthquake Source Parameters
Earthquake Source Parameters is used for microzonation
and seismic risk treatment [13]. Seismic moment (M0),
magnitude moment (Mw), depth, orientation and fault
plane width also slip length is determined for both events.
On this analysis, the authors used three components local
waveform. Earthquake source parameters can be extracted
from mathematical model, if good fitting is achieved
between measured and synthetic seismogram. Reduction
variant for these events are over 60%. Seismogram fitting,
DC values and reduction variant are presented in Figures
2-5.
Based on the analysis, earthquake source parameters
for earthquakes event are obtained (Figures 6-9).
To identify the actual fault plane of both faulting plane,
HC-plot method is used. The centroid coordinate and the
fault plane (strike = 314˚; dip = 34˚ and depth = 32 km)
for 2008/05/03 event isillustrated in Figure 6, where its
reduction variant for this event is 60%. The 2008/05/13
event (strike = 279; dip = 29 and depth = 44.4 km) was
taken from source parameters of the inversion result on
Figure 7, respectively. The centroid coordinate and the
fault plane (strike = 14˚; dip = 50˚ and depth = 37 km)
for 2008/05/18 event and (strike = 125; dip = 53 and
depth = 8.7321 km) for 2008/05/19 event was taken from
source parameters of the inversion result on Figures 8
and 9, respectively.While the hypocenter coordinate for
20080503, 20080513 and 20080518 events are using IRIS
data and for 2008/05/19 event is using Geofon data (Ta-
ble 1). The principal of H(ypocenter)C(entroid)-plot is
putting hypocenter and centroid (the intersection between
fault plane 1 and fault plane 2) of the 3 components local
waveform inversion (Figures 2 and 3) is located in three
dimensional space, and later calculate its distance to both
faulting plane. If the hypocenter is located on one of the
two plane fault, so the fault plane is the real fault plane.
If the hypocenter is not located in one of the two-fault
plane, the real fault plane is the closest one to the hypo-
center.
Based on the analysis result using HC-plot method for
2008/05/03 event (Figure 10) it is known that the hypo-
Table 2. 1-D velocity model that is used in three components
local waveform inversion .
Depth (km)Vp (km/s)Vs (km/s) Rho (g/cc) Qp Qs
0.0 2.31 1.300 2.500 300150
1.0 4.27 2.400 2.900 300150
2.0 5.52 3.100 3.000 300150
5.0 6.23 3.500 3.300 300150
16.0 6.41 3.600 3.400 300150
33.0 6.70 4.700 3.400 300150
Figure 2. Components observed local waveform (black) and synthetic (red) for 2008/05/03 event.
B. J. SANTOSA
996
Figure 3. Components observed local waveform (black) and synthetic (red) for 2008/05/13 event.
Figure 4. Components observed local waveform (black) and synthetic (red) for 2008/05/18 event.
center and centroid distance is 33 km. While fault plane 1
shown in Figure 10 has geometry of strike = 314˚; dip =
34˚; rake = 98˚ (green) with a distance 4.33 km from
hypocenter and fault plane 2 has geometry of strike =
125˚; dip = 56˚; rake = 85˚ (red) with a distance 22.02
km from hypocenter. The distance of fault plane 1 (green)
to the hypocenter is closer than fault plane 2 (red). There-
fore, the real fault plane is fault plane 1.
Copyright © 2013 SciRes. IJG
B. J. SANTOSA 997
Figure 5. Components observed local waveform (black) and synthetic (red) for 2008/05/19 event.
Figure 6. Earthquake source parameters (CMT) 2008/05/03 event.
Copyright © 2013 SciRes. IJG
B. J. SANTOSA
998
Figure 7. Earthquake source parameters (CMT) 2008/05/13 event.
Figure 8. Earthquake source parameters (CMT) 2008/05/18 event.
Copyright © 2013 SciRes. IJG
B. J. SANTOSA
Copyright © 2013 SciRes. IJG
999
Figure 9. Earthquake source parameters (CMT) 2008/05/19 event.
The HC-plot method analysis of 2008/05/13 earthquake,
illustrated in Figure 11, shows that the fault plane 1 (green,
strike = 279˚; dip = 29˚; rake = 66˚) has shorter distance
to hypocenters than the auxilliary fault plane (red, strike
= 126˚; dip = 64˚; rake = 103˚), therefore the real fault
plane is fault plane 1.
The HC-plot method analysis of 2008/05/18 earthquake,
illustrated in Figure 12, shows that the fault plane 1 (green,
strike = 279˚; dip = 29˚; rake = 66˚) has distance to
hypocenter of 3.40 km which is shorter than the auxil-
liary fault plane (red, strike = 126˚; dip = 64˚; rake =
103˚) of 17.32 km, therefore the real fault plane is fault
plane 1. Figure 10. The distance offault plane 1 (green) is closer to
the hypocenter than fault plane 2 (red) for 2008/05/03 event.
The HC-plot method analysis of 2008/05/19 earthquake,
illustrated in Figure 13, shows that the fault plane 1 (green,
strike = 148˚; dip = 60˚; rake = 155˚) has a distance 3.04
km from hypocenterand the auxilliary fault plane (red,
strike = 126˚; dip = 64˚; rake = 103˚), has a distance 8.43
km from hypocenter. The distance of fault plane 1 to the
hypocenter is closer than fault plane 2. Therefore, the
real fault planeis fault plane 1.
5. Discussion
Accurate hypocenter parameter and focal mechanism es-
timation can provide vital information regarding the earth-
quake strength and orientation of the fault plane. In this
research, we used three components local broadband that
is recorded by IRIS/Malaysia MY network stations and
Figure 11. The distance offault plane 1 (green) is closer to
the hypocenter than fault plane 2 (red) for 2008/05/13 event.
B. J. SANTOSA
1000
Figure 12. The distance offault plane 1 (green) is closer to
the hypocenter than fault plane 2 (red) for 2008/05/18 event.
Figure 13. The distance offault plane 1 (green) is closer to
the hypocenter than fault plane 2 (red) for 2008/05/19 event.
IRIS/MS station [5]. Station code (St), distance (Δ), cen-
troid depth(d), M0, Mw, strike(stk), dip, rake(rak) for each
events is presented in Table s 3 and 4, and the results will
be compared to the GlobalCMT.
Comparison between centroid points from GlobalCMT
and this research of 2008/05/18earthquake event shows
the same longitude and lattitude point, and 27.4 km dif-
ference of the earthquake source (50.1 km and 22.6 km).
Magnitude moment of this research is 5.8 (Mw), while
from GlobalCMT is 5.7 (Mw). Detailed information can
be seen in Tables 3 and 4. Parameters obtained from this
research shows good seismogram fitting on three compo-
nents for all stations. Faulting type of the 2008/05/18 and
2008/05/19 earthquakes is reverse oblique with rake an-
gles 105˚ and 107˚, respectively. The origin time of this
result is slightly different (+0.2 second) to the hypocenter
origin time. The hypocenter location of this research is
27 km shallower than the one obtained from Global CMT,
while the longitude and latitude position of this research
and Global CMT is the same. The Magnitude moment of
this research and Global CMT is slightly different (Mw =
5.7 and 6.0) and this research (Mw = 5.8 and 5.9) for
Table 3. Centroid Position and Earthquake source parameters
of earthquakes from Author.
Event
48 d(km)Lat Lon
M0 × 10 24
(dyne-cm) Mw StkDip Rake
2008/05/0332.9362.8758101.238 2.159 5.5 314˚34˚98˚
2008/05/1344.451 4.504 95.1554 4.749 5.7 279˚29˚66˚
2008/05/1822.6083.1155101.329 6.697 5.8 315˚29˚101
2008/05/197.9631 1.698 99.0941 9.641 5.9 251˚68˚32˚
Table 4. Centroid Pos it ion and Earthquake source parameters
of earthquakes from GlobalCMT.
Event
48 d (km)LatLon M0 × 1024
(dyne-cm) Mw StkDipRake
2008/05/1850.1 3.52101.11 1 5.7 321˚29˚105˚
2008/05/1316.11.6499.14 1 6.0 331˚82˚173˚
20080518 and 20080519 earthquakes. The fault type of
these research is reversed oblique with rake 105˚ and
173˚, Mw = 5.7 and 6.0. The origin timeof this research is
slightly different (+0.2 second) to the hypocenter origin
time.
6. Conclusion
Earthquake parameters of three events (seismic moment,
magnitude moment and fault plane orientation) are ex-
tracted after fitting between measured and synthetic seis-
mogram is achieved with the reduction variants of all
events are over 56%. Using HC_plot method, we can
identify the real fault plane for these events. The fault
type of each event is reverse oblique. The result of this
research is different with Global CMT in which all com-
ponents of moment tensor are compared.
7. Acknowledgements
We would like to express our gratitude to those who help
us to finish this research. We want to thank the GFZ-
Postdam Geofon—Jerman and BMKG—Indonesia that
gave us permission to download the waveform data re-
corded by IA network stations. We have furthermore to
thank Prof. Dr. Zahradnik and Dr. Efthimios Sokos that
give us guidance in understanding ISOLA-GUI and
HC-plot softwares and also apply the softwares to esti-
mate earthquake [15] source parameters using three-di-
mension local waveform
(http://seismo.geology.upatras.gr/isola). We are deeply in-
debted to Prof. Dr. Toda, S., Prof. Dr. R. S. Stein, Prof.
Dr. P. A. Reasenberg, Prof. Dr. J. H. Dieterich, dan Prof.
Dr. A. Yoshida that allow us and give guidance in esti-
mating the length and width of fault plane block and also
slip length using Coulomb3.109 software
(http://quake.wr.usgs.gov/research/defo rmation/modeling
/home/swf).
Copyright © 2013 SciRes. IJG
B. J. SANTOSA
Copyright © 2013 SciRes. IJG
1001
REFERENCES
[1] S. Lasitha, M. Radhakrishna and T. D. Sanu, “Seismically
Active Deformation in the Sumatra-Java Trench-Arc Re-
gion: Geodynamic Implications,” Current Science, Vol.
90, No. 5, 2006, pp. 690-696.
[2] D. H. Natawidjaya, “Neotectonics of the Sumatra Fault
and Paleogeodesy of the Sumatra Subduction Zone,”
Thesis, California Institute of Technology, Pasadena, 2002.
[3] K. R. Newcomb and W. R. McCann, “Seismic History
and Seismotectonics of the Sunda Arc,” Journal of Geo-
physical Research: Solid Earth, Vol. 92, No. B1, 1999, pp.
421-439.
[4] L. Prawirodirdjo, Y. Bocl, R. McCaffrey, J. Genrich, E.
Calais, C. Stevens, S. S. O. Puntodewo, C. Subarya, J.
Rais, P. Zwick and R. M. Fauzi, “Geodetic Observations
of Interseismic Strain Segmentation at the Sumatra Sub-
duction Zone,” Geophysical Research Letters, Vol. 24,
No. 21, 1997, pp. 2601-2604. doi:10.1029/97GL52691
[5] Toda, S., R. S. Stein, P. A. Reasenberg, J. H. Dieterich
and A. Yoshida, “Stress Transferred by the 1995 MW =
6.9 Kobe, Japan, Shock: Effect on Aftershocks and Future
Earthquake Probabilities,” Journal of Geophysical Re-
search, Vol. 103, No. B10, 1998, pp. 24543-24565.
[6] K. Madlazim, B. J. Santosa and U. Widya, “Parameter-
Parameter Sumber Gempa Bumi Padang dan Korelasin-
yadengan Gempa Bumi-Gempa Bumi Berikutnya, Prosid-
ing Seminar Nasional Fisikadan Aplikasinya, ITS,” ITS,
Surabaya, 2009.
[7] B. N. Joewono, “1.117 Orang Meninggal akibat Gempa
Padang,” 2009.
http://regional.kompas.com/read/xml/2009/10/15/102351
6/1.117.orang.meninggal.akibat.gempa.padang
[8] O. Novotný, J. Zahradník and G.-A. Tselentis, “North-
Western Turkey Earthquakes and the Crustal Structure
Inferred from Surface Waves Observed in the Corinth
Gulf, Greece,” Bulletin of the Seismological Society of
America, Vol. 91, No. 4, 2001, pp. 875-879.
[9] B. J. Santosa, “Analyzing the Seismogram of Earthquakes
on Sumatra-Java Subduction Plane at CHTO Observation
Station,” Journal MIPA, Vol. 13, 2008, pp. 13-21.
[10] M. Kikuchi and H. Kanamori, “Inversion of Complex
Body Waves—III,” Bulletin of the Seismological Society
of America, Vol. 81, No. 6, 1991, pp. 2335-2350.
[11] E. N. Sokos and J. Zahradnik, “ISOLA a Fortran Code
and a Matlab GUI to Perform Multiple-Point Source In-
version of Seismic Data,” Computers & Geosciences, Vol.
34, No. 8, 2008, pp. 967-977.
[12] J. Zahradnik and E. Sokos, “ISOLA-GUI: A Matlab GUI
for Moment Tensor Retrieval,” 2009.
[13] J. Zahradnik, A. Serpetsidaki, E. Sokos and G.-A. Tselen-
tis, “Iterative Deconvolution of Regional Waveforms and
a Double-Event Interpretation of the Lefkada Earthquake,
Greece,” 2006. http://seismo.geology.upatras.gr/isola/
[14] O. Coutant, “Program of Numerical Simulation AXITRA,
in Research Report,” LGIT, Grenoble, 1989.
[15] J. Zahradnik, F. Gallovic, E. Sokos, A. Serpetsidaki and
G.-A. Tselentis, “Quick Fault-Plane Identification by a
Geometrical Method: Application to the Mw 6.2 Leonidio
Earthquake, 6 January 2008, Greece,” Seismological Re-
search Letters, Vol. 79, No. 5, 2008, pp. 653-662.