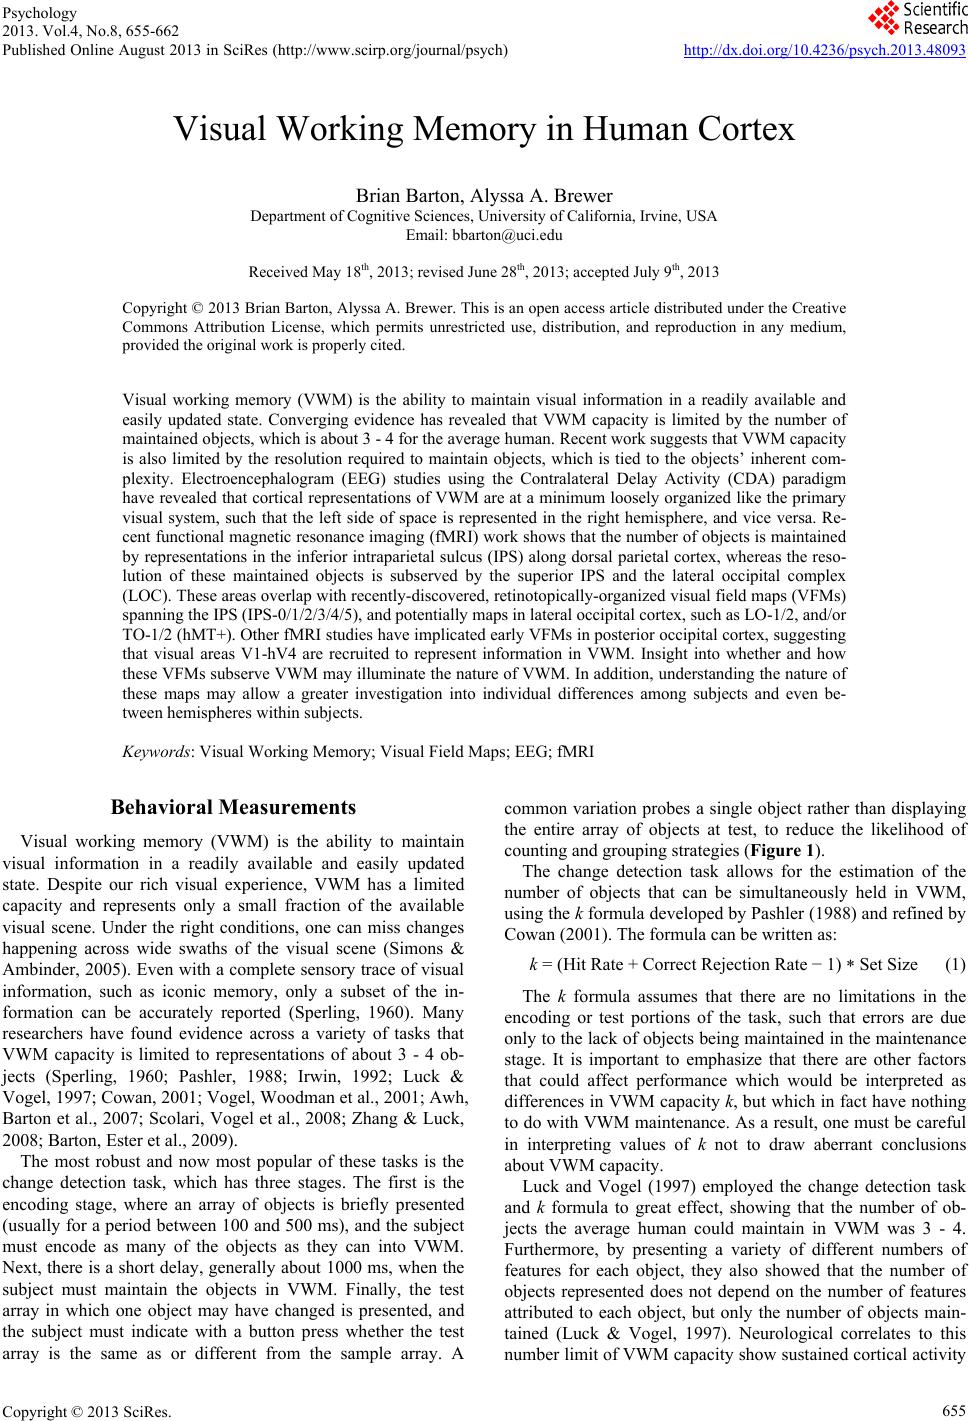
 Psychology 2013. Vol.4, No.8, 655-662 Published Online August 2013 in SciRes (http://www.scirp.org/journal/psych) http://dx.doi.org/10.4236/psych.2013.48093 Copyright © 2013 SciRes. 655 Visual Working Memory in Human Cortex Brian Barton, Alyssa A. Brewer Department of Cognitive Sciences, University of California, Irvine, USA Email: bbarton@uci.edu Received May 18th, 2013; revised June 28th, 2013; accepted July 9th, 2013 Copyright © 2013 Brian Barton, Alyssa A. Brewer. This is an open access article distributed under the Creative Commons Attribution License, which permits unrestricted use, distribution, and reproduction in any medium, provided the original work is properly cited. Visual working memory (VWM) is the ability to maintain visual information in a readily available and easily updated state. Converging evidence has revealed that VWM capacity is limited by the number of maintained objects, which is about 3 - 4 for the average human. Recent work suggests that VWM capacity is also limited by the resolution required to maintain objects, which is tied to the objects’ inherent com- plexity. Electroencephalogram (EEG) studies using the Contralateral Delay Activity (CDA) paradigm have revealed that cortical representations of VWM are at a minimum loosely organized like the primary visual system, such that the left side of space is represented in the right hemisphere, and vice versa. Re- cent functional magnetic resonance imaging (fMRI) work shows that the number of objects is maintained by representations in the inferior intraparietal sulcus (IPS) along dorsal parietal cortex, whereas the reso- lution of these maintained objects is subserved by the superior IPS and the lateral occipital complex (LOC). These areas overlap with recently-discovered, retinotopically-organized visual field maps (VFMs) spanning the IPS (IPS-0/1/2/3/4/5), and potentially maps in lateral occipital cortex, such as LO-1/2, and/or TO-1/2 (hMT+). Other fMRI studies have implicated early VFMs in posterior occipital cortex, suggesting that visual areas V1-hV4 are recruited to represent information in VWM. Insight into whether and how these VFMs subserve VWM may illuminate the nature of VWM. In addition, understanding the nature of these maps may allow a greater investigation into individual differences among subjects and even be- tween hemispheres within subjects. Keywords: Visual Working Memory; Visual Field Maps; EEG; fMRI Behavioral Measurements Visual working memory (VWM) is the ability to maintain visual information in a readily available and easily updated state. Despite our rich visual experience, VWM has a limited capacity and represents only a small fraction of the available visual scene. Under the right conditions, one can miss changes happening across wide swaths of the visual scene (Simons & Ambinder, 2005). Even with a complete sensory trace of visual information, such as iconic memory, only a subset of the in- formation can be accurately reported (Sperling, 1960). Many researchers have found evidence across a variety of tasks that VWM capacity is limited to representations of about 3 - 4 ob- jects (Sperling, 1960; Pashler, 1988; Irwin, 1992; Luck & Vogel, 1997; Cowan, 2001; Vogel, Woodman et al., 2001; Awh, Barton et al., 2007; Scolari, Vogel et al., 2008; Zhang & Luck, 2008; Barton, Ester et al., 2009). The most robust and now most popular of these tasks is the change detection task, which has three stages. The first is the encoding stage, where an array of objects is briefly presented (usually for a period between 100 and 500 ms), and the subject must encode as many of the objects as they can into VWM. Next, there is a short delay, generally about 1000 ms, when the subject must maintain the objects in VWM. Finally, the test array in which one object may have changed is presented, and the subject must indicate with a button press whether the test array is the same as or different from the sample array. A common variation probes a single object rather than displaying the entire array of objects at test, to reduce the likelihood of counting and grouping strategies (Figure 1). The change detection task allows for the estimation of the number of objects that can be simultaneously held in VWM, using the k formula developed by Pashler (1988) and refined by Cowan (2001). The formula can be written as: k = (Hit Rate + Correct Rejection Rate − 1) * Set Size (1) The k formula assumes that there are no limitations in the encoding or test portions of the task, such that errors are due only to the lack of objects being maintained in the maintenance stage. It is important to emphasize that there are other factors that could affect performance which would be interpreted as differences in VWM capacity k, but which in fact have nothing to do with VWM maintenance. As a result, one must be careful in interpreting values of k not to draw aberrant conclusions about VWM capacity. Luck and Vogel (1997) employed the change detection task and k formula to great effect, showing that the number of ob- jects the average human could maintain in VWM was 3 - 4. Furthermore, by presenting a variety of different numbers of features for each object, they also showed that the number of objects represented does not depend on the number of features attributed to each object, but only the number of objects main- tained (Luck & Vogel, 1997). Neurological correlates to this number limit of VWM capacity show sustained cortical activity  B. BARTON, A. A. BREWER Figure 1. Change detection with simple and complex objects. Typical change detection tasks are two-alternative forced-choice tasks in which a sub- ject is presented with an array of objects to encode into VWM (usually for ~100 - 500 ms), maintains those representations once they are no longer visible (usually for ~1000 ms), and is then asked whether one probed object is the same or different from the sample object in the same position (usually until the subject responds, or for ~1000 - 2000 ms). Here, a set size of four and a probe array of one are represented. However, set size is often varied, and entire arrays are often presented at the probe, although still only one test object can change. (a) Simple colored square stimuli, typically drawn from about 6 distinct hues. Changes are always low in similarity (e.g., a green square changes to red), and thus require low resolution to make an accurate comparison. Complex stimuli adapted from Barton & Brewer (2010) are displayed in (b) and (c), which have both one of 6 or so overall hues like the colored squares, but the sides of each cube have three shades, creating 6 possible shading patterns as well. Thus, a change in overall hue (b) results in equivalent performance as with colored squares (a), because both are low similarity changes. In contrast, a change of shading pattern, but not overall hue (c), results in worse performance, because higher resolution is required to make an accurate comparison between the sample object and test probe. corresponding to the number of objects maintained in VWM and have been demonstrated in EEG (Vogel & Machizawa, 2004; Vogel, McCollough et al., 2005; Drew, McCollough et al., 2006; McCollough, Machizawa et al., 2007) and fMRI (Todd & Marois, 2004; Todd & Marois, 2005; Xu & Chun, 2006). In addition, individual differences in VWM number capacity have been demonstrated behaviorally (Awh, Barton et al., 2007), with EEG (Vogel & Machizawa, 2004; Vogel, McCollough et al., 2005), and with fMRI (Todd & Marois, 2005). Alvarez and Cavanagh (2004) then showed that the number of objects that can be maintained in VWM also depends on the complexity of the maintained objects. Using the change detec- tion task and k formula with objects of varying levels of com- plexity, they showed that an independent method of assessing complexity (search rate among similar distracters) is strongly correlated with the estimation of the maximum number of ob- jects of a certain type that could be maintained. Consequently, VWM number capacity was estimated to be lower for complex objects than simple ones. Neurological correlates that show sus- tained cortical activity corresponding to changes in the com- plexity of objects maintained in VWM have similarly been demonstrated in EEG (Gao, Li et al., 2009) and fMRI (Xu & Chun, 2006). These two disparate findings have been resolved by Awh, Barton, & Vogel (2007), who revealed that performance be- tween simple and complex objects is identical, so long as the level of similarity between the test and sample object is large. Comparisons of simple objects are not limited by resolution because the sample and test are so dissimilar that the limiting factor is only k, the number of objects that can be held simulta- neously in VWM. Normally, complex objects are limited by resolution, because they are so similar to one another within each category that the resolution of each object is too low to make accurate comparisons. If one makes the changes large enough such that resolution is no longer a limiting factor by making categorical changes between complex objects, per- formance is limited by k, as with simple objects (Figure 1). Thus, it appears that there are two limitations of VWM per- formance: the number of objects simultaneously held and the resolution at which those objects are represented. Discrete or Flexible Resource Allocation? The idea that a resolution resource exists for VWM begs the question: how is it allocated across maintained objects? Two scenarios arise as likely possibilities. The first is a flexible re- source allocation model. In this model, resolution could be allocated differentially to objects of different complexity, such that a simple object might not be allocated much resolution, but an object of higher complexity, more demanding to represent, might be allocated more resolution. The second model is a rigid resource allocation model, in which objects up to a certain maximum, k, are represented with a certain resolution, regard- less of complexity. Recently, evidence favoring the discrete resource allocation model came when Zhang & Luck (2008) used a procedure that provides independent estimates of the number and resolution of representations in VWM to demonstrate that a subset of avail- able objects are maintained and no information is retained about other objects. Further, they showed that giving a pre-cue to indicate which of the sample objects was most likely to change increased the likelihood that the cued object was en- coded, but not the likelihood that it was allocated more resolu- tion. The idea is that if resources could be flexibly allocated, subjects would have a large incentive to allocate more resolu- tion to the pre-cued item. Barton, Ester, & Awh (2009) demon- strated complimentary results that argue in favor of a discrete resource allocation model. They presented arrays of objects to encode in a change detection task that varied in the amount of overall complexity in the display and found that change detec- tion performance with any given object in the display did not depend on the complexity of the other objects in the display. Also in line with the predictions of a rigid resource allocation model, maintained object resolution plateaus after the item limit, k, is reached (Anderson, Vogel et al., 2011). However, evidence in favor of a flexible resource allocation model came with the demonstration that drawing attention to an object with a flash changes the resolution at which it is encoded into VWM (Bays & Husain, 2008). Not only that, but it was demonstrated that some of the error in the Zhang & Luck (2008) task was due to a mnemonic mismatch between color and loca- tion information, not simply random guessing (Bays, Catalao et Copyright © 2013 SciRes. 656  B. BARTON, A. A. BREWER al., 2009). Furthermore, other studies have found no evidence for a limit in the number of representations that can be held in VWM in general (Keshvari, van den Berg et al., 2013), or at least for certain conditions (Sligte, Scholte et al., 2008). When directly compared, it appears that the discrete resource allocation model slightly more accurately fits the data of this study relative to the flexible resource allocation model (Rouder, Morey et al., 2008). Although much is made of the differences between these models, their similarities are often overlooked. It is agreed in general that resolution decreases as the number of objects maintained increases (Zhang & Luck, 2008; Barton, Ester et al., 2009; Bays, Catalao et al., 2009; Bays, Gorgoraptis et al., 2011). Both models propose that resolution decreases as set size increases, because the same amount of resources are split among many objects, but one proposes that those re- sources are evenly distributed across a limited number of dis- crete chunks, while the other proposes that the chunks are unlimited and their resolution can vary. Although one can ima- gine somewhat different predictions for neural implementa- tion made by each model, it may be most useful for current questions of cortical organization to focus on their similarities and how the common features interact with the retinotopic or- ganization of the visual system. Electroencephalography Electroencephalography is the measure of the electrical ac- tivity originating in the brains of human subjects, recorded at numerous electrode sites placed on their scalps. EEG offers excellent insight into the temporal resolution (on the order of milliseconds) of electrical brain activity. However, many sources contribute to the activity recorded at each electrode, so its spa- tial resolution is coarse and generally relies on converging evi- dence (Clark, Fan et al., 1994; Luck, 1999; Luck, Woodman et al., 2000; McCollough, Machizawa et al., 2007). A technique which has been applied to studies of VWM is a specialized form of the event-related potential (ERP) measure- ment. ERPs are very small electrical signals generated in corti- cal regions in response to specific events or stimuli (Blackwood & Muir, 1990; Sur & Sinha, 2009). The ERP related to a par- ticular type of stimulus is measured by having subjects re- peatedly respond to the stimulus hundreds or thousands of times, and then averaging the signal across trials and subjects in order to reveal a common waveform associated with the stimu- lus (Luck, 1999). A specialized ERP component used to study VWM is known as Contralateral Delay Activity (CDA) and measures sustained electrical activity during the delay period of a change detection task. The CDA requires objects to be pre- sented in both hemifields, but held in VWM in one hemifield and not in the other. Then, the ERP waveform recorded from electrode sites in the posterior parietal, occipital, and occipi- tal-temporal regions of the hemisphere ipsilateral to the remem- bered objects is subtracted from that of the contralateral hemi- sphere, resulting in a difference waveform, which constitutes the CDA (Vogel & Machizawa, 2004; Vogel, McCollough et al., 2005; Drew, McCollough et al., 2006; McCollough, Machi- zawa et al., 2007; Gao, Li et al., 2009). Originally, the CDA revealed sustained activity commensu- rate to the number of objects represented in VWM. Using sim- ple colored squares in a change detection task, the CDA activity increased as set sizes increased, until the subjects’ working memory capacity was exceeded, at which point the CDA rea- ched a plateau (Vogel & Machizawa, 2004; McCollough, Ma- chizawa et al., 2007). More recently, the CDA has been shown to reflect the amount of resolution allocated to objects main- tained in VWM. In a study comparing the CDA when simple or complex objects are maintained in a change detection task, electrode sites in posterior parietal, occipital, and occipito-tem- poral cortex showed greater activity for complex than simple objects (Gao, Li et al., 2009). While activity at the same elec- trode sites increased as the number of maintained simple ob- jects increased, the activity remained indistinguishable between set sizes for complex objects. It is important to note that the VWM capacity estimate for these complex objects was meas- ured to be two objects, so no difference is expected between set sizes two and four (Alvarez & Cavanagh, 2004). The authors interpreted these data as consistent with a flexible resource al- location model; however, the results can equivalently be ex- plained by a rigid resource allocation model. Functional Magnetic Resonance Imaging When neurons are active, the ratio of oxygenated hemoglo- bin to deoxygenated hemoglobin in nearby blood increases after a few seconds (known as the hemodynamic response). Func- tional magnetic resonance imaging (fMRI) is a technique that takes advantage of such blood oxygen-level dependent (BOLD) activity in the brain by applying a strong magnetic field and encoding positions in space with slight differences in magnetic field strength and phase (Ogawa, Tank et al., 1992). This allows for a very specific spatial readout of brain activity (on the order of 1 mm3), but the hemodynamic response is on the order of seconds, which limits the ability of fMRI to distinguish fine temporal differences (Logothetis, Pauls et al., 2001; Logothetis & Wandell, 2004; Serences, 2004; Shmuel, Augath et al., 2006; Poldrack, Fletcher et al., 2008; Schridde, Khubchandani et al., 2008; Schummers, Yu et al., 2008; Chen & Parrish, 2009). Initial fMRI studies of VWM focused on the role of the frontal lobe, in regions such as dorsolateral and ventrolateral prefrontal cortex (PFC). Much of the focus was trying to parcel out “spatial” vs. “non-spatial” VWM storage abilities, which re- turned mixed results that have since been reevaluated (Jonides, Smith et al., 1993; D’Esposito & Postle, 1999; Postle, Zarahn et al., 2000; Postle, Awh et al., 2004; Roth, Serences et al., 2006). These areas are now largely considered to be involved in the encoding-, manipulation-, and response-related aspects of VWM (Postle, Berger et al., 2000; Rypma, Berger et al., 2002) or attentional feedback control (Curtis & D’Esposito, 2003), op- erations normally ascribed to the “central executive” (Baddeley & Hitch, 1974; Baddeley, 1996; Baddeley, 2000; Baddeley, 2003). There is little evidence that these frontal areas, though vital to the VWM network, are the regions that give rise to the number and resolution limits on VWM capacity (Postle, 2006). In the search for regions which subserve VWM capacity lim- its, researchers have observed three regions of cortex whose activity during a VWM task is commensurate with either the number of or the resolution required to represent objects in VWM. The first region identified spanned the intraparietal sulcus (IPS) in the dorsal parietal cortex bilaterally and was shown to have BOLD signal modulation positively correlated with the number of objects maintained in VWM during the delay period of a change detection task (Todd & Marois, 2004; Todd & Marois, 2005). Further research led to the discovery that inferior IPS in both Copyright © 2013 SciRes. 657  B. BARTON, A. A. BREWER hemispheres showed activity dependent upon the number of maintained objects, but superior IPS and part of the lateral- occipital complex (LOC) in both hemispheres responded in- stead to the complexity of maintained objects (Xu & Chun, 2006). These regions were identified using either simple or complex objects in a change detection task. Behavioral VWM capacity was estimated for simple and complex objects, and then BOLD modulation was compared to behavioral estimates across LOC, superior and inferior IPS. Superior IPS and LOC were shown to have BOLD signal modulation corresponding to the behavioral measurements of VWM capacity. Inferior IPS showed activity corresponding to the number of objects pre- sented, regardless of complexity. The authors argue that inferior IPS is an area of object indi- viduation based on location, leading to the VWM number ca- pacity limit found in simple change detection tasks. In contrast, they argue, superior IPS and LOC are areas responsible for object identification and binding, such that a smaller number of complex objects can be represented than simple objects, in favor of a two-stage, flexible resource allocation model (Xu & Chun, 2006; Xu & Chun, 2007; Xu & Chun, 2009). However, it is also possible that the results could be equivalently ex- plained by a slightly altered version of the discrete resource allocation model. Recent studies have also implicated V1-hV4 in VWM proc- essing, perhaps representing information that is related to the sensory information processed in each map (Harrison & Tong, 2009; Sligte, Scholte et al., 2009; Ester, Anderson et al., 2013). Studies such as these call into question the idea that a particular location of cortex is responsible for VWM, but rather it is likely that VWM is a distributed aspect of the entire visual system. Perhaps, like the visual system, representations of different types of information are represented in different portions of cortex. Visual Field Maps Visual information first enters primate cortex in primary vis- ual cortex (area V1), located in the posterior occipital lobe, for low-level processing of visual details (Tootell, Hadjikhani et al. 1998). From there, visual information is sent to other visual areas, which can be differentiated by their unique cytoarchitec- tonic structures, connectivity, visual field maps (VFMs), and functional processing (e.g., (Van Essen, Newsome et al., 1984; Felleman & Van Essen, 1991; Wandell, Dumoulin et al., 2007; Brewer & Barton, 2012)). Many visual areas were first identi- fied in monkey using primarily single and multiple unit re- cording techniques, and since, many homologues have been discovered in human (e.g., (Brewer, Press et al., 2002; Sereno & Tootell, 2005; Wandell, Dumoulin et al., 2007; Kolster, Peeters et al., 2010)). The most compelling evidence for visual areas in humans are VFMs, often called retinotopic maps, be- cause they follow the organization of the retina. That is, nearby neurons within a VFM analyze properties of nearby points of an image on the retina (e.g., (Wandell, 1999; Wandell, Dumoulin et al., 2007; Brewer & Barton, 2012)). VFMs are routinely measured using standard traveling wave methods (Engel, Rumelhart et al., 1994; Sereno, Dale et al., 1995; DeYoe, Carman et al., 1996; Engel, Glover et al., 1997; Wandell, 1999; Wandell, Dumoulin et al., 2007; Brewer & Bar- ton, 2012). In this method, subjects view a periodic stimulus that moves smoothly through the visual field, which creates a traveling wave of activity within retinotopic VFMs. From the fMRI response time series, the position of the stimulus within the visual field that is optimal for evoking a response from each cortical location can be identified. Retinotopic VFMs are meas- ured with respect to two visual field dimensions: eccentricity and polar angle. Rotating wedge and expanding ring stimuli consisting of high contrast, flickering checkerboard patterns are typically used to measure gradients of visual field polar angle and eccentricity, respectively. Each of the first few VFMs (V1, V2, and V3) can be identi- fied as containing a representation of a full hemifield of visual space, with each hemisphere representing the contralateral he- mifield (Wandell, 1999; Dougherty, Koch et al., 2003; Wandell, Dumoulin et al., 2007; Brewer & Barton, 2012). VFM V1 and the adjacent VFMs V2 and V3 contribute to a confluent foveal representation at the occipital pole (Schira, Tyler et al., 2009). All of these areas have a lower visual field representation lo- cated on the dorsal part of the posterior occipital lobe and an upper visual field representation on the ventral surface. Beyond these early VFMs in the posterior occipital lobe, visual cortex is loosely organized into anatomically distinct dorsal and ventral “streams” (Morel & Bullier, 1990; Baizer, Ungerleider et al., 1991). Several dorsal and ventral human VFMs have been mapped using fMRI, and they contain abutting upper and lower visual field representations and distinct foveal representations (Tootell, Mendola et al., 1997; Press, Brewer et al., 2001; Wade, Brewer et al., 2002; Brewer, Liu et al., 2005). Beyond the dorsal lower vertical meridian representation of V3 lies a string of hemifield maps running from the transverse occipital sulcus (TOS) up along the medial wall of the intrapa- rietal sulcus (IPS). The first maps bordering V3d are V3A and V3B, which share a discrete foveal representation within the TOS (Tootell, Mendola et al., 1997; Smith, Greenlee et al., 1998; Press, Brewer et al., 2001). A series of recently described maps extend from IPS-0 (also called V7 (Tootell, Hadjikhani et al., 1998)) along the medial wall of the IPS, reversing smoothly into several hemifields from IPS-1 to IPS-5 (Sereno, Pitzalis et al., 2001; Silver, Ress et al., 2005; Swisher, Halko et al., 2007; Wandell, Dumoulin et al., 2007; Konen & Kastner, 2008). Weak foveal representations for each map fall along the fundus of the IPS. In addition, two sets of VFMs (LO-1, LO-2, TO-1, and TO-2) positioned on the dorsal part of lateral occipital cortex anterior to V3d were recently described (Larsson & Heeger, 2006; Amano, Wandell et al., 2009). LO-1 and 2 share the confluent foveal representation with V1, 2 and 3, while TO-1 and 2 share a distinct foveal representation. LO-1 and 2 overlap with part of object-selective LOC, while TO-1 and 2 overlap with motion- selective areas MT and MST, respectively. Additional VFMs TO-3 and TO-4 have recently been described just inferior to TO-1 and TO-2 (Kolster, Peeters et al., 2010). Several recent studies and reviews can provide more extensive details on the current state of visual field mapping (Brewer & Barton, 2012), the travelling wave methodology (Engel, 2012), population re- captive field modeling for VFM measurements (Dumoulin & Wandell, 2008), and the history of VFM measurements (Wan- dell & Winawer, 2011). The recently discovered IPS VFMs are strongly modulated by attention, and they appear to overlap with the superior and inferior IPS regions reported by Xu & Chun (2006) to subserve VWM. Also, it is likely that the region of lateral occipital cor- tex implicated in VFM falls within one or several of the lateral Copyright © 2013 SciRes. 658  B. BARTON, A. A. BREWER VFMs (LO-1/2, TO-1/2) (Barton & Brewer, 2010). If these regions do overlap, the retinotopic organization of the VFMs has important implications for the functional properties of these VWM areas. Indeed, studies of early VFMs suggest that VWM is represented in a retinotopic fashion in the early visual system, so it is likely that this relationship is maintained throughout the visual hierarchy. Individual Differences In the search for behavioral effects, ERP signatures, and brain regions corresponding to VWM capacity limits, individ- ual differences are often overlooked as noise in the data that is muddying an otherwise clean study. If published, reports on individual differences of VWM capacity are usually relegated to less prestigious journals after the primary findings have snagged the lion’s share of the attention. However, individual differences in VWM capacity continue to arise and are becom- ing more and more important in the ongoing debates of VWM capacity limitations (Vogel & Machizawa, 2004; Todd & Mar- ois, 2005; Vogel, McCollough et al., 2005; Awh, Barton et al., 2007). Much of the debate over VWM capacity limitations ignores the dissociation between the ability to maintain a number of objects in VWM and the ability to allocate resolution to those objects. Awh et al. (2007) revealed that performance across independent number-limited change detection tasks is strongly correlated within subjects. Correspondingly, performance on independent resolution-limited tasks is highly correlated. How- ever, performance on number-limited tasks does not correlate with performance on resolution-limited tasks. Together, these results suggest that there are two independent abilities being tested in these tasks, one for number and one for resolution, which vary within and between subjects. Todd & Marois reported group data (Todd & Marois, 2004) and individual differences (Todd & Marois, 2005) for their change detection measurements that revealed BOLD modula- tion in IPS corresponding to the number of objects maintained in VWM. Todd & Marois (2005) reported that the difference in BOLD modulation in relevant regions between the set size at which a subject’s VWM number capacity is reached and set size 1 correlates with each subject’s VWM capacity estimate. In other words, subjects with a larger VWM capacity as measured behaviorally also show larger BOLD modulations in cortex in response to the VWM task. This finding demonstrated that the BOLD signal can be used as a marker for VWM number capac- ity in individual subjects. VWM number capacity limits have further been shown to correlate with limits of the number of objects one can track in a multiple object tracking (MOT) task. Also, it has been reported that similar regions of cortex respond in a load-based manner during MOT and VWM tasks, and thus MOT may be subject to the same number capacity limit (Culham, Brandt et al., 1998; Culham, Cavanagh et al., 2001; Culham & Kanwisher, 2001; Cavanagh & Alvarez, 2005). The MOT task is similar to a change detection task, except that subjects must actively track objects rather than maintain them between the sample and test (Pylyshyn & Storm, 1988; Drew & Vogel, 2008). Interesting evidence has been presented using MOT tasks that show dif- ferences in the number of objects that can be tracked depending on whether the objects span both hemifields or are contained in one hemifield (Cavanagh & Alvarez, 2005). If one takes the assumption of a shared number capacity limit between VWM and MOT tasks, this is strong evidence that the total capacity limit is divided between the two hemispheres. In that case, one would expect that there may be individual differences between hemispheres within a subject. Finally, what if there were little to no variability in the VWM capacity number limit among individuals or within hemispheres? It is possible that some unaccounted-for effect may underlie what appear to be individual differences in the estimation of VWM capacity number limit. Vogel et al. (Vogel, McCollough et al., 2005) had a very intriguing study using the CDA, where they compared subjects with high and low VWM capacity number limits. Using a change detection task with simple col- ored squares, they presented two or four target objects to re- member, or two target objects and two distracter objects. They found that subjects with high capacity VWM showed equiva- lent CDA amplitude for two targets and two targets with two distracters, but subjects with low capacity VWM showed equi- valent amplitude for four targets and two targets with two dis- tracters. In an even more striking manipulation, they asked subjects to remember two targets for half of the delay period, and then either add two targets (append red) or exclude two distracters (exclude green) that appear during the delay period. High capacity subjects successfully appended targets and ex- cluded distracters, whereas low capacity subjects successfully appended targets, but also appended distracters. Together, these results suggest that perhaps lower estimates of VWM number capacity may actually be due to an inability to deal with irrele- vant objects, and not a lower maximum number of maintained objects. Based on this work, it is possible that all subjects have very similar VWM number capacities, but have trouble with other aspects of the task, such as successfully locking onto a manageable number of objects to maintain. Conclusion and Future Directions VWM capacity has been defined by two factors: the number of objects maintained and the resolution at which those objects are represented. The number of objects the average human can maintain seems to be about 3 - 4, and the resolution allocated to each of those objects declines as the number of objects main- tained increases. Resolution appears to be allocated in a rigid manner, such that resolution is evenly distributed across main- tained objects, regardless of those objects’ complexity. Al- though a flexible resource allocation model has also gained traction, we suggest that the two models have more similarities than differences, and it is those similarities which should drive future research into the neural underpinnings of VWM. These capacity limits have been demonstrated in a variety of behavioral measures, and the CDA reveals patterns of electrical cortical activity that show dissociable indices of number and resolution. Functional MRI results suggest that the number ca- pacity limit arises in inferior IPS, while the resolution capacity limit arises in superior IPS and LOC, though other aspects of these objects (e.g., color) may be represented in other parts of visual cortex. The cortical regions involved with capacity limi- tation overlap with several recently-discovered VFMs, indicat- ing that they are retinotopically organized. Thus, the limitations measured in VWM tasks may arise from the properties of the underlying organization of these VFMs. This idea also presents intriguing evidence that VWM may recruit the visual system to represent objects. Copyright © 2013 SciRes. 659  B. BARTON, A. A. BREWER Future lines of research should address specifically which of the VWM areas fall into which of the retinotopically-organized VFMs. It is possible that some of the VWM areas fall near retinotopic maps and not within them, but it is difficult to tell at this point because these regions have not been compared for overlap within individual subjects across visual cortex. In addi- tion, most of the VWM capacity limitation literature ignores in- dividual differences within and between subjects, and there is a wealth of opportunity to demonstrate just how subjects differ in their capacity limitations. Acknowledgements B.B. wrote the manuscript, which was then revised by B.B. and A.A.B. REFERENCES Alvarez, G. A., & Cavanagh, P. (2004). The capacity of visual short- term memory is set both by visual information load and by number of objects. Psychological Sc i e n c e , 15, 106-111. doi:10.1111/j.0963-7214.2004.01502006.x Amano, K., Wandell, B. A. et al. (2009). Visual field maps, population receptive field sizes, and visual field coverage in the human MT+ complex. Journal of Neurophysiology , 102, 2704-2718. doi:10.1152/jn.00102.2009 Anderson, D. E., Vogel, E. K. et al. (2011). Precision in visual working memory reaches a stable plateau when individual item limits are ex- ceeded. Journal of Neuros ci en c e, 31, 1128-1138. doi:10.1523/JNEUROSCI.4125-10.2011 Awh, E., Barton, B. et al. (2007). Visual working memory represents a fixed number of items regardless of complexity. Psychological Sci- ence, 18, 622-628. doi:10.1111/j.1467-9280.2007.01949.x Baddeley, A. (1996). Exploring the central executive. The Quarterly Journal of Experimental Psychology Section A: Human Experimental Psychology, 49, 5-28. Baddeley, A. (2000). The episodic buffer: A new component of work- ing memory? Trends in Cognitive Sciences, 4, 417-423. doi:10.1016/S1364-6613(00)01538-2 Baddeley, A. (2003). Working memory: Looking back and looking forward. Nature Reviews Neuroscience, 4, 829-839. doi:10.1038/nrn1201 Baddeley, A. D., & Hitch, G. (1974). Working memory. In H. B. Gordon (Ed.), Psychology of learning and motivation (Vol. 8, pp. 47- 89). Waltham, MA: Academic Press. Baizer, J. S., Ungerleider, L. G. et al. (1991). Organization of visual inputs to the inferior temporal and posterior parietal cortex in ma- caques. Journal of Neuroscienc e , 11, 168-190. Barton, B., & Brewer, A. A. (2010). Visual working memory capacity in retinotopic cortex: Number, resolution, and population receptive fields. Journal of V i s ion, 10, 729. doi:10.1167/10.7.729 Barton, B., Ester, E. F. et al. (2009). Discrete resource allocation in visual working memory. Journal of Experimental Psychology: Hu- man Perception and Performance, 35 , 1359-1367. doi:10.1037/a0015792 Bays, P. M., & Husain, M. (2008). Dynamic shifts of limited working memory resources in human vision. Science, 321, 851-854. doi:10.1126/science.1158023 Bays, P. M., Gorgoraptis, N. et al. (2011). Temporal dynamics of en- coding, storage, and reallocation of visual working memory. Journal of Vision, 11, Article 6. doi:10.1167/11.10.6 Bays, P. M., Catalao, R. F. et al. (2009). The precision of visual work- ing memory is set by allocation of a shared resource. Journal of Vi- sion, 9, Article 7. Blackwood, D. H., & Muir, W. J. (1990). Cognitive brain potentials and their application. British Journal of Psychiatry Supplements, 9, 96- 101. Brewer, A. A., & Barton, B. (2012). Visual field map organization in human visual cortex. In S. Molotchnikoff (Ed.), Visual Cortex, In- Tech, 29-60. Brewer, A. A., Liu, J. et al. (2005). Visual field maps and stimulus se- lectivity in human ventral occipital cortex. Nature Neuroscience, 8, 1102-1109. doi:10.1038/nn1507 Brewer, A. A., Press, W. A. et al. (2002). Visual areas in macaque cortex measured using functional magnetic resonance imaging. Jour- nal of Neuroscience, 22, 10416-10426. Cavanagh, P., & Alvarez, G. A. (2005). Tracking multiple targets with multifocal attention. Trends in Cognitiv e S c ie n c e s , 9, 349-354. doi:10.1016/j.tics.2005.05.009 Chen, Y., & Parrish, T. B. (2009). Caffeine’s effects on cerebrovascular reactivity and coupling between cerebral blood flow and oxygen me- tabolism. Neuroimage, 44, 647-652. doi:10.1016/j.neuroimage.2008.09.057 Clark, V. P., Fan, S. et al. (1994). Identification of early visual evoked potential generators by retinotopic and topographic analyses. Human Brain Mapping, 2, 170-187. doi:10.1002/hbm.460020306 Cowan, N. (2001). The magical number 4 in short-term memory: A reconsideration of mental storage capacity. Behavioral and Brain Sciences, 24, 87-114. doi:10.1017/S0140525X01003922 Culham, J. C., & Kanwisher, N. G. (2001). Neuroimaging of cognitive functions in human parietal cortex. Current Opinion in Neurobiology, 11, 157-163. doi:10.1016/S0959-4388(00)00191-4 Culham, J. C., Cavanagh, P. et al. (2001). Attention response functions: Characterizing brain areas using fMRI activation during parametric variations of attentional load. Neuron, 32, 737-745. doi:10.1016/S0896-6273(01)00499-8 Culham, J. C., Brandt, S. A. et al. (1998). Cortical fMRI activation pro- duced by attentive tracking of moving targets. Journal of Neurophy- siology, 80, 2657-2670. Curtis, C. E., & D’Esposito, M. (2003). Persistent activity in the pre- frontal cortex during working memory. Trends in Cognitive Sciences, 7, 415-423. doi:10.1016/S1364-6613(03)00197-9 D’Esposito, M., & Postle, B. R. (1999). The dependence of span and delayed-response performance on prefrontal cortex. Neuropsycholo- gia, 37, 1303-1315. doi:10.1016/S0028-3932(99)00021-4 DeYoe, E. A., Carman, G. J. et al. (1996). Mapping striate and extra- striate visual areas in human cerebral cortex. Proceedings of the Na- tional Academy of Sciences of the United States of America, 93, 2382-2386. doi:10.1073/pnas.93.6.2382 Dougherty, R. F., Koch, V. M. et al. (2003). Visual field representa- tions and locations of visual areas V1/2/3 in human visual cortex. Journal of Vision, 3, 586-598. doi:10.1167/3.10.1 Drew, T., & Vogel, E. K. (2008). Neural measures of individual differ- ences in selecting and tracking multiple moving objects. Journal of Neuroscience, 28, 4183-4191. doi:10.1523/JNEUROSCI.0556-08.2008 Drew, T. W., McCollough, A. W. et al. (2006). Event-related potential measures of visual working memory. Clinical EEG & Neuroscience, 37, 286-291. doi:10.1177/155005940603700405 Dumoulin, S. O., & Wandell, B. A. (2008). Population receptive field estimates in human visual cortex. Neuroimage, 39, 647-660. doi:10.1016/j.neuroimage.2007.09.034 Engel, S. A. (2012). The development and use of phase-encoded func- tional MRI designs. Neuroi mage , 62, 1195-1200. doi:10.1016/j.neuroimage.2011.09.059 Engel, S. A., Rumelhart, D. E. et al. (1994). fMRI of human visual cor- tex. Nature, 369, 525. doi:10.1038/369525a0 Engel, S. A., Glover, G. H. et al. (1997). Retinotopic organization in human visual cortex and the spatial precision of functional MRI. Ce- reb Cortex, 7, 181-192. doi:10.1093/cercor/7.2.181 Ester, E. F., Anderson, D. E. et al. (2013). A neural measure of preci- sion in visual working memory. Journal of Cognitive Neuroscience, 25, 754-761. doi:10.1162/jocn_a_00357 Felleman, D. J., & Van Essen, D. C. (1991). Distributed hierarchical processing in the primate cerebral cortex. Cerebral Cortex, 1, 1-47. doi:10.1093/cercor/1.1.1 Gao, Z., Li, J. et al. (2009). Storing fine detailed information in visual working memory—Evidence from event-related potentials. Journal of Vision, 9, 1-12. doi:10.1167/9.7.17 Copyright © 2013 SciRes. 660  B. BARTON, A. A. BREWER Harrison, S. A., & Tong, F. (2009). Decoding reveals the contents of visual working memory in early visual areas. Nature, 458, 632-635. doi:10.1038/nature07832 Irwin, D. E. (1992). Memory for position and identity across eye movements. Journal o f Experimental Psychology, 18, 307-317. Jonides, J., Smith, E. E. et al. (1993). Spatial working memory in hu- mans as revealed by PET. Nature, 363, 623-625. doi:10.1038/363623a0 Keshvari, S., van den Berg, R. et al. (2013). No evidence for an item limit in change detection. PLoS Computational B i ol ogy, 9, 1. doi:10.1371/journal.pcbi.1002927 Kolster, H., Peeters, R. et al. (2010). The retinotopic organization of the human middle temporal area MT/V5 and its cortical neighbors. The Journal of Neuroscie n c e, 30, 9801-9820. doi:10.1523/JNEUROSCI.2069-10.2010 Konen, C. S., & Kastner, S. (2008). Representation of eye movements and stimulus motion in topographically organized areas of human posterior parietal cortex. The Journal of Neuroscience, 28, 8361- 8375. doi:10.1523/JNEUROSCI.1930-08.2008 Larsson, J., & Heeger, D. J. (2006). Two retinotopic visual areas in human lateral occipital cortex. The Journal of Neuroscience, 26, 13128-13142. doi:10.1523/JNEUROSCI.1657-06.2006 Logothetis, N. K., & Wandell, B. A. (2004). Interpreting the BOLD signal. Annual Revie w o f Physiology, 66, 735-769. doi:10.1146/annurev.physiol.66.082602.092845 Logothetis, N. K., Pauls, J. et al. (2001). Neurophysiological investiga- tion of the basis of the fMRI signal. Nature, 412, 150-157. doi:10.1038/35084005 Luck, S. J. (1999). Direct and indirect integration of event-related po- tentials, functional magnetic resonance images, and single-unit re- cordings. Human Brain Mapping, 8, 115-201. doi:10.1002/(SICI)1097-0193(1999)8:2/3<115::AID-HBM8>3.0.CO ;2-3 Luck, S. J., & Vogel, E. K. (1997). The capacity of visual working memory for features and conjunctions. Nature, 390, 279-281. doi:10.1038/36846 Luck, S. J., Woodman, G. F. et al. (2000). Event-related potential stud- ies of attention. Trends i n Cognitive Sciences, 4 , 432-440. doi:10.1016/S1364-6613(00)01545-X McCollough, A. W., Machizawa, M. G. et al. (2007). Electrophysio- logical measures of maintaining representations in visual working memory. Cortex, 43, 77-94. doi:10.1016/S0010-9452(08)70447-7 Morel, A., & Bullier J. (1990). Anatomical segregation of two cortical visual pathways in the macaque monkey. Visual Neuroscience, 4, 555-578. doi:10.1017/S0952523800005769 Ogawa, S., Tank, D. et al. (1992). Intrinsic signal changes accompany- ing sensory stimulation: Functional brain mapping with magnetic re- sonance imaging. Proceedings of the National Academy of Sciences of the United States of America, 8 9 , 591-5955. doi:10.1073/pnas.89.13.5951 Pashler, H. (1988). Familiarity and visual change detection. Perception & Psychophysics, 44, 369-378. doi:10.3758/BF03210419 Poldrack, R. A., Fletcher, P. C. et al. (2008). Guidelines for reporting an fMRI study. Neuroimage, 40, 409-414. doi:10.1016/j.neuroimage.2007.11.048 Postle, B. R. (2006). Working memory as an emergent property of the mind and brain. Neuroscience, 139, 23-38. doi:10.1016/j.neuroscience.2005.06.005 Postle, B. R., Awh, E. et al. (2004). The where and how of attention- based rehearsal in spatial working memory. Brain Research. Cogni- tive Brain Research, 20, 194-205. doi:10.1016/j.cogbrainres.2004.02.008 Postle, B. R., Zarahn, E. et al. (2000). Using event-related fMRI to assess delay-period activity during performance of spatial and non- spatial working memory tasks. Brain Research Pr oto cols , 5, 57-66. doi:10.1016/S1385-299X(99)00053-7 Postle, B. R., Berger, J. S. et al. (2000). Activity in human frontal cor- tex associated with spatial working memory and saccadic behavior. Journal of Cognitive Neuroscience, 12, 2-14. doi:10.1162/089892900564028 Press, W. A., Brewer, A. A. et al. (2001). Visual areas and spatial summation in human visual cortex. Vision Research, 41, 1321-1332. doi:10.1016/S0042-6989(01)00074-8 Pylyshyn, Z. W., & Storm, R. W. (1988). Tracking multiple independ- ent targets: Evidence for a parallel tracking mechanism. Spatial Vi- sion, 3, 179-197. doi:10.1163/156856888X00122 Roth, J. K., Serences, J. T. et al. (2006). Neural system for controlling the contents of object working memory in humans. Cerebral Cortex, 16, 1595-1603. doi:10.1093/cercor/bhj096 Rouder, J. N., Morey, R. D. et al. (2008). An assessment of fixed-ca- pacity models of visual working memory. Proceedings of the Na- tional Academy of Sciences of the United States of America, 105, 5975-5979. doi:10.1073/pnas.0711295105 Rypma, B., Berger, J. S. et al. (2002). The influence of working-mem- ory demand and subject performance on prefrontal cortical activity. Journal of Cognitive Neuroscience, 14, 721-731. doi:10.1162/08989290260138627 Schira, M. M., Tyler, C. W. et al. (2009). The foveal confluence in human visual cortex. The Journal of Neuroscience, 29, 9050-9058. doi:10.1523/JNEUROSCI.1760-09.2009 Schridde, U., Khubchandani, M. et al. (2008). Negative BOLD with large increases in neuronal activity. Cerebral Cortex, 18, 1814-1827. doi:10.1093/cercor/bhm208 Schummers, J., Yu, H. et al. (2008). Tuned responses of astrocytes and their influence on hemodynamic signals in the visual cortex. Science, 320, 1638-1643. doi:10.1126/science.1156120 Scolari, M., Vogel, E. K. et al. (2008). Perceptual expertise enhances the resolution but not the number of representations in working memory. Psychonomic Bulletin and Review, 15, 215-222. doi:10.3758/PBR.15.1.215 Serences, J. T. (2004). A comparison of methods for characterizing the event-related BOLD timeseries in rapid fMRI. Neuroimage, 21, 1690-1700. doi:10.1016/j.neuroimage.2003.12.021 Sereno, M. I., & Tootell, R. B. (2005). From monkeys to humans: What do we now know about brain homologies? Current Opinion in Neu- robiology, 15, 135-144. doi:10.1016/j.conb.2005.03.014 Sereno, M. I., Dale, A. M. et al. (1995). Borders of multiple human visual areas in humans revealed by functional MRI. Science, 268, 889-893. doi:10.1126/science.7754376 Sereno, M. I., Pitzalis, S. et al. (2001). Mapping of contralateral space in retinotopic coordinates by a parietal cortical area in humans. Sci- ence, 294, 1350-1354. doi:10.1126/science.1063695 Shmuel, A., Augath, M. et al. (2006). Negative functional MRI re- sponse correlates with decreases in neuronal activity in monkey vis- ual area V1. Nature Neuroscience, 9, 569-577. doi:10.1038/nn1675 Silver, M. A., Ress, D. et al. (2005). Topographic maps of visual spatial attention in human parietal cortex. Journal of Neurophysiology, 94, 1358-1371. doi:10.1152/jn.01316.2004 Simons, D. J., & Ambinder, M. S. (2005). Change blindness. Current Directions in Psychological Sci e n c e , 14, 44-48. doi:10.1111/j.0963-7214.2005.00332.x Sligte, I. G., Scholte, H. S. et al. (2008). Are there multiple visual short-term memory stores? PLoS One, 3, e1699. doi:10.1371/journal.pone.0001699 Sligte, I. G., Scholte, H. S. et al. (2009). V4 Activity predicts the strength of visual short-term memory representations. Journal of Neuroscience, 29, 7432-7438. doi:10.1523/JNEUROSCI.0784-09.2009 Smith, A. T., Greenlee, M. W. et al. (1998). The processing of first- and second-order motion in human visual cortex assessed by functional magnetic resonance imaging (fMRI). The Journal of Neuroscience, 18, 3816-3830. Sperling, G. (1960). The information available in brief visual presenta- tions. Psychological Monographs: General and Applied, 74 , 1-29. doi:10.1037/h0093759 Sur, S., & Sinha, V. K. (2009). Event-related potential: An overview. Indian Journal of Psychiatry, 18 , 70-73. doi:10.4103/0972-6748.57865 Swisher, J. D., Halko, M. A. et al. (2007). Visual topography of human intraparietal sulcus. The Journal of Neuroscience, 27, 5326-5337. doi:10.1523/JNEUROSCI.0991-07.2007 Copyright © 2013 SciRes. 661  B. BARTON, A. A. BREWER Copyright © 2013 SciRes. 662 Todd, J. J., & Marois, R. (2004). Capacity limit of visual short-term memory in human posterior parietal cortex. Nature, 428, 751-754. doi:10.1038/nature02466 Todd, J. J., & Marois, R. (2005). Posterior parietal cortex activity pre- dicts individual differences in visual short-term memory capacity. Cognitive, Affective, & Behavioral Neuroscience, 5, 144-155. doi:10.3758/CABN.5.2.144 Tootell, R. B., Mendola, J. D. et al. (1997). Functional analysis of V3A and related areas in human visual cortex. The Journal of Neurosci- ence, 17, 7060-7078. doi:10.1016/S0896-6273(00)80659-5 Tootell, R. B., Hadjikhani, N. et al. (1998). The retinotopy of visual spatial attention. Neuron, 21, 1409-1422. Tootell, R. B., Hadjikhani, N. K. et al. (1998). Functional analysis of primary visual cortex (V1) in humans. Proceedings of the National Academy of Sciences of the Unite d S t at e s o f America, 95, 811-817. doi:10.1073/pnas.95.3.811 Van Essen, D. C., Newsome, W. T. et al. (1984). The visual field rep- resentation in striate cortex of the macaque monkey: Asymmetries, anisotropies, and individual variability. Vision Research, 24, 429- 448. doi:10.1016/0042-6989(84)90041-5 Vogel, E. K., & Machizawa, M. G. (2004). Neural activity predicts individual differences in visual working memory capacity. Nature, 428, 748-751. doi:10.1038/nature02447 Vogel, E. K., McCollough, A. W. et al. (2005). Neural measures reveal individual differences in controlling access to working memory. Na- ture, 438, 500-503. doi:10.1038/nature04171 Vogel, E. K., Woodman, G. F. et al. (2001). Storage of features, con- junctions and objects in visual working memory. Journal of Experi- mental Psychology: Human Perception and Performance, 27, 92- 114. doi:10.1037/0096-1523.27.1.92 Wade, A. R., Brewer, A. A. et al. (2002). Functional measurements of human ventral occipital cortex: Retinotopy and colour. Philosophical Transactions of the Royal Society of London. Series B: Biological Sciences, 357, 963-973. doi:10.1098/rstb.2002.1108 Wandell, B. A. (1999). Computational neuroimaging of human visual cortex. Annual Review of Neuroscience, 22, 145-173. doi:10.1146/annurev.neuro.22.1.145 Wandell, B. A., & Winawer, J. (2011). Imaging retinotopic maps in the human brain. Vision Research, 51, 718-737. doi:10.1016/j.visres.2010.08.004 Wandell, B. A., Dumoulin, S. O. et al. (2007). Visual field maps in human cortex. Neuron, 56, 366-383. doi:10.1016/j.neuron.2007.10.012 Xu, Y., & Chun, M. M. (2006). Dissociable neural mechanisms sup- porting visual short-term memory for objects. Nature, 440, 91-95. doi:10.1038/nature04262 Xu, Y., & Chun, M. M. (2007). Visual grouping in human parietal cortex. Proceedings of the National Academy of Sciences of the United States of America, 104, 18766-18771. doi:10.1073/pnas.0705618104 Xu, Y., & Chun, M. M. (2009). Selecting and perceiving multiple vis- ual objects. Trends in C ognitive Sciences, 13, 167-174. doi:10.1016/j.tics.2009.01.008 Zhang, W., & Luck, S. J. (2008). Discrete fixed-resolution representa- tions in visual working memory. Nature, 453, 233-235. doi:10.1038/nature06860
|