 Journal of Environmental Protection, 2013, 4, 123-141 http://dx.doi.org/10.4236/jep.2013.48A1015 Published Online August 2013 (http://www.scirp.org/journal/jep) 123 Volatile Organic Compound Emissions from Surface Coating Facilities: Characterization of Facilities, Estimation of Emission Rates, and Dispersion Modeling of Off-Site Impacts Annabrabha Athappan1, Sulak Sumitsawan2, Roja Haritha Gangupomu1, Ketwalee Kositkanawuth1, Parthen Parikh1, Benjamin Afotey3, Neelesh Sule4, Sahithi Raj Kalidindi1, Melanie L. Sattler1, Yvette Pearson Weatherton1 1Department of Civil Engineering, The University of Texas at Arlington, Arlington, USA; 2School of Energy and Environment, Uni- versity of Phayao, Phayao, Thailand; 3Department of Chemical Engineering, Kwame Nkrumah University of Science and Technol- ogy, Kumasi, Ghana; 4Providence Engineering, Irving, USA. Email: sattler@uta.edu Received May 26th, 2013; revised June 29th, 2013; accepted August 3rd, 2013 Copyright © 2013 Annabrabha Athappan et al. This is an open access article distributed under the Creative Commons Attribution License, which permits unrestricted use, distribution, and reproduction in any medium, provided the original work is properly cited. ABSTRACT Surface coating facilities are major sources of volatile organic compounds (VOCs) in urban areas. These VOCs can contribute to ground-level ozone formation, and many are hazardous air pollutants (HAPs), including xylene, ethylben- zene, and toluene. This project was conducted in order to provide information for updating the Texas Commission on Environmental Quality (TCEQ), USA, permit by rule for Surface Co ating Facilities. Project objectives were: 1) To de- velop a database of information regarding surface coating facilities in Texas; 2) To estimate maximum emission rates for various VOC species from surface coating facilities in Texas; 3) To conduct dispersion modeling to estimate off-site impacts from surface coating facilities. The database was developed using 286 TCEQ permit files authorizing surface coating facilities in Texa s during 2006 and 2007. The database was designed to includ e information important for esti- mating emission rates, and for using as inputs to the d ispersion model. Hour ly and annual emissions of volatile organic compounds (VOCs), particulate matter (PM), and exempt solvents (ES) were calculated for each permitted entity/ company in the database, according to equations given by TCEQ. Dispersion modeling was then conducted for 3 facil- ity configurations (worst-case stack height, good practice stack height, and fugitiv e emissions), for urban and rural dis- persion parameters, for 8-hour and 24-hour operating scenarios, and for 1-hour, 24-hour, and annual averaging times, for a total of 36 scenarios. The highest modeled concentrations were for the worst-case stack height, rural dispersion parameters, 24-hour operation scenario, and 1-hour averaging time. 108 specific chemical species, which are compo- nents of surface coatings, were identified as candidates for further health impacts review. Keywords: Volatile Organic Compounds; Hazardous Air Pollutants; Surface Coating Facilities; Emissions; Dispersion Modeling 1. Introduction Surface coating facilities apply decorative or protective coatings (paints, varnishes, lacqu ers) to substrates, which can include metals, wood, paper, plastic, and others. The coatings, in liquid or powder form, can be applied by a variety of methods, such as brushing, rolling, spraying, dipping and flow coating. After the coating is applied, the surface is air and/or heat dried to remove the volatile solvents from the coated surface [1]. Types of surface coating facilities include automobile refinishing shops and industrial facilities that apply coatings to products such as appliances, furniture, boilers, furnaces, pipes, cans, computers, and aircraft [2]. Surface coating facilities are major sources of volatile organic compounds (VOCs) in urban areas [3-5]. Surface coating facilities release VOCs when organic solvents in the coatings evaporate [6,7]. These VOCs can contribute to ground-level ozone formation, and many are hazard- ous air pollutants (HAPs) according to the US Clean Air Act, including xylene, ethylbenzene, and toluene. Copyright © 2013 SciRes. JEP 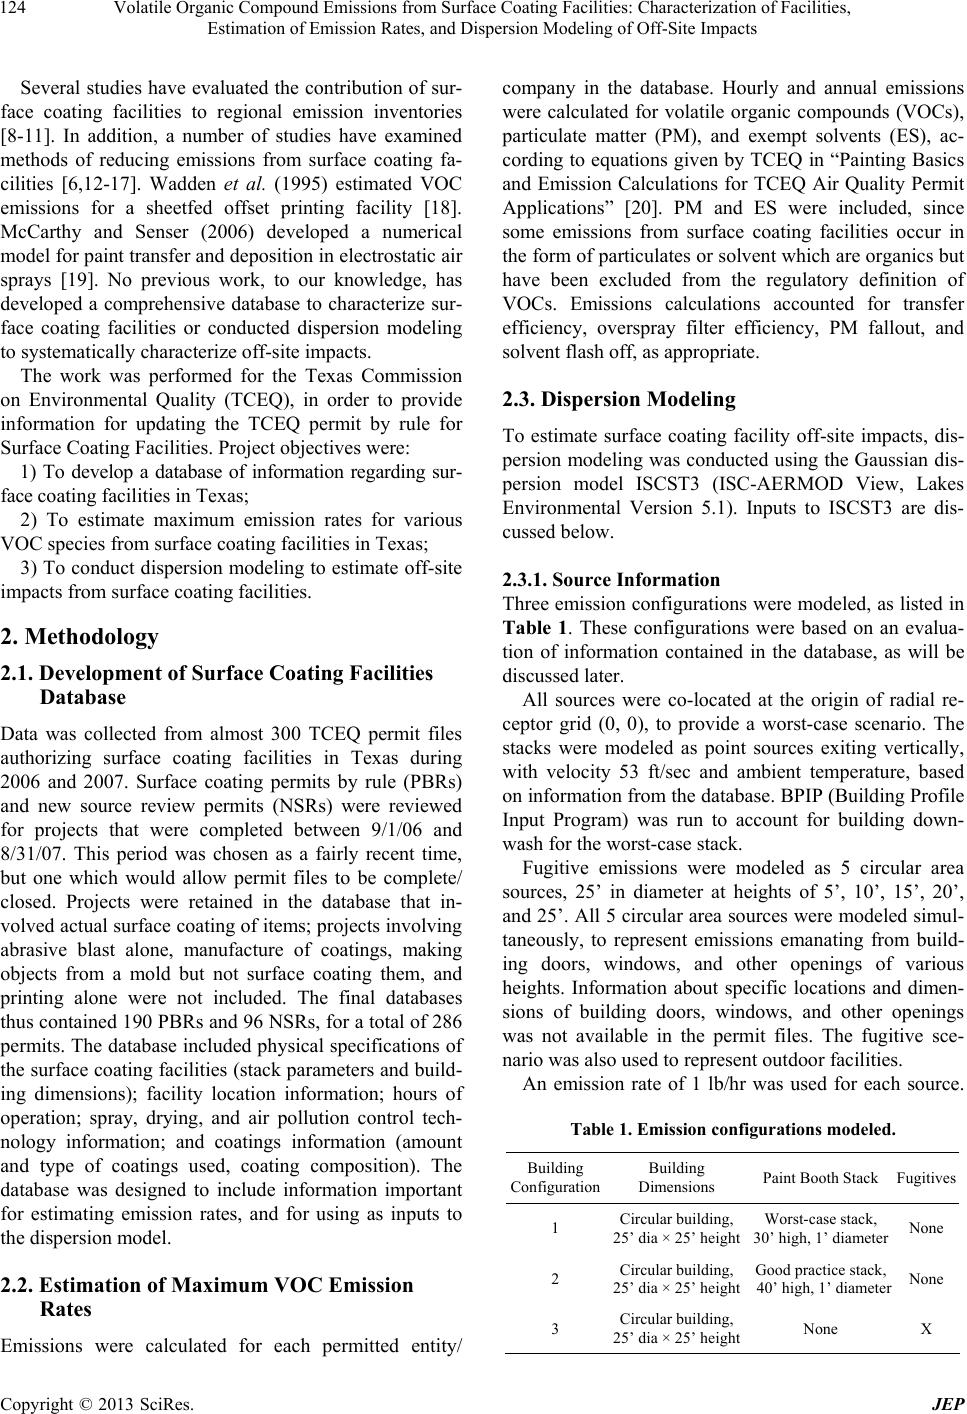 Volatile Organic Compound Emissions from Surface Coating Facilities: Characterization of Facilities, Estimation of Emission Rates, and Dispersion Modeling of Off-Site Impacts 124 Several studies have evaluated the contribution of sur- face coating facilities to regional emission inventories [8-11]. In addition, a number of studies have examined methods of reducing emissions from surface coating fa- cilities [6,12-17]. Wadden et al. (1995) estimated VOC emissions for a sheetfed offset printing facility [18]. McCarthy and Senser (2006) developed a numerical model for paint transfer and deposition in electrostatic air sprays [19]. No previous work, to our knowledge, has developed a comprehensive database to characterize sur- face coating facilities or conducted dispersion modeling to systematically characterize off-site impacts. The work was performed for the Texas Commission on Environmental Quality (TCEQ), in order to provide information for updating the TCEQ permit by rule for Surface Coating Facilities. Project objectives were: 1) To develop a database of information regarding sur- face coating facilities in Texas; 2) To estimate maximum emission rates for various VOC species from surface coating facilities in Texas; 3) To conduct dispersion modeling to estimate off-site impacts from surface coating facilities. 2. Methodology 2.1. Development of Surface Coating Facilities Database Data was collected from almost 300 TCEQ permit files authorizing surface coating facilities in Texas during 2006 and 2007. Surface coating permits by rule (PBRs) and new source review permits (NSRs) were reviewed for projects that were completed between 9/1/06 and 8/31/07. This period was chosen as a fairly recent time, but one which would allow permit files to be complete/ closed. Projects were retained in the database that in- volved actual surface coating of items; projects involving abrasive blast alone, manufacture of coatings, making objects from a mold but not surface coating them, and printing alone were not included. The final databases thus contained 190 PBRs and 96 NSRs, for a total of 286 permits. The database included physical specification s of the surface coating facilities (stack parameters and build- ing dimensions); facility location information; hours of operation; spray, drying, and air pollution control tech- nology information; and coatings information (amount and type of coatings used, coating composition). The database was designed to include information important for estimating emission rates, and for using as inputs to the dispersion model. 2.2. Estimation of Maximum VOC Emission Rates Emissions were calculated for each permitted entity/ company in the database. Hourly and annual emissions were calculated for volatile organic compounds (VOCs), particulate matter (PM), and exempt solvents (ES), ac- cording to equations given by TCEQ in “Painting Basics and Emission Calculations for TCEQ Air Quality Permit Applications” [20]. PM and ES were included, since some emissions from surface coating facilities occur in the form of particulates or solvent which are organics but have been excluded from the regulatory definition of VOCs. Emissions calculations accounted for transfer efficiency, overspray filter efficiency, PM fallout, and solvent flash off, as appropriate. 2.3. Dispersion Modeling To estimate surface coating facility off-site impacts, dis- persion modeling was conducted using the Gaussian dis- persion model ISCST3 (ISC-AERMOD View, Lakes Environmental Version 5.1). Inputs to ISCST3 are dis- cussed below. 2.3.1. Source Information Three emission configurations were modeled, as listed in Table 1. These configurations were based on an evalua- tion of information contained in the database, as will be discussed later. All sources were co-located at the origin of radial re- ceptor grid (0, 0), to provide a worst-case scenario. The stacks were modeled as point sources exiting vertically, with velocity 53 ft/sec and ambient temperature, based on information from the database. BPIP (Building Profile Input Program) was run to account for building down- wash for the worst-case stack. Fugitive emissions were modeled as 5 circular area sources, 25’ in diameter at heights of 5’, 10’, 15’, 20’, and 25’. All 5 circular area sources were modeled simul- taneously, to represent emissions emanating from build- ing doors, windows, and other openings of various heights. Information about specific locations and dimen- sions of building doors, windows, and other openings was not available in the permit files. The fugitive sce- nario was also used to represent outdoor facilities. An emission rate of 1 lb/hr was used for each source. Table 1. Emission configurations modeled. Building Configuration Building Dimensions Paint Booth StackFugitives 1 Circular building, 25’ dia × 25’ height Worst-case stack, 30’ high, 1’ diameter None 2 Circular building, 25’ dia × 25’ height Good practice stack, 40’ high, 1’ diameter None 3 Circular building, 25’ dia × 25’ height None X Copyright © 2013 SciRes. JEP 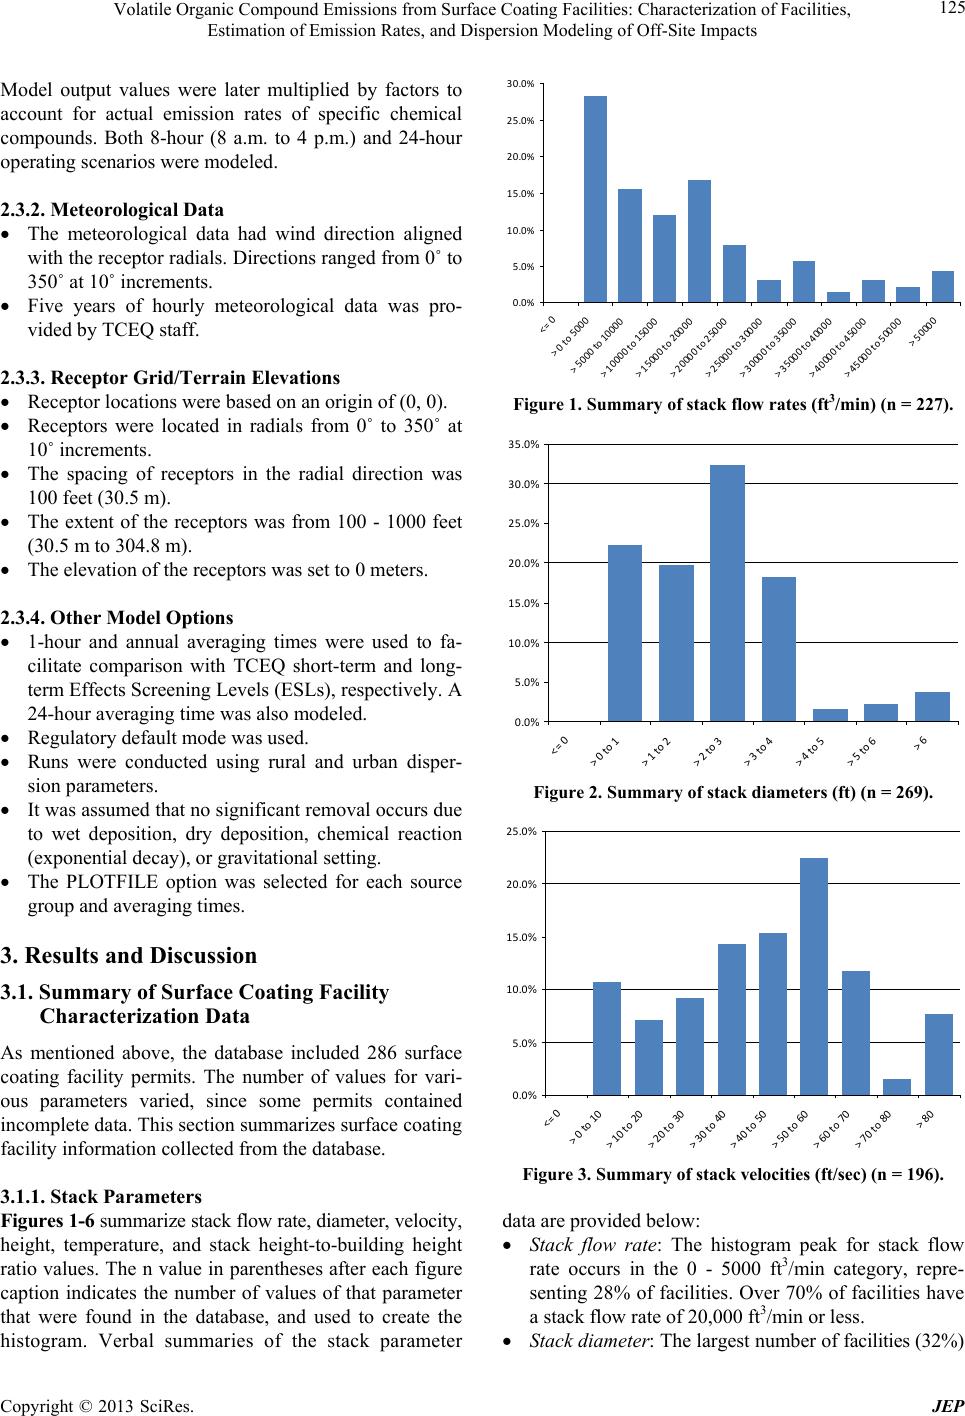 Volatile Organic Compound Emissions from Surface Coating Facilities: Characterization of Facilities, Estimation of Emission Rates, and Dispersion Modeling of Off-Site Impacts 125 Model output values were later multiplied by factors to account for actual emission rates of specific chemical compounds. Both 8-hour (8 a.m. to 4 p.m.) and 24-hour operating scenarios were modeled. 2.3.2. Me t eorologica l Data The meteorological data had wind direction aligned with the receptor radials. Directions ranged from 0˚ to 350˚ at 10˚ increments. Five years of hourly meteorological data was pro- vided by TCEQ staff. 2.3.3. Receptor Grid/Terrain Elevations Receptor locations were based on an origin of (0, 0). Receptors were located in radials from 0˚ to 350˚ at 10˚ increments. The spacing of receptors in the radial direction was 100 feet (3 0.5 m). The extent of the receptors was from 100 - 1000 feet (30.5 m to 304.8 m). The elevation of the receptors was set to 0 meters. 2.3.4. Other Model Opti o ns 1-hour and annual averaging times were used to fa- cilitate comparison with TCEQ short-term and long- term Effects Screening Levels (ESLs), respectively. A 24-hour averaging time was also modeled. Regulatory default mode was used. Runs were conducted using rural and urban disper- sion parameters. It was assumed that no significant removal occurs due to wet deposition, dry deposition, chemical reaction (exponential decay), or gravitational setting. The PLOTFILE option was selected for each source group and averaging times. 3. Results and Discussion 3.1. Summary of Surface Coating Facility Characterization Data As mentioned above, the database included 286 surface coating facility permits. The number of values for vari- ous parameters varied, since some permits contained incomplete data. This section summarizes surface coating facility information collected from the database. 3.1.1. Stack Para meters Figures 1-6 summarize stack flow rate, diameter, velocity, height, temperature, and stack height-to-building height ratio values. The n value in parentheses after each figure caption indicates the number of values of that parameter that were found in the database, and used to create the histogram. Verbal summaries of the stack parameter 0.0% 5.0% 10.0% 15.0% 20.0% 25.0% 30.0% <=0 >0to5000 >5000to10000 >10000to15000 >15000to20000 >20000to25000 >25000to30000 >30000to35000 >35000to40000 >40000to45000 >45000to50000 >50000 Figure 1. Summary of stack flow rates (ft3/min) (n = 227). 0.0% 5.0% 10.0% 15.0% 20.0% 25.0% 30.0% 35.0% <=0 >0to1 >1to2 >2to3 >3to4 >4to5 >5to6 >6 Figure 2. Summary of stack diameters (ft) (n = 269). 0.0% 5.0% 10.0% 15.0% 20.0% 25.0% <=0 >0to10 >10to20 >20to30 >30to40 >40to50 >50to60 >60to70 >70to80 >80 Figure 3. Summary of stack velocities (ft/sec) (n = 196). data are provided below : Stack flow rate: The histogram peak for stack flow rate occurs in the 0 - 5000 ft3/min category, repre- senting 28% of facilities. Over 70% of facilities have a stack flow rate of 20,000 ft3/min or less. Stack diameter: The largest number of facilities (32%) Copyright © 2013 SciRes. JEP 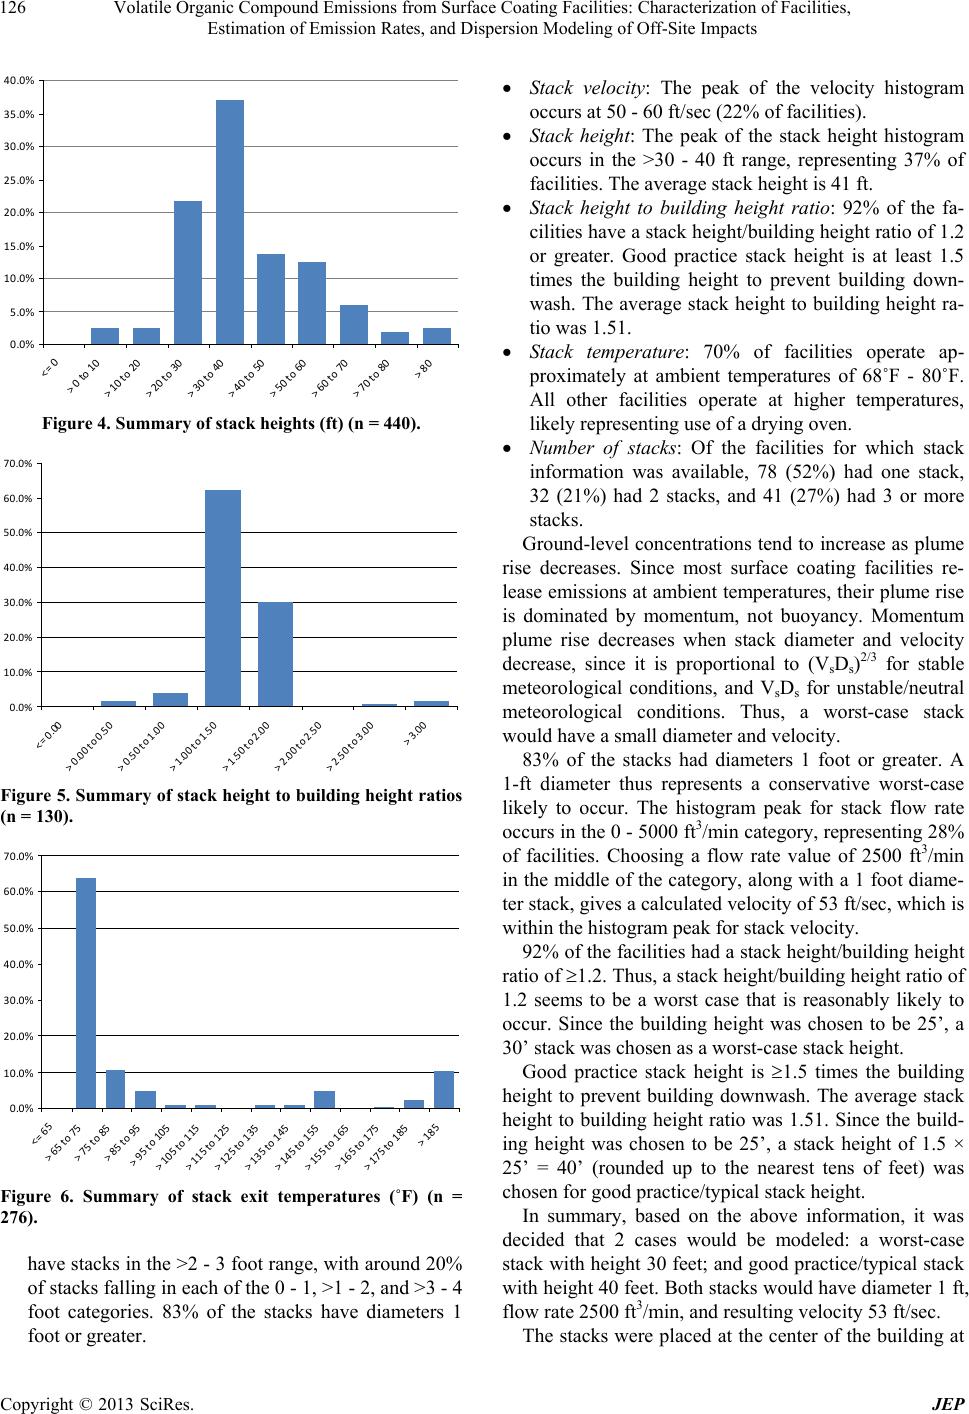 Volatile Organic Compound Emissions from Surface Coating Facilities: Characterization of Facilities, Estimation of Emission Rates, and Dispersion Modeling of Off-Site Impacts 126 0.0% 5.0% 10.0% 15.0% 20.0% 25.0% 30.0% 35.0% 40.0% <=0 >0to10 >10to20 >20to30 >30to40 >40to50 >50to60 >60to70 >70to80 >80 Figure 4. Summary of stack heights (ft) (n = 440). 0.0% 10.0% 20.0% 30.0% 40.0% 50.0% 60.0% 70.0% <=0.00 >0.00to0.50 >0.50to1.00 >1.00to1.50 >1.50to2.00 >2.00to2.50 >2.50to3.00 >3.00 Figure 5. Summary of stack he ight to building height ratios (n = 130). 0.0% 10.0% 20.0% 30.0% 40.0% 50.0% 60.0% 70.0 <=65 >65to75 >75to85 >85to95 >95to105 >105to115 >115to125 >125to135 >135to145 >145to155 >155to165 >165to175 >175to185 >185 Figure 6. Summary of stack exit temperatures (˚F) (n = 276). have stacks in the >2 - 3 foot range, with around 20% of stacks falling in each of the 0 - 1, >1 - 2, and >3 - 4 foot categories. 83% of the stacks have diameters 1 foot or greater. Stack velocity: The peak of the velocity histogram occurs at 50 - 60 ft/sec (22% of facilities). Stack height: The peak of the stack height histogram occurs in the >30 - 40 ft range, representing 37% of facilities. The average stack height is 41 ft. Stack height to building height ratio: 92% of the fa- cilities have a stack heigh t/building heigh t ratio of 1.2 or greater. Good practice stack height is at least 1.5 times the building height to prevent building down- wash. The average stack height to building height ra- tio was 1.51. Stack temperature: 70% of facilities operate ap- proximately at ambient temperatures of 68˚F - 80˚F. All other facilities operate at higher temperatures, likely representi ng u se of a drying o ven. Number of stacks: Of the facilities for which stack information was available, 78 (52%) had one stack, 32 (21%) had 2 stacks, and 41 (27%) had 3 or more stacks. Ground-level concentrations tend to increase as plume rise decreases. Since most surface coating facilities re- lease emissions at ambient temperatures, their plume rise is dominated by momentum, not buoyancy. Momentum plume rise decreases when stack diameter and velocity decrease, since it is proportional to (VsDs)2/3 for stable meteorological conditions, and VsDs for unstable/neutral meteorological conditions. Thus, a worst-case stack would have a small diameter and velocity. 83% of the stacks had diameters 1 foot or greater. A 1-ft diameter thus represents a conservative worst-case likely to occur. The histogram peak for stack flow rate occurs in the 0 - 5000 ft3/min category, representing 28% of facilities. Choosing a flow rate value of 2500 ft3/min in the middle of the category, along with a 1 foot diame- ter stack, gives a calculated velocity of 53 ft/sec, which is within the histogram peak for stack velocity. 92% of the facilities had a stack height/building height ratio of 1.2. Thus, a stack height/building height ratio of 1.2 seems to be a worst case that is reasonably likely to occur. Since the building height was chosen to be 25’, a 30’ stack was chosen as a worst-case stack height. Good practice stack height is 1.5 times the building height to prevent building downwash. The average stack height to building height ratio was 1.51. Since the build- ing height was chosen to be 25’, a stack height of 1.5 × 25’ = 40’ (rounded up to the nearest tens of feet) was chosen for good practice/typical stack height. In summary, based on the above information, it was decided that 2 cases would be modeled: a worst-case stack with height 30 feet; and good practice/typical stack with height 40 feet. Both stacks would have diameter 1 ft, flow rate 2500 ft3/min, and resulting velocity 53 ft/sec. The stacks were placed at the center of the building at Copyright © 2013 SciRes. JEP 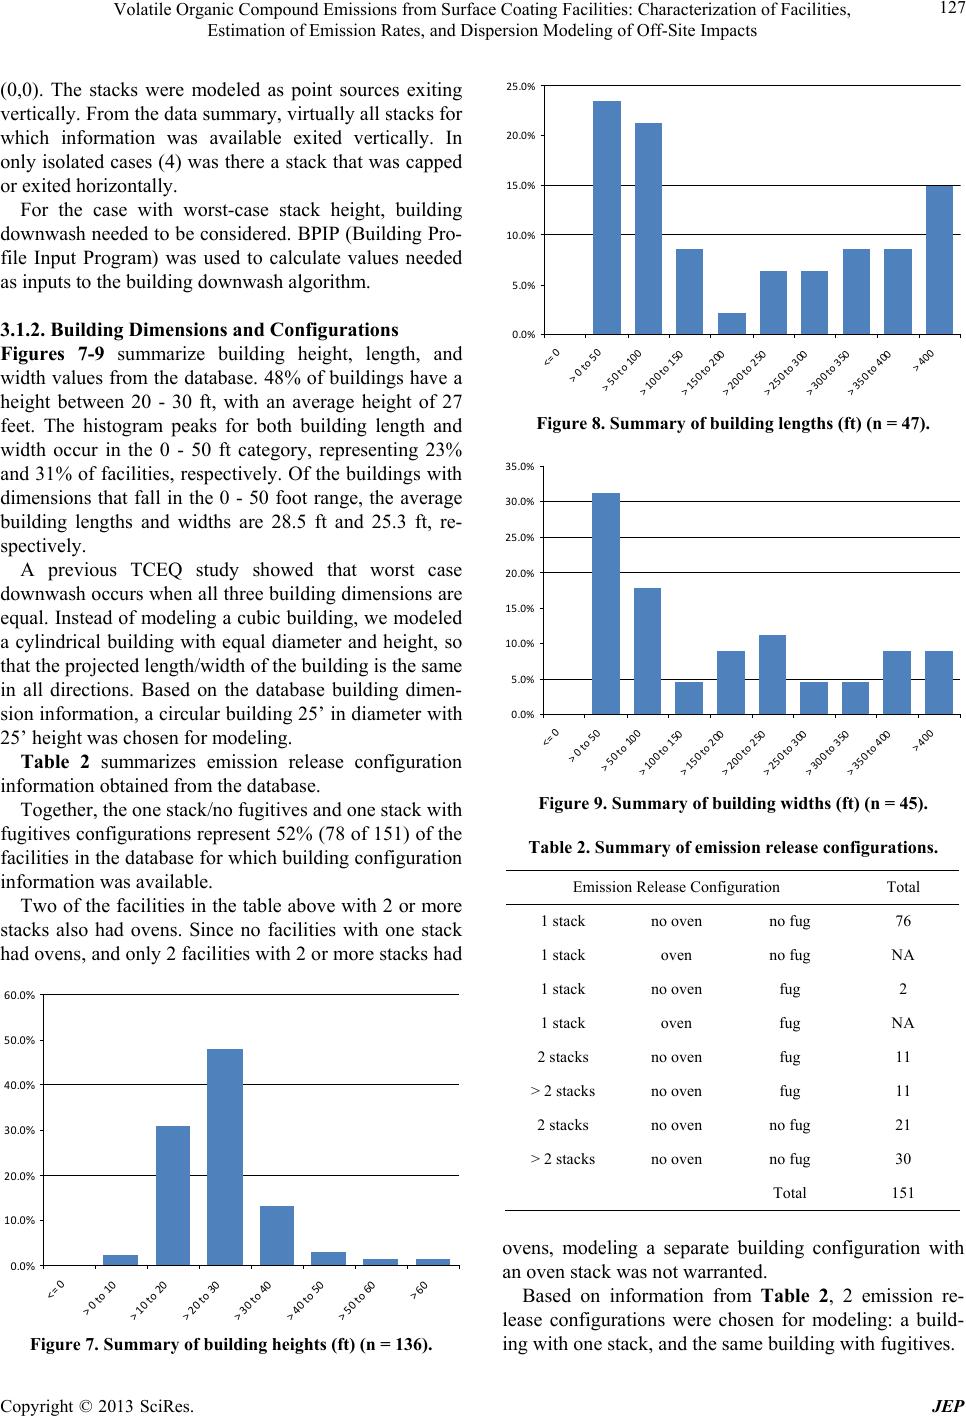 Volatile Organic Compound Emissions from Surface Coating Facilities: Characterization of Facilities, Estimation of Emission Rates, and Dispersion Modeling of Off-Site Impacts 127 (0,0). The stacks were modeled as point sources exiting vertically. From the data summary, virtually all stacks for which information was available exited vertically. In only isolated cases (4) was there a stack that was capped or exited horizontally. For the case with worst-case stack height, building downwash needed to be considered. BPIP (Building Pro- file Input Program) was used to calculate values needed as inputs to the building downwash algorithm. 3.1.2. Buil di ng Di mensi o ns and Configurati ons Figures 7-9 summarize building height, length, and width values from the database. 48% of buildings have a height between 20 - 30 ft, with an average height of 27 feet. The histogram peaks for both building length and width occur in the 0 - 50 ft category, representing 23% and 31% of facilities, respectively. Of the buildings with dimensions that fall in the 0 - 50 foot range, the average building lengths and widths are 28.5 ft and 25.3 ft, re- spectively. A previous TCEQ study showed that worst case downwash occurs when all three building dimensions are equal. Instead of modeling a cubic building, we modeled a cylindrical building with equal diameter and height, so that the projected length/width of the building is the same in all directions. Based on the database building dimen- sion information, a circular building 25’ in diameter with 25’ heigh t was chosen for mod eling. Table 2 summarizes emission release configuration information obtained from the database. Together, the one stack/no fugitives and one stack with fugitives configuration s represent 52% (78 of 151) of the facilities in the database for wh ich building co nfiguration information was available. Two of the facilities in th e table above with 2 or more stacks also had ovens. Since no facilities with one stack had ovens, and on ly 2 facilities with 2 o r more stacks had 0.0% 10.0% 20.0% 30.0% 40.0% 50.0% 60.0 <=0 >0to10 >10to20 >20to30 >30to40 >40to50 >50to60 >60 Figure 7. Summary of building heights (ft) (n = 136). 0.0% 5.0% 10.0% 15.0% 20.0% 25.0% <=0 >0to50 >50to100 >100to150 >150to200 >200to250 >250to300 >300to350 >350to400 >400 Figure 8. Summary of building lengths (ft) (n = 47). 0.0% 5.0% 10.0% 15.0% 20.0% 25.0% 30.0% 35.0% <=0 >0to50 >50to100 >100to150 >150to200 >200to250 >250to300 >300to350 >350to400 >400 Figure 9. Summary of building widths (ft) (n = 45). Table 2. Summary of emission release configurations. Emission Releas e Configuration Total 1 stack no oven no fug 76 1 stack oven no fug NA 1 stack no oven fug 2 1 stack oven fug NA 2 stacks no oven fug 11 > 2 stacks no oven fug 11 2 stacks no oven no fug 21 > 2 stacks no oven no fug 30 Total 151 ovens, modeling a separate building configuration with an oven sta ck w as no t warra nted. Based on information from Table 2, 2 emission re- lease configurations were chosen for modeling: a build- ing with one stack, and the same bu ilding with fugitives. Copyright © 2013 SciRes. JEP 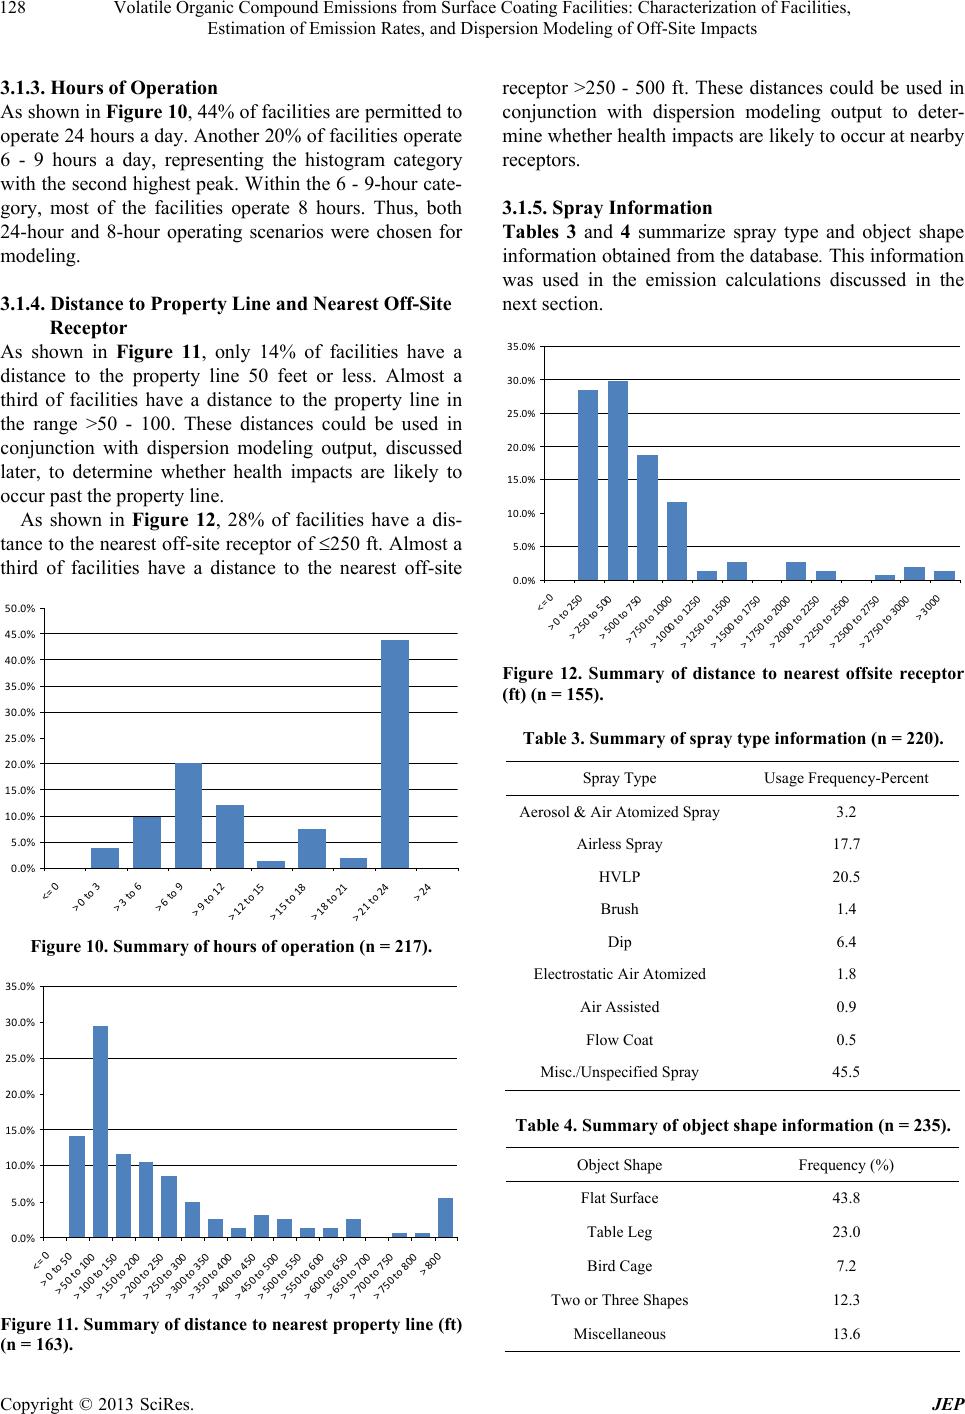 Volatile Organic Compound Emissions from Surface Coating Facilities: Characterization of Facilities, Estimation of Emission Rates, and Dispersion Modeling of Off-Site Impacts 128 3.1.3. Hours of Opera tion As shown in Figure 10, 44% of facilities are permitted to operate 24 hours a day. Another 20% of facilities operate 6 - 9 hours a day, representing the histogram category with the second h ighest peak. With in the 6 - 9-hour cate- gory, most of the facilities operate 8 hours. Thus, both 24-hour and 8-hour operating scenarios were chosen for modeling. 3.1.4. Distance to Property Line and Nearest Off-Site Receptor As shown in Figure 11, only 14% of facilities have a distance to the property line 50 feet or less. Almost a third of facilities have a distance to the property line in the range >50 - 100. These distances could be used in conjunction with dispersion modeling output, discussed later, to determine whether health impacts are likely to occur past the property line. As shown in Figure 12, 28% of facilities have a dis- tance to the nearest off-site receptor of 250 ft. Almost a third of facilities have a distance to the nearest off-site 0.0% 5.0% 10.0% 15.0% 20.0% 25.0% 30.0% 35.0% 40.0% 45.0% 50.0% <=0 >0to3 >3to6 >6to9 >9to12 >12to15 >15to18 >18to21 >21to24 >24 Figure 10. Summary of hours of operation (n = 217). 0.0% 5.0% 10.0% 15.0% 20.0% 25.0% 30.0% 35.0% <=0 >0to50 >50to100 >100to150 >150to200 >200to250 >250to300 >300to350 >350to400 >400to450 >450to500 >500to550 >550to600 >600to650 >650to700 >700to750 >750to800 >800 Figure 11. Summary of distance to nearest property line (ft) (n = 163). receptor >250 - 500 ft. These distances could be used in conjunction with dispersion modeling output to deter- mine whether health impacts are likely to occur at nearby receptors. 3.1.5. Spray Informatio n Tables 3 an d 4 summarize spray type and object shape information obtained from the database. This information was used in the emission calculations discussed in the next section. 0.0% 5.0% 10.0% 15.0% 20.0% 25.0% 30.0% 35.0% <=0 >0to250 >250to500 >500to750 >750to1000 >1000to1250 >1250to1500 >1500to1750 >1750to2000 >2000to2250 >2250to2500 >2500to2750 >2750to3000 >3000 Figure 12. Summary of distance to nearest offsite receptor (ft) (n = 155). Table 3. Summary of spray type information (n = 220). Spray Type Usage Frequency-Percent Aerosol & Air Atomized Spray3.2 Airless Spray 17.7 HVLP 20.5 Brush 1.4 Dip 6.4 Electrostatic Air Atomized 1.8 Air Assisted 0.9 Flow Coat 0.5 Misc./Unspecified Spray 45.5 Table 4. Summary of object shape information (n = 235). Object Shape Frequency (%) Flat Surface 43.8 Table Leg 23.0 Bird Cage 7.2 Two or Three Shapes 12.3 Miscellaneous 13.6 Copyright © 2013 SciRes. JEP 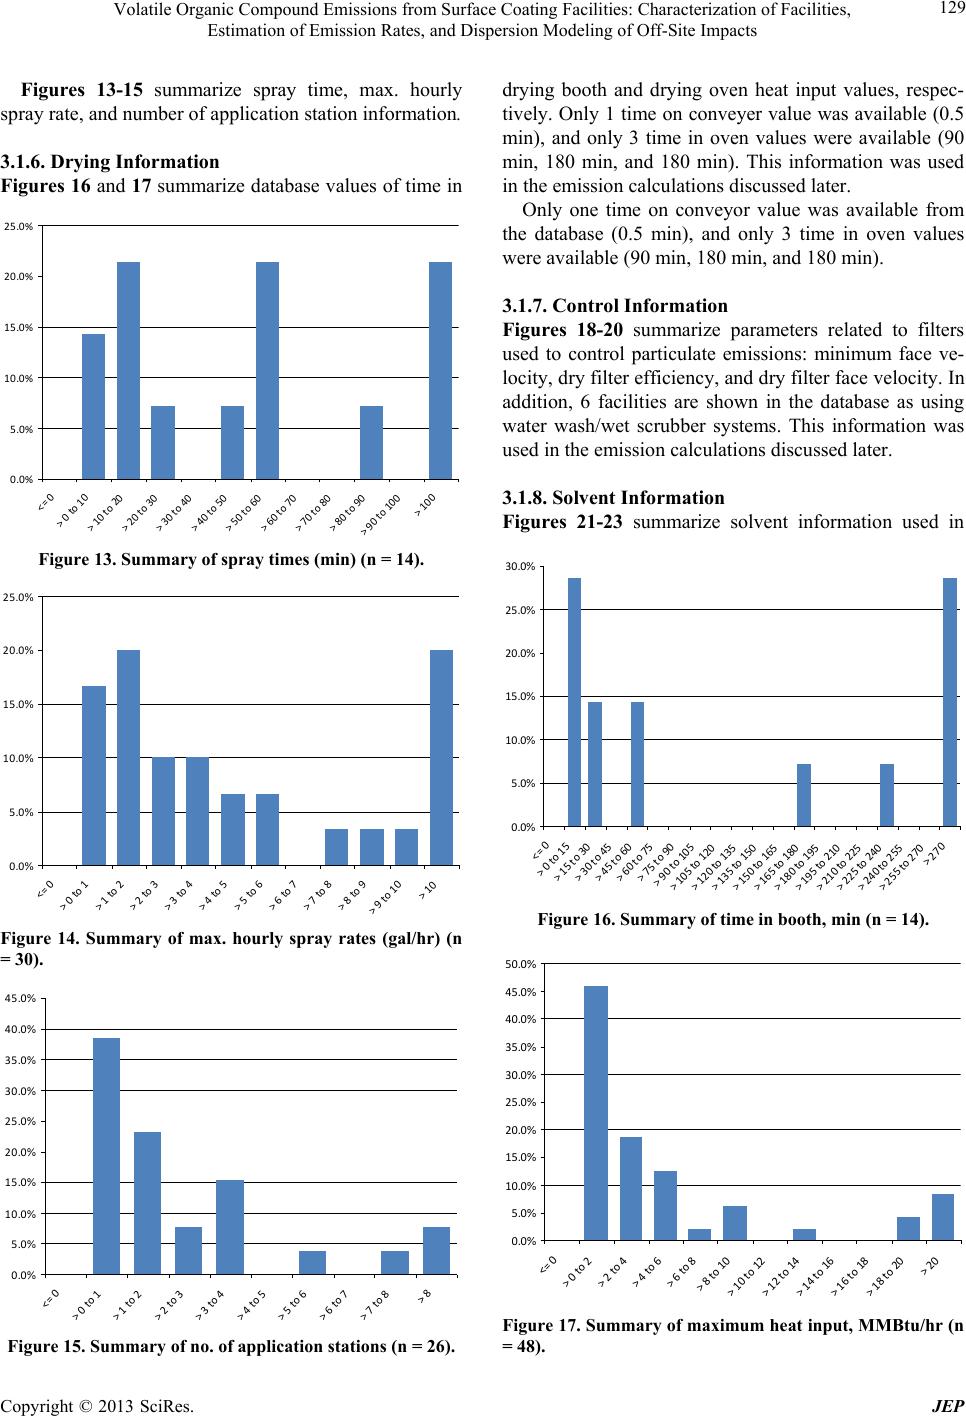 Volatile Organic Compound Emissions from Surface Coating Facilities: Characterization of Facilities, Estimation of Emission Rates, and Dispersion Modeling of Off-Site Impacts 129 Figures 13-15 summarize spray time, max. hourly spray rate, and number of applicat i on stati on i nf ormation. 3.1.6. Dryi ng Info rmation Figures 16 and 17 summarize database valu es of time in 0.0% 5.0% 10.0% 15.0% 20.0% 25.0% <=0 >0to10 >10to20 >20to30 >30to40 >40to50 >50to60 >60to70 >70to80 >80to90 >90to100 >100 Figure 13. Summary of spray times (min) (n = 14). 0.0% 5.0% 10.0% 15.0% 20.0% 25.0% <=0 >0to1 >1to2 >2to3 >3to4 >4to5 >5to6 >6to7 >7to8 >8to9 >9to10 >10 Figure 14. Summary of max. hourly spray rates (gal/hr) (n = 30). 0.0% 5.0% 10.0% 15.0% 20.0% 25.0% 30.0% 35.0% 40.0% 45.0% <=0 >0to1 >1to2 >2to3 >3to4 >4to5 >5to6 >6to7 >7to8 >8 Figure 15. Summary of no. of application stations (n = 26). drying booth and drying oven heat input values, respec- tively. Only 1 ti me on conveyer valu e was available (0.5 min), and only 3 time in oven values were available (90 min, 180 min, and 180 min). This information was used in the emission calculations discussed later. Only one time on conveyor value was available from the database (0.5 min), and only 3 time in oven values were available (90 min, 180 min, and 180 min). 3.1.7. Control In formation Figures 18-20 summarize parameters related to filters used to control particulate emissions: minimum face ve- locity, dry filter efficiency, and dry filter face velocity. In addition, 6 facilities are shown in the database as using water wash/wet scrubber systems. This information was used in the emission calculations discussed later. 3.1.8. So lvent In formation Figures 21-23 summarize solvent information used in 0.0% 5.0% 10.0% 15.0% 20.0% 25.0% 30.0% <=0 >0to15 >15to30 >30to45 >45to60 >60to75 >75to90 >90to105 >105to120 >120to135 >135to150 >150to165 >165to180 >180to195 >195to210 >210to225 >225to240 >240to255 >255to270 >270 Figure 16. Summary of time in booth, min (n = 14). 0.0% 5.0% 10.0% 15.0% 20.0% 25.0% 30.0% 35.0% 40.0% 45.0% 50.0% <=0 >0to2 >2to4 >4to6 >6to8 >8to10 >10to12 >12to14 >14to16 >16to18 >18to20 >20 Figure 17. Summary of maximum heat input, MMBtu/hr (n = 48). Copyright © 2013 SciRes. JEP 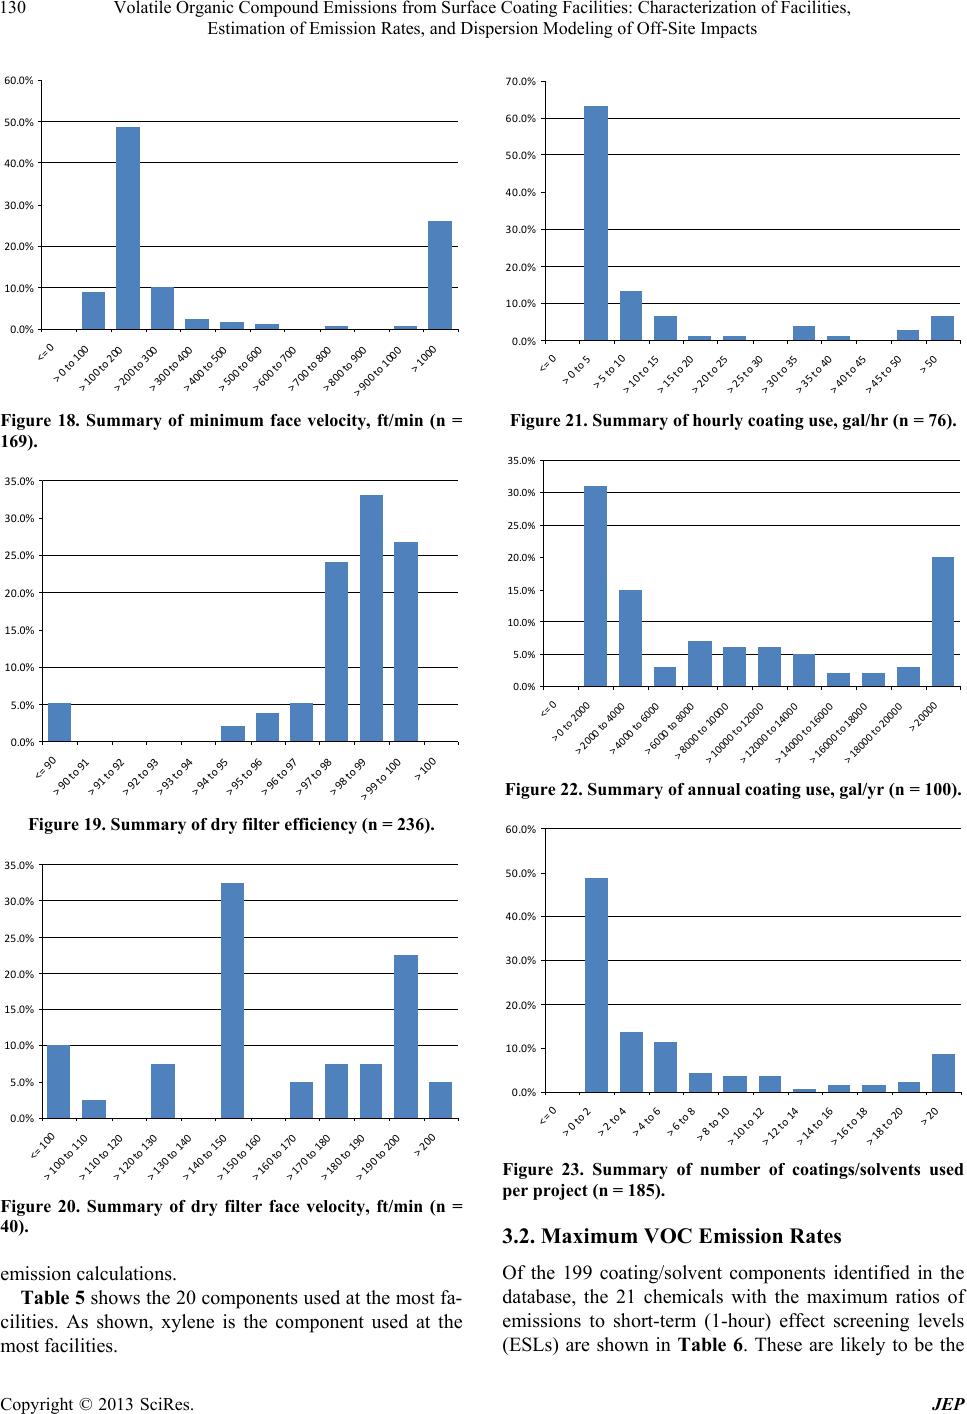 Volatile Organic Compound Emissions from Surface Coating Facilities: Characterization of Facilities, Estimation of Emission Rates, and Dispersion Modeling of Off-Site Impacts 130 0.0% 10.0% 20.0% 30.0% 40.0% 50.0% 60.0 <=0 >0to100 >100to200 >200to300 >300to400 >400to500 >500to600 >600to700 >700to800 >800to900 >900to1000 >1000 Figure 18. Summary of minimum face velocity, ft/min (n = 169). 0.0% 5.0% 10.0% 15.0% 20.0% 25.0% 30.0% 35.0% <=90 >90to91 >91to92 >92to93 >93to94 >94to95 >95to96 >96to97 >97to98 >98to99 >99to100 >100 Figure 19. Summary of dry filt er effici ency (n = 236). 0.0% 5.0% 10.0% 15.0% 20.0% 25.0% 30.0% 35.0% <=100 >100to110 >110to120 >120to130 >130to140 >140to150 >150to160 >160to170 >170to180 >180to190 >190to200 >200 Figure 20. Summary of dry filter face velocity, ft/min (n = 40). emission calculations. Table 5 shows the 20 components used at the most fa- cilities. As shown, xylene is the component used at the most facilities. 0.0% 10.0% 20.0% 30.0% 40.0% 50.0% 60.0% 70.0% <=0 >0to5 >5to10 >10to15 >15to20 >20to25 >25to30 >30to35 >35to40 >40to45 >45to50 >50 Figure 21. Summary of hourly coating use, gal/hr (n = 76). 0.0% 5.0% 10.0% 15.0% 20.0% 25.0% 30.0% 35.0% <=0 >0to2000 >2000to4000 >4000to6000 >6000to8000 >8000to10000 >10000to12000 >12000to14000 >14000to16000 >16000to18000 >18000to20000 >20000 Figure 22. Summary of annual coating use, gal/yr (n = 100). 0.0% 10.0% 20.0% 30.0% 40.0% 50.0% 60.0% <=0 >0to2 >2to4 >4to6 >6to8 >8to10 >10to12 >12to14 >14to16 >16to18 >18to20 >20 Figure 23. Summary of number of coatings/solvents used per project (n = 185). 3.2. Maximum VOC Emission Rates Of the 199 coating/solvent components identified in the database, the 21 chemicals with the maximum ratios of emissions to short-term (1-hour) effect screening levels (ESLs) are shown in Table 6. These are likely to be the Copyright © 2013 SciRes. JEP 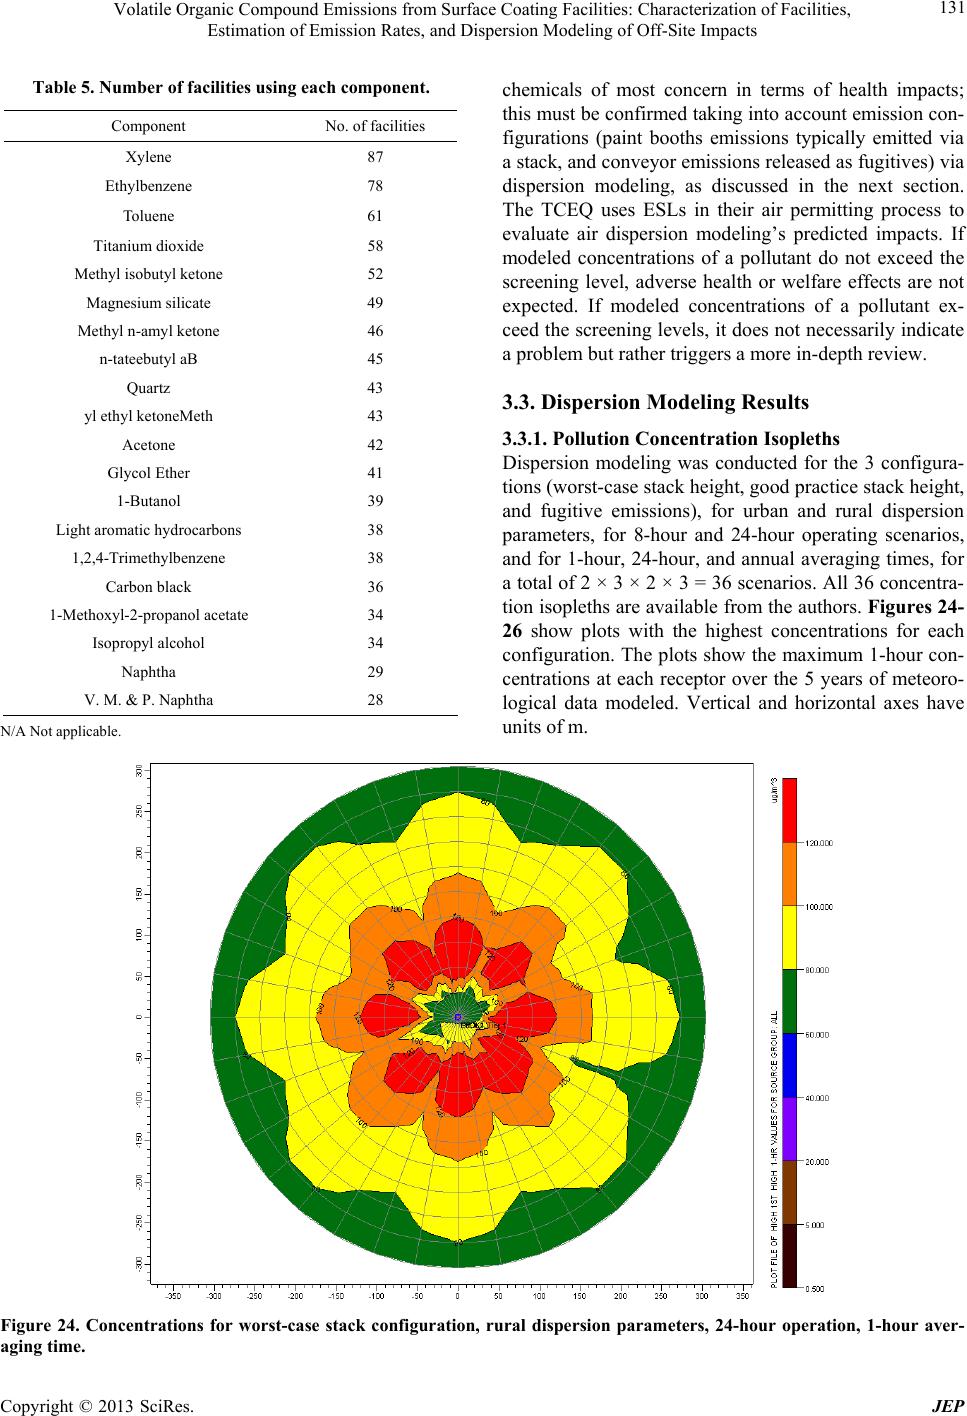 Volatile Organic Compound Emissions from Surface Coating Facilities: Characterization of Facilities, Estimation of Emission Rates, and Dispersion Modeling of Off-Site Impacts Copyright © 2013 SciRes. JEP 131 Table 5. Number of facilities using each component. Component No. of facilities Xylene 87 Ethylbenzene 78 Toluene 61 Titanium dioxide 58 Methyl isobutyl ketone 52 Magnesium silicate 49 Methyl n-amyl ketone 46 n-tateebutyl aB 45 Quartz 43 yl ethyl ketoneMeth 43 Acetone 42 Glycol Ether 41 1-Butanol 39 Light aromatic hydrocarbons 38 1,2,4-Trimethylbenzene 38 Carbon black 36 1-Methoxyl-2-propanol acetate 34 Isopropyl alcohol 34 Naphtha 29 V. M. & P. Naphtha 28 chemicals of most concern in terms of health impacts; this must be confirmed taking into account emission con- figurations (paint booths emissions typically emitted via a stack, and conveyor emissions released as fugitives) via dispersion modeling, as discussed in the next section. The TCEQ uses ESLs in their air permitting process to evaluate air dispersion modeling’s predicted impacts. If modeled concentrations of a pollutant do not exceed the screening level, adverse health or welfare effects are not expected. If modeled concentrations of a pollutant ex- ceed the screening levels, it does not necessarily indicate a problem but rather triggers a more in-depth review. 3.3. Dispersion Modeling Results 3.3.1. Pollution Concentration Isopleths Dispersion modeling was conducted for the 3 configura- tions (worst-case stack height, good practice stack height, and fugitive emissions), for urban and rural dispersion parameters, for 8-hour and 24-hour operating scenarios, and for 1-hour, 24-hour, and annual averaging times, for a total of 2 × 3 × 2 × 3 = 36 scenarios. All 36 concentra- tion isopleths are available from the authors. Figures 24- 26 show plots with the highest concentrations for each configuration. The plots show the maximum 1-hour con- centrations at each receptor over the 5 years of meteoro- logical data modeled. Vertical and horizontal axes have units of m . N/A Not applicable. Figure 24. Concentrations for worst-case stack configuration, rural dispersion parameters, 24-hour operation, 1-hour aver- aging time. 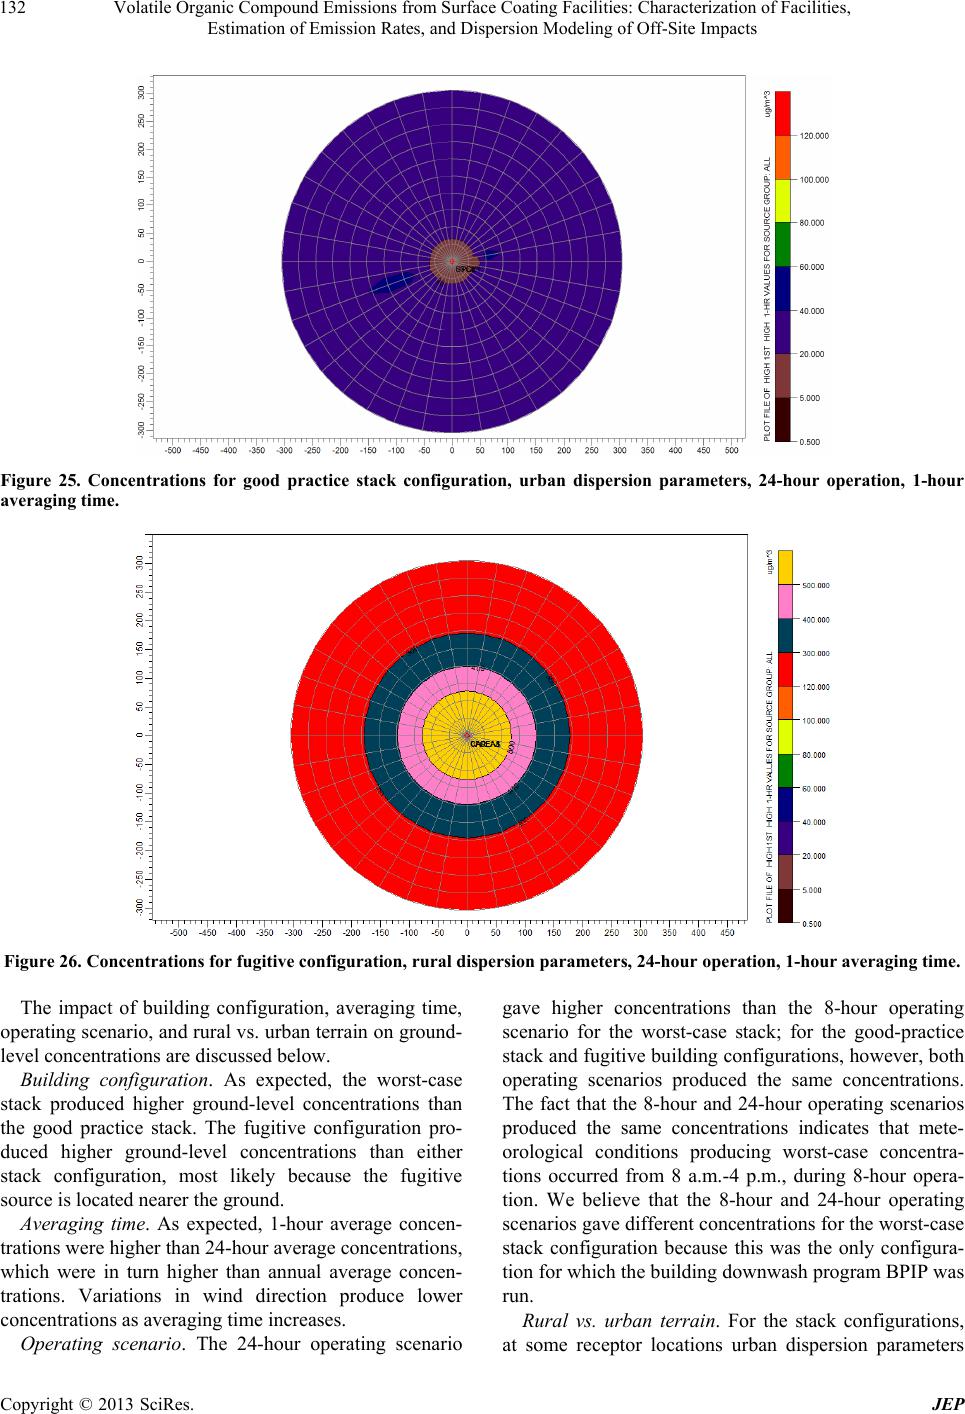 Volatile Organic Compound Emissions from Surface Coating Facilities: Characterization of Facilities, Estimation of Emission Rates, and Dispersion Modeling of Off-Site Impacts 132 Figure 25. Concentrations for good practice stack configuration, urban dispersion parameters, 24-hour operation, 1-hour averaging time. Figure 26. Concentrations for fugitive configuration, rural dispersion parameters, 24-hour operation, 1-hour averaging time. The impact of building configuration, averaging time, operating scenario, and rural vs. urban terrain on ground- level concentrations are discussed below. Building configuration. As expected, the worst-case stack produced higher ground-level concentrations than the good practice stack. The fugitive configuration pro- duced higher ground-level concentrations than either stack configuration, most likely because the fugitive source is located nearer the ground. Averaging time. As expected, 1-hour average concen- trations were higher than 24-hour average concentrations, which were in turn higher than annual average concen- trations. Variations in wind direction produce lower concentrations as averaging time increases. Operating scenario. The 24-hour operating scenario gave higher concentrations than the 8-hour operating scenario for the worst-case stack; for the good-practice stack and fugitive bu ilding configurations, howev er, both operating scenarios produced the same concentrations. The fact that the 8-hour and 24-hour operating scenarios produced the same concentrations indicates that mete- orological conditions producing worst-case concentra- tions occurred from 8 a.m.-4 p.m., during 8-hour opera- tion. We believe that the 8-hour and 24-hour operating scenarios gave different concentrations for the worst-case stack configuration because this was the only configura- tion for which the building downwash program BPIP was run. Rural vs. urban terrain. For the stack configurations, at some receptor locations uban dispersion parameters r Copyright © 2013 SciRes. JEP 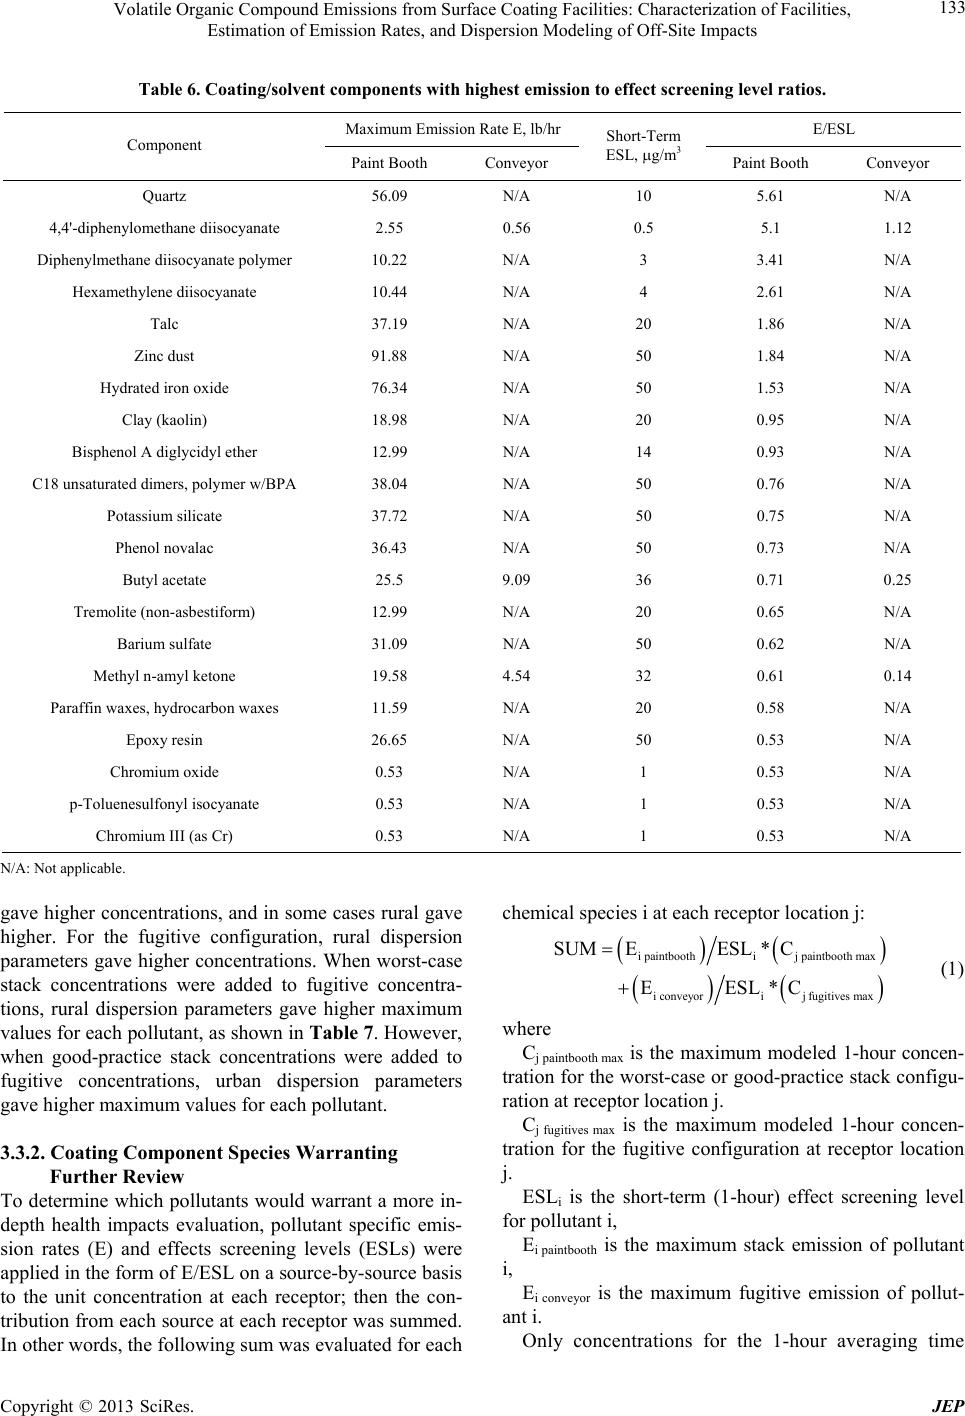 Volatile Organic Compound Emissions from Surface Coating Facilities: Characterization of Facilities, Estimation of Emission Rates, and Dispersion Modeling of Off-Site Impacts 133 Table 6. Coating/solvent components with highest emission to effect screening level ratios. Maximum Emission Rate E, lb/hr E/ESL Component Paint Booth Conveyor Short-Term ESL, g/m3 Paint Booth Conveyor Quartz 56.09 N/A 10 5.61 N/A 4,4'-diphenylomethane diisocyanate 2.55 0.56 0.5 5.1 1.12 Diphenylmethane diisocyanate polymer 10.22 N / A 3 3.41 N/A Hexamethylene diisocyanate 10.44 N/A 4 2.61 N/A Talc 37.19 N/A 20 1.86 N/A Zinc dust 91.88 N/A 50 1.84 N/A Hydrated iron oxide 76.34 N/A 50 1.53 N/A Clay (kaolin) 18.98 N/A 20 0.95 N/A Bisphenol A diglycidyl ether 12.99 N/A 14 0.93 N/A C18 unsaturated dimers, polymer w/BPA 38.04 N/A 50 0.76 N/A Potassium silicate 37.72 N/A 50 0.75 N/A Phenol novalac 36.43 N/A 50 0.73 N/A Butyl acetate 25.5 9.09 36 0.71 0.25 Tremolite (non-asbestiform) 12.99 N/A 20 0.65 N/A Barium sulfate 31.09 N/A 50 0.62 N/A Methyl n-amyl ketone 19.58 4.54 32 0.61 0.14 Paraffin waxes, hydrocarbon waxes 11.59 N/A 20 0.58 N/A Epoxy resin 26.65 N/A 50 0.53 N/A Chromium oxide 0.53 N/A 1 0.53 N/A p-Toluenesulfonyl isocyanate 0.53 N/A 1 0.53 N/A Chromium III (as Cr) 0.53 N/A 1 0.53 N/A N/A: Not applicable. gave higher concentrations, and in some cases rural gave higher. For the fugitive configuration, rural dispersion parameters gave higher concentrations. When worst-case stack concentrations were added to fugitive concentra- tions, rural dispersion parameters gave higher maximum values for each po llutant, as shown in Tab le 7. How ever, when good-practice stack concentrations were added to fugitive concentrations, urban dispersion parameters gave higher maximum values for each pollutant. 3.3.2. Coati ng Componen t Species Warranting Furt her Revi ew To determine which po llutants would warrant a more in- depth health impacts evaluation, pollutant specific emis- sion rates (E) and effects screening levels (ESLs) were applied in the form of E/ESL on a source-by-source basis to the unit concentration at each receptor; then the con- tribution from each source at each receptor was summed. In other words, the following sum was evaluated for each chemical species i at each receptor location j: i paintboothij paintbooth max iconveyorij fugitivesmax SUMEESL*C EESL*C (1) where Cj paintbooth max is the maximum modeled 1-hour concen- tration for the worst-case or good-practice stack configu- ration at receptor location j. Cj fugitives max is the maximum modeled 1-hour concen- tration for the fugitive configuration at receptor location j. ESLi is the short-term (1-hour) effect screening level for pollutant i, Ei paintbooth is the maximum stack emission of pollutant i, Ei conveyor is the maximum fugitive emission of pollut- ant i. Only concentrations for the 1-hour averaging time Copyright © 2013 SciRes. JEP  Volatile Organic Compound Emissions from Surface Coating Facilities: Characterization of Facilities, Estimation of Emission Rates, and Dispersion Modeling of Off-Site Impacts 134 Table 7. Maximum SUM values for worst-case stack + fugitives. Rural 8-hour o p e ration Rural 24-hour o p e ration Urban 24-hour operation Compound Short-Term ESL, mg/m3 Max. Sum of (E/ESL)*C, lb/hr No. of Sum Values > 1 Max. Sum of (E/ESL)*C, lb/hr No. of Sum Values > 1 Max. Sum of (E/ESL)*C, lb/hr No. of Sum Values > 1 1,3,5-Trimethylbenzene 1250 1.5 128 1.5 163 1.5 37 2,4-pentanedione 40 4.7 360 5.1 360 4.5 360 2-Butoxy ethanol 210 14.4 360 14.9 360 14.1 360 2-Butoxyethyl acetate 310 6.0 360 6.3 360 5.9 360 4,4’-diphenylomethane diisocyanate0.5 1287 360 1342 360 1255.4 360 Acrylic polymer A 50 12.2 360 13.2 360 11.6 360 Alkyl phthalate 50 16.6 360 17.9 360 15.8 360 Aluminum flakes 50 9.9 360 10.6 360 9.4 360 Aluminum oxide 50 5.4 360 5.8 360 5.1 360 Aluminum silicate 50 24.0 360 25.9 360 22.9 360 Anthophyllite (non-asbestiform) 20 3.1 353 3.3 360 2.9 360 Antigorite 20 17.4 360 18.8 360 16.6 360 Barium chromate 0.1 13.3 360 14.4 360 12.7 360 Barium metaborate hydrate 50 9.3 360 10.0 360 8.81 360 Barium sulfate 50 84.6 360 91.3 360 80.6 360 Benzyl alcohol 500 3.0 342 3.1 360 2.9 360 Bisphenol A diglycidyl ether 14 126.2 360 136.2 360 120.3 360 Butoxyethoxyethanol 1060 2.8 330 3.0 360 2.7 218 Butyl acetate 36 230.1 360 237.7 360 225.8 360 Butyl alcohol 610 5.4 360 5.5 360 5.33 360 C18 unsaturated dimers, polymer w/BPA and ech 50 103.5 360 111.7 360 98.6 360 Calcium carbonate 50 28.8 360 31.1 360 27.5 360 Calcium magnesium carbonate 50 9.9 360 10.6 360 9.4 360 Ceramic metals and wares 50 31.9 360 34.4 360 30.4 360 Chromium III (as Cr) 1 72.1 360 77.8 360 68.7 360 Chromium oxide 1 72.1 360 77.8 360 68.7 360 Clay 50 26.9 360 29.0 360 25.6 360 Clay (kaolin) 20 129.1 360 139.3 360 123.0 360 Clay 68911-87-5 100 6.6 360 7.1 360 6.3 360 Cyclic amine epoxy polymer 50 30.8 360 33.2 360 29.3 360 Cyclohexanone 480 6.2 360 6.4 360 6.0 360 Diacetone alcohol 960 2.2 231 2.2 288 2.1 108 Diaminocyclohexane 470 2.9 340 3.1 360 2.74 237 Dibasic esters 100 8.1 360 8.3 360 7.9 360 Diethylenetriamine 40 19.4 360 20.1 360 19.1 360 Copyright © 2013 SciRes. JEP 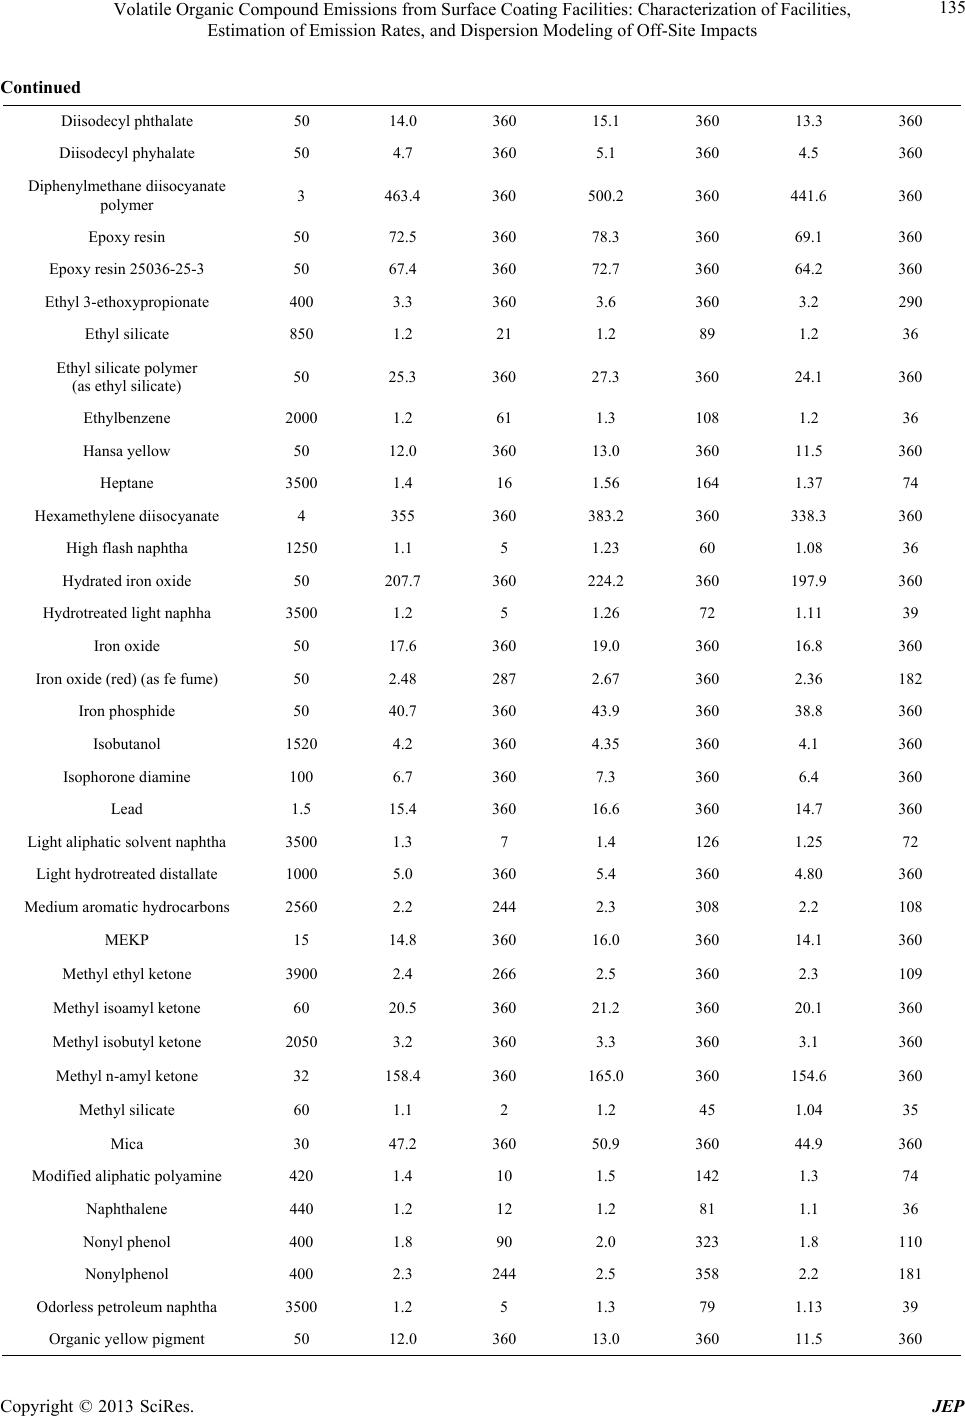 Volatile Organic Compound Emissions from Surface Coating Facilities: Characterization of Facilities, Estimation of Emission Rates, and Dispersion Modeling of Off-Site Impacts 135 Continued Diisodecyl phthalate 50 14.0 360 15.1 360 13.3 360 Diisodecyl phyhalate 50 4.7 360 5.1 360 4.5 360 Diphenylmethane diisocyanate polymer 3 463.4 360 500.2 360 441.6 360 Epoxy resin 50 72.5 360 78.3 360 69.1 360 Epoxy resin 25036-25-3 50 67.4 360 72.7 360 64.2 360 Ethyl 3-ethoxypropionate 400 3.3 360 3.6 360 3.2 290 Ethyl silicate 850 1.2 21 1.2 89 1.2 36 Ethyl silicate polymer (as ethyl silicate) 50 25.3 360 27.3 360 24.1 360 Ethylbenzene 2000 1.2 61 1.3 108 1.2 36 Hansa yellow 50 12.0 360 13.0 360 11.5 360 Heptane 3500 1.4 16 1.56 164 1.37 74 Hexamethylene diisocyanate 4 355 360 383.2 360 338.3 360 High flash naphtha 1250 1.1 5 1.23 60 1.08 36 Hydrated iron oxide 50 207.7 360 224.2 360 197.9 36 0 Hydrotreated light n a ph ha 3500 1.2 5 1.26 72 1.11 39 Iron oxide 50 17.6 360 19.0 360 16.8 360 Iron oxide (red) (as fe fume) 50 2.48 287 2.67 360 2.36 182 Iron phosphide 50 40.7 360 43.9 360 38.8 360 Isobutanol 1520 4.2 360 4.35 360 4.1 360 Isophorone diamine 100 6.7 360 7.3 360 6.4 360 Lead 1.5 15.4 360 16.6 360 14.7 360 Light aliphatic solvent naphtha 3500 1.3 7 1.4 126 1.25 72 Light hydrotreated distallate 1000 5.0 360 5.4 360 4.80 360 Medium aromatic hydrocarbons 2560 2.2 244 2.3 308 2.2 108 MEKP 15 14.8 360 16.0 360 14.1 360 Methyl ethyl ketone 3900 2.4 266 2.5 360 2.3 109 Methyl isoamyl ketone 60 20.5 360 21.2 360 20.1 360 Methyl isobutyl ketone 2050 3.2 360 3.3 360 3.1 360 Methyl n-amyl ketone 32 158.4 360 165.0 360 154.6 360 Methyl silicate 60 1.1 2 1.2 45 1.04 35 Mica 30 47.2 360 50.9 360 44.9 360 Modified aliphatic polyamine 420 1.4 10 1.5 142 1.3 74 Naphthalene 440 1.2 12 1.2 81 1.1 36 Nonyl phenol 400 1.8 90 2.0 323 1.8 110 Nonylphenol 400 2.3 244 2.5 358 2.2 181 Odorless petroleum naphtha 3500 1.2 5 1.3 79 1.13 39 Organic yellow pigment 50 12.0 360 13.0 360 11.5 360 Copyright © 2013 SciRes. JEP 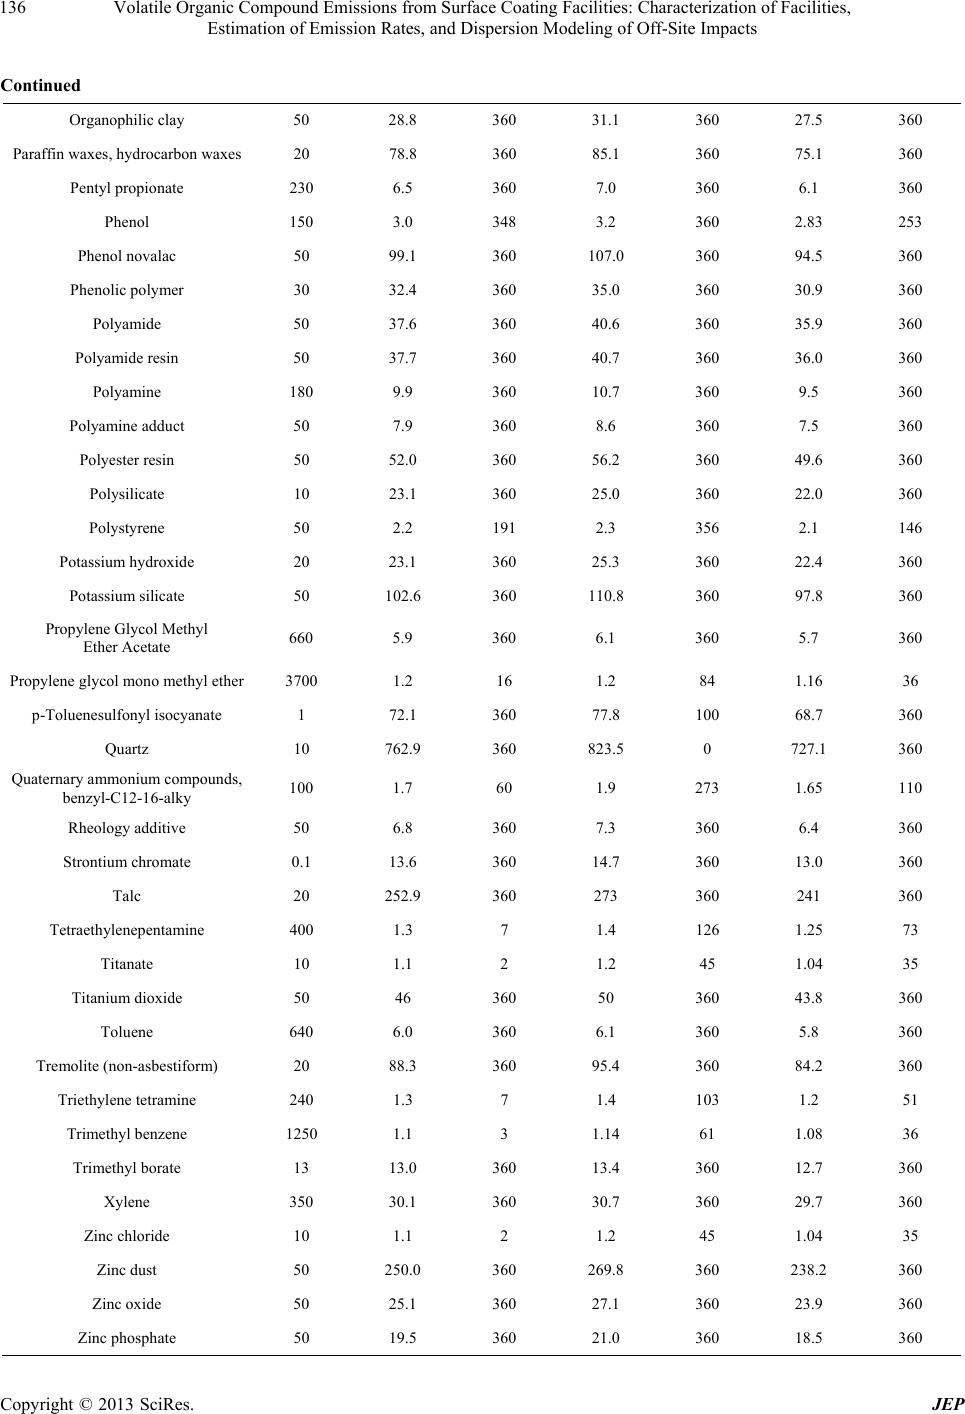 Volatile Organic Compound Emissions from Surface Coating Facilities: Characterization of Facilities, Estimation of Emission Rates, and Dispersion Modeling of Off-Site Impacts 136 Continued Organophilic clay 50 28.8 360 31.1 360 27.5 360 Paraffin waxes, hydrocarbon waxes20 78.8 360 85.1 360 75.1 360 Pentyl propionate 230 6.5 360 7.0 360 6.1 360 Phenol 150 3.0 348 3.2 360 2.83 253 Phenol novalac 50 99.1 360 107.0 360 94.5 360 Phenolic polymer 30 32.4 360 35.0 360 30.9 360 Polyamide 50 37.6 360 40.6 360 35.9 360 Polyamide resin 50 37.7 360 40.7 360 36.0 360 Polyamine 180 9.9 360 10.7 360 9.5 360 Polyamine adduct 50 7.9 360 8.6 360 7.5 360 Polyester resin 50 52.0 360 56.2 360 49.6 360 Polysilicate 10 23.1 360 25.0 360 22.0 360 Polystyrene 50 2.2 191 2.3 356 2.1 146 Potassium hydroxide 20 23.1 360 25.3 360 22.4 360 Potassium silicate 50 102.6 360 110.8 360 97.8 360 Propylene Glycol Methyl Ether Acetate 660 5.9 360 6.1 360 5.7 360 Propylene glycol mono methyl ether3700 1.2 16 1.2 84 1.16 36 p-Toluenesulfonyl isocyanate 1 72.1 360 77.8 100 68.7 360 Quartz 10 762.9 360 823.5 0 727.1 360 Quaternary ammonium compounds, benzyl-C12-16-alky 100 1.7 60 1.9 273 1.65 110 Rheology additive 50 6.8 360 7.3 360 6.4 360 Strontium chromate 0.1 13.6 360 14.7 360 13.0 360 Talc 20 252.9 360 273 360 241 360 Tetraethylenepentamine 400 1.3 7 1.4 126 1.25 73 Titanate 10 1.1 2 1.2 45 1.04 35 Titanium dioxide 50 46 360 50 360 43.8 360 Toluene 640 6.0 360 6.1 360 5.8 360 Tremolite (non-asbestiform) 20 88.3 360 95.4 360 84.2 360 Triethylene tetramine 240 1.3 7 1.4 103 1.2 51 Trimethyl benzene 1250 1.1 3 1.14 61 1.08 36 Trimethyl borate 13 13.0 360 13.4 360 12.7 360 Xylene 350 30.1 360 30.7 360 29.7 360 Zinc chloride 10 1.1 2 1.2 45 1.04 35 Zinc dust 50 250.0 360 269.8 360 238.2 360 Zinc oxide 50 25.1 360 27.1 360 23.9 360 Zinc phosphate 50 19.5 360 21.0 360 18.5 360 Copyright © 2013 SciRes. JEP 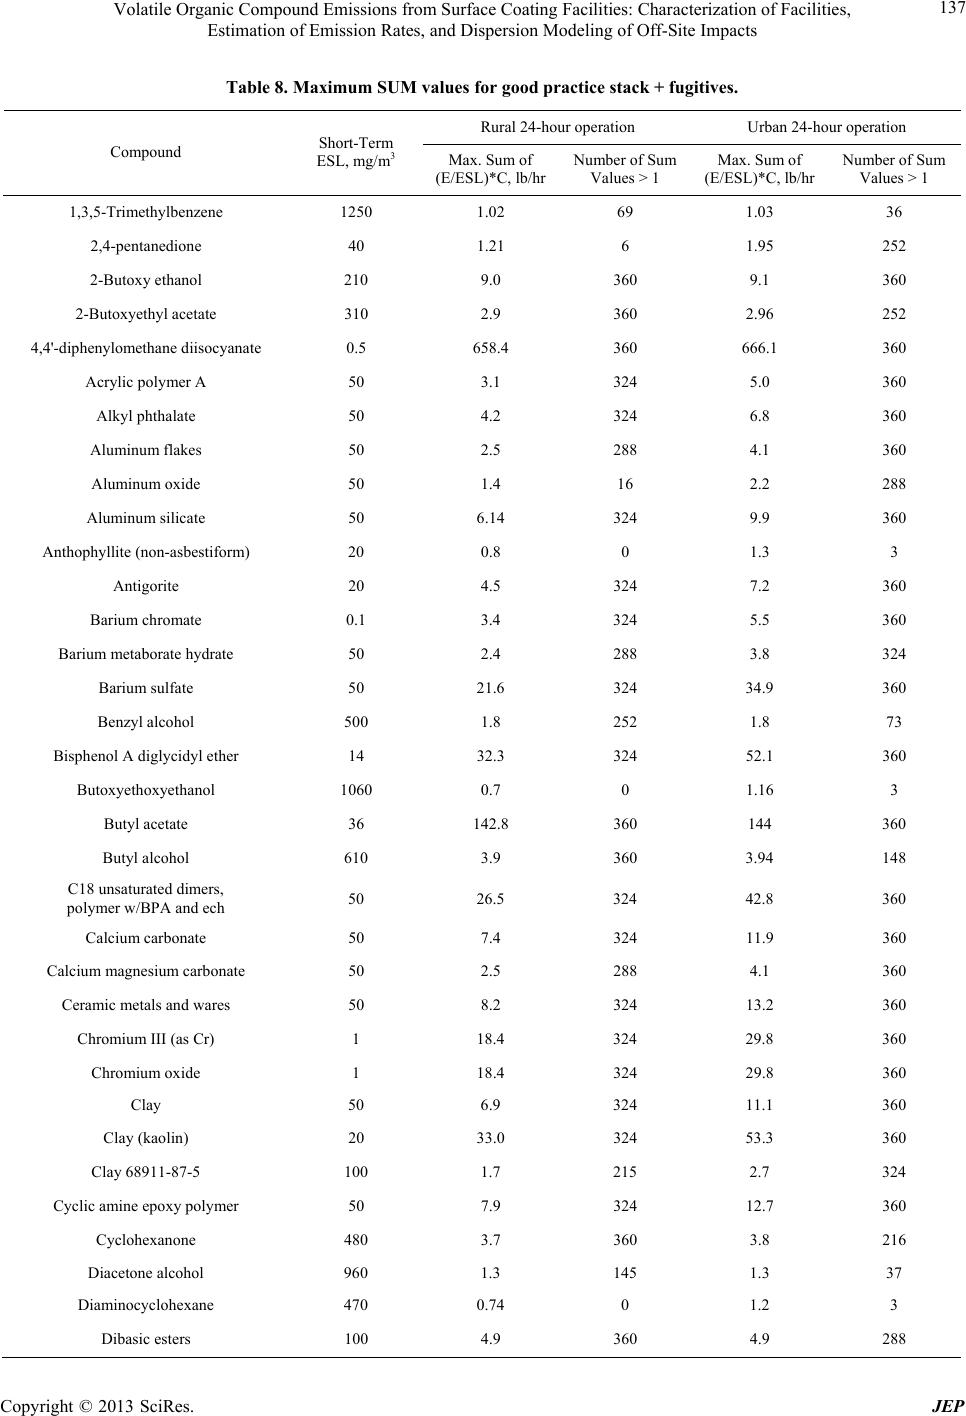 Volatile Organic Compound Emissions from Surface Coating Facilities: Characterization of Facilities, Estimation of Emission Rates, and Dispersion Modeling of Off-Site Impacts 137 Table 8. Maximum SUM values for good practice stack + fugitives. Rural 24-hour o p e ration Urban 24-hour operation Compound Short-Term ESL, mg/m3 Max. Sum of (E/ESL)*C, lb/hrNumber of Sum Values > 1 Max. Sum of (E/ESL)*C, lb/hr Number of Sum Values > 1 1,3,5-Trimethylbenzene 1250 1.02 69 1.03 36 2,4-pentanedione 40 1.21 6 1.95 252 2-Butoxy ethanol 210 9.0 360 9.1 360 2-Butoxyethyl acetate 310 2.9 360 2.96 252 4,4'-diphenylomethane diisocyanate 0.5 658.4 360 666.1 360 Acrylic polymer A 50 3.1 324 5.0 360 Alkyl phthalate 50 4.2 324 6.8 360 Aluminum flakes 50 2.5 288 4.1 360 Aluminum oxide 50 1.4 16 2.2 288 Aluminum silicate 50 6.14 324 9.9 360 Anthophyllite (non-asbestiform) 20 0.8 0 1.3 3 Antigorite 20 4.5 324 7.2 360 Barium chromate 0.1 3.4 324 5.5 360 Barium metaborate hydrate 50 2.4 288 3.8 324 Barium sulfate 50 21.6 324 34.9 360 Benzyl alcohol 500 1.8 252 1.8 73 Bisphenol A diglycidyl ether 14 32.3 324 52.1 360 Butoxyethoxyethanol 1060 0.7 0 1.16 3 Butyl acetate 36 142.8 360 144 360 Butyl alcohol 610 3.9 360 3.94 148 C18 unsaturated dimers, polymer w/BPA and ech 50 26.5 324 42.8 360 Calcium carbonate 50 7.4 324 1 1 .9 360 Calcium magnesium carbonate 50 2.5 288 4.1 360 Ceramic metals and wares 50 8.2 324 13.2 360 Chromium III (as Cr) 1 18.4 324 29.8 360 Chromium oxide 1 18.4 324 29.8 360 Clay 50 6.9 324 11.1 360 Clay (kaolin) 20 33.0 324 53.3 360 Clay 68911-87-5 100 1.7 215 2.7 324 Cyclic amine epoxy polymer 50 7.9 324 12.7 360 Cyclohexanone 480 3.7 360 3.8 216 Diacetone alcohol 960 1.3 145 1.3 37 Diaminocyclohexane 470 0.74 0 1.2 3 Dibasic esters 100 4.9 360 4.9 288 Copyright © 2013 SciRes. JEP 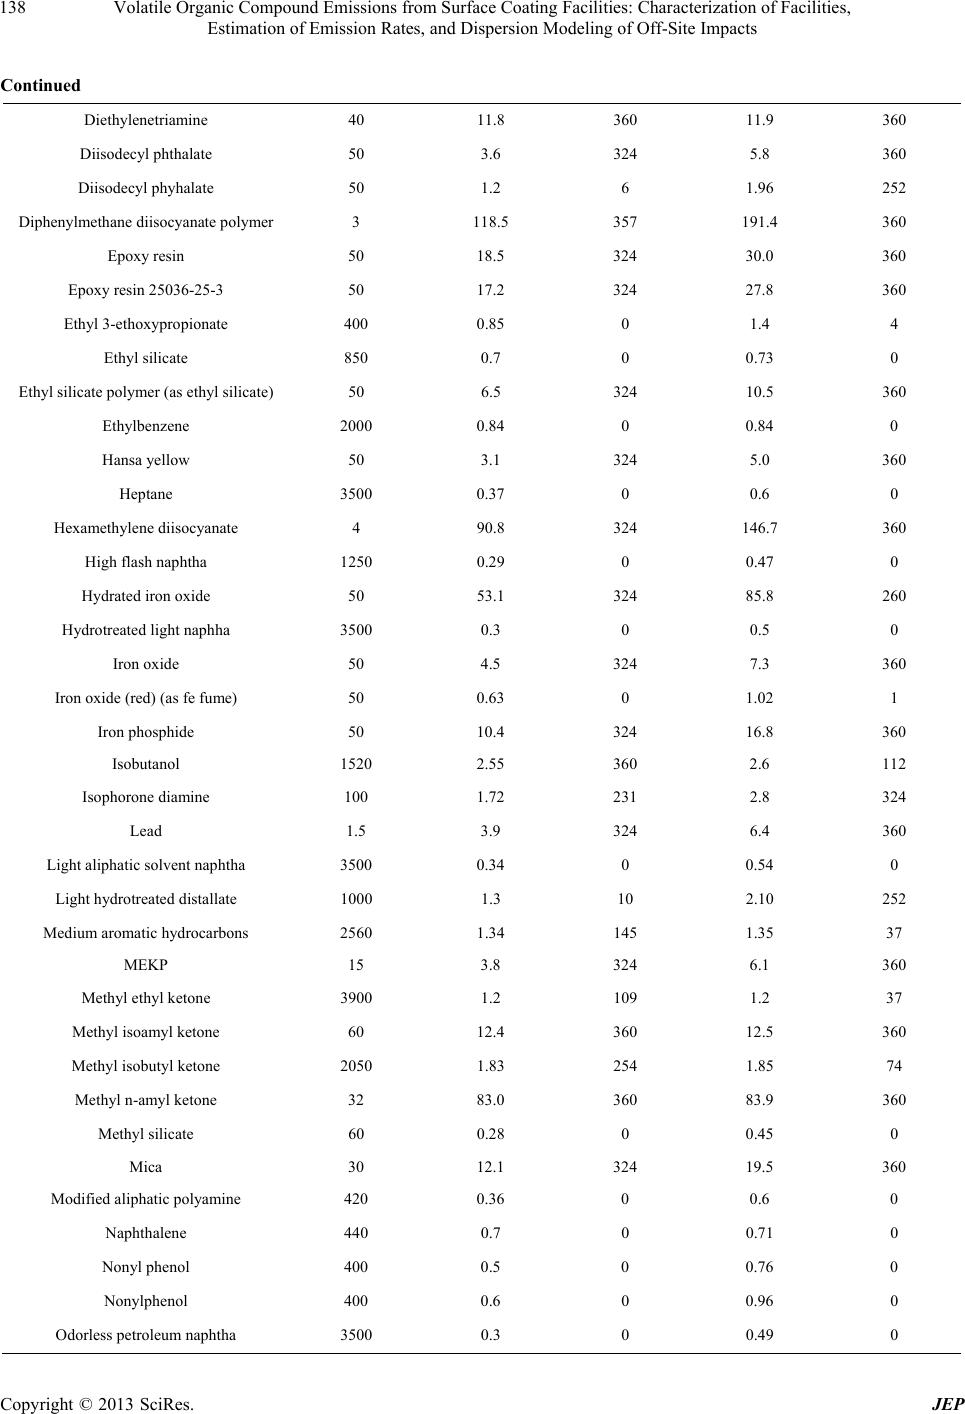 Volatile Organic Compound Emissions from Surface Coating Facilities: Characterization of Facilities, Estimation of Emission Rates, and Dispersion Modeling of Off-Site Impacts 138 Continued Diethylenetriamine 40 11.8 360 11.9 360 Diisodecyl phthalate 50 3.6 324 5.8 360 Diisodecyl phyhal ate 50 1.2 6 1.96 252 Diphenylmethane diisocyanate polymer 3 118.5 357 191.4 360 Epoxy resin 50 18.5 324 30.0 360 Epoxy resin 25036 -25-3 50 17.2 324 27.8 360 Ethyl 3-ethoxypropionate 400 0.85 0 1.4 4 Ethyl silicate 850 0.7 0 0.73 0 Ethyl silicate polymer (as ethyl silicate) 50 6.5 324 10.5 360 Ethylbenzene 2000 0.84 0 0.84 0 Hansa yellow 50 3.1 324 5.0 360 Heptane 3500 0.37 0 0.6 0 Hexamethylene d i i s o c yanate 4 90.8 324 146.7 360 High flash naphtha 1250 0.29 0 0.47 0 Hydrated iron oxide 50 53.1 324 85.8 260 Hydrotreated light naphha 3500 0.3 0 0.5 0 Iron oxide 50 4.5 324 7.3 360 Iron oxide (re d) (as fe fume) 50 0.63 0 1.02 1 Iron phosphide 50 10.4 324 16.8 360 Isobutanol 1520 2.55 360 2.6 112 Isophorone diamine 100 1.72 231 2.8 324 Lead 1.5 3.9 324 6.4 360 Light aliphatic solvent naphtha 3500 0.34 0 0.54 0 Light hydrotreated distallate 1000 1.3 10 2.10 252 Medium aromat ic hy drocarbons 2560 1.34 145 1.35 37 MEKP 15 3.8 324 6.1 360 Methyl ethyl ketone 3900 1.2 109 1.2 37 Methyl isoamyl ketone 60 12.4 360 12.5 360 Methyl isobutyl ketone 2050 1.83 254 1.85 74 Methyl n-amyl ketone 32 83.0 360 83.9 360 Methyl silicate 60 0.28 0 0.45 0 Mica 30 12.1 324 19.5 360 Modified aliphatic polyamine 420 0.36 0 0.6 0 Naphthalene 440 0.7 0 0.71 0 Nonyl phenol 400 0.5 0 0.76 0 Nonylphenol 400 0.6 0 0.96 0 Odorless petroleum naphtha 3500 0.3 0 0.49 0 Copyright © 2013 SciRes. JEP 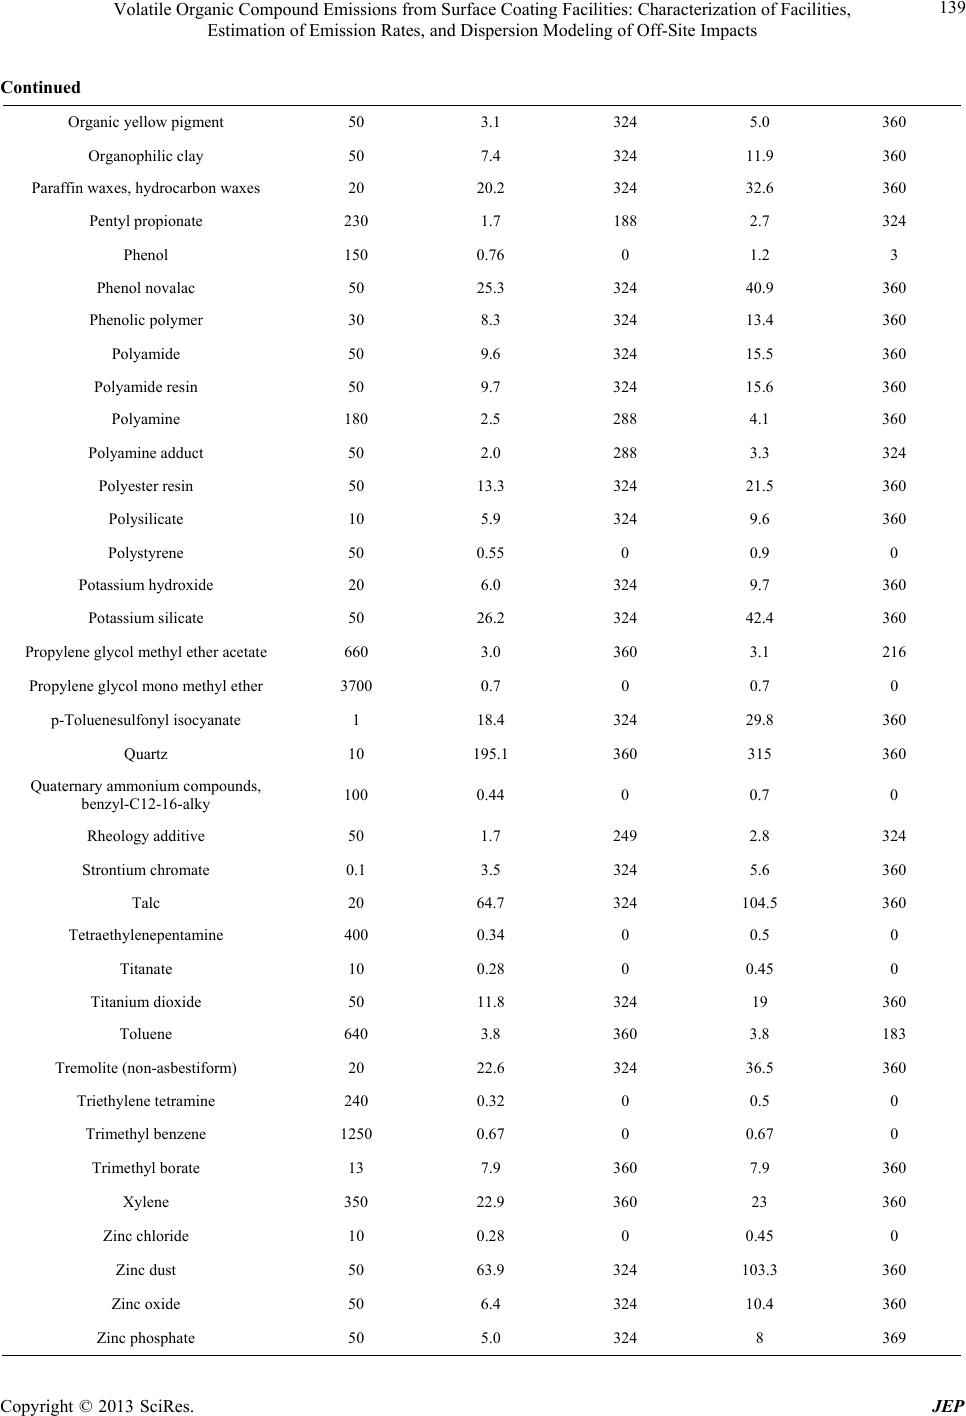 Volatile Organic Compound Emissions from Surface Coating Facilities: Characterization of Facilities, Estimation of Emission Rates, and Dispersion Modeling of Off-Site Impacts 139 Continued Organic yellow pigment 50 3.1 324 5.0 360 Organophilic clay 50 7.4 324 11.9 360 Paraffin waxes, hydrocarbon waxes 20 20.2 324 32.6 360 Pentyl propionate 230 1.7 188 2.7 324 Phenol 150 0.76 0 1.2 3 Phenol novalac 50 25.3 324 40.9 360 Phenolic polymer 30 8.3 324 13.4 360 Polyamide 50 9.6 324 15.5 360 Polyamide resin 50 9.7 324 15.6 360 Polyamine 180 2.5 288 4.1 360 Polyamine adduct 50 2.0 288 3.3 324 Polyester resin 50 13.3 324 21.5 360 Polysilicate 10 5.9 324 9.6 360 Polystyrene 50 0.55 0 0.9 0 Potassium hydroxide 20 6.0 324 9.7 360 Potassium silicate 50 26.2 324 42.4 360 Propylene glycol methyl ether acetate 660 3.0 360 3.1 216 Propylene glycol mono methyl ether 3700 0.7 0 0.7 0 p-Toluenesulfonyl isocyanate 1 18.4 324 29.8 360 Quartz 10 195.1 360 315 360 Quaternary ammonium compounds, benzyl-C12-16-alky 100 0.44 0 0.7 0 Rheology additive 50 1.7 249 2.8 324 Strontium chromate 0.1 3.5 324 5.6 360 Talc 20 64.7 324 104.5 360 Tetraethylenepentamine 400 0.34 0 0.5 0 Titanate 10 0.28 0 0.45 0 Titanium dioxide 50 11.8 324 19 360 Toluene 640 3.8 360 3.8 183 Tremolite (non-asbestiform) 20 22.6 324 36.5 360 Triethylene tetramine 240 0.32 0 0.5 0 Trimethyl benzene 1250 0.67 0 0.67 0 Trimethyl borate 13 7.9 360 7.9 360 Xylene 350 22.9 360 23 360 Zinc chloride 10 0.28 0 0.45 0 Zinc dust 50 63.9 324 103.3 360 Zinc oxide 50 6.4 324 10.4 360 Zinc phosphate 50 5.0 324 8 369 Copyright © 2013 SciRes. JEP  Volatile Organic Compound Emissions from Surface Coating Facilities: Characterization of Facilities, Estimation of Emission Rates, and Dispersion Modeling of Off-Site Impacts Copyright © 2013 SciRes. JEP 140 were included in the SUM, to correspond to the 1-hour averaging time of the short-term ESLs. Although TCEQ also provides long-term (annual) effect screening levels, short-term ESLs generally result in more stringent permit limits than long-term ESLs. Thus, only short-term ESLs were con sid ered . Co ncen tra tion s wer e ca lculated for both urban and rural dispersion parameters, because depend- ing on the receptor location, either could be higher for the stack configurations. SUMS were calculated for all 360 receptor locations. If SUM < 1 is for a given species for all receptor loca- tions, that pollutant would not warrant in-depth health review. For those pollutants where SUM > 1, further analysis may be required through po llutant specific mod- eling analyses. Table 7 lists maximum SUM values for the 108 (out of 181) pollutants with SUM > 1 for the worst-case stack + fugitives for the 24-hour operation scenario for rural and urban dispersion parameters, as well as the 8-hour operation scenario for rural dispersion parameters is also presented for comparison. Table 8 lists the maximum SUM values for the good-practice stack + fugitives. As seen in Tables 7 and 8, the worst-case stack + fugitives 24-hour operation scenario with rural dispersion parame- ters gave the highest concentratio ns. Th is was anticipated because worst-case stack gave higher concentrations than the good-practice stack, the 24-hour operation scenario gave higher concentrations than the 8-hour operation scenario for the worst-case stack, and the rural dispersion parameters gave higher fugitive con c entrations. The pollutan ts listed in Tables 7 and 8 warrant a more in-depth health impacts evaluation. 4. Summary A database was developed using 286 TCEQ permit files authorizing surface coating facilities in Texas during 2006 and 2007. The database includes information im- portant for estimating emission rates, and for using as dispersion model inpu ts. Hourly and annual emissions of volatile organic com- pounds (VOCs), particulate matter (PM), and exempt solvents (ES) were calculated for each permitted entity/ company in the database, according to equations given by TCEQ. Dispersion modeling was then conducted for 3 facility configurations (worst-case stack height, good practice stack height, and fugitive emissions), for urban and rural dispersion parameters, for 8-hour and 24-hour operating scenarios, and for 1-hour, 24-hour, and annual averaging times, for a total of 36 scenarios. The highest modeled concentrations were for the worst-case stack height, rural dispersion parameters, 24-hour operation scenario, and 1-hour averaging time. 108 specific chemi- cal species, which are components of surface coatings, were identified as candidates for further health impacts review. 5. Acknowledgements We would like to acknowledge the Texas Commission on Environmental Quality for providing funding for this project. The paper does not, however, necessarily repre- sent the opinions or position s of TCEQ. REFERENCES [1] US Environmental Protection Agency (EPA), “Vol. I, Chapter 4, Evaporation Loss Sources, Section 4.2.2.1, General Industrial Surface Coating,” In: US Environ- mental Protection Agency (EPA) AP-42, 5th Edition, 1981. http://www.epa.gov/ttn/chief/ap42/ch04/final/c4s02_2a.p df [2] A. Kumar and T. Shenoy, “Surface Coatings,” In: W. T. Davis, Ed., Air Pollution Engineering Manual, John Wiley & Sons, Inc., New York, 2000, pp. 321-332. [3] R. Mukund, T. J. Kelly and C. W. Spicer, “Source Attri- bution of Ambient Air Toxic and Other VOCs in Colum- bus, Ohio,” Atmospheric Environment, Vol. 30, No. 20, 1996, pp. 3457-3470. doi:10.1016/1352-2310(95)00487-4 [4] J. H. Lawrimore and V. P. Aneja, “Chemical Mass Bal- ance Analyses of Nonmethane Hydrocarbon Emissions in North Carolina,” Chemosphere, Vol. 35, No. 11, 1997, pp. 2751-2765. doi:10.1016/S0045-6535(97)00321-4 [5] M. Placet, C. O. Mann, R. O. Golbert and M. J. Niefer, “Emissions of Ozone Precursors from Stationary Source: A Critical Review,” Atmospheric Environment, Vol. 34, No. 12-14, 2000, pp. 2183-2204. doi:10.1016/S1352-2310(99)00464-1 [6] S. Pierucci, R. Del Rosso, D. Bombardi, A. Concu and G. Lugli, “An Innovative Sustainable Process for VOCs Re- covery from Spray Paint Booths,” Energy, Vol. 30, No. 8, 2005, pp. 1377-1386. doi:10.1016/j.energy.2004.02.017 [7] US Environmental Protection Agency (EPA), “Vol. I, Chapter 4, Evaporation Loss Sources, Section 4.2.1, Nonindustrial Surface Coating,” In: US Environmental Protection A g e ncy (EPA) AP-42, 5th Edition, 1991. http://www.epa.gov/ttn/chief/ap42/ch04/final/c4s02_1.pdf [8] Y. J. Choi, R. V. Calabrese, S. H. Ehrman, R. R. Di- ckerson and J. W. Stehr, “A Combined Approach for the Evaluation of a Volatile Organic Compound Emissions Inventory,” Journal of the Air & Waste Management As- sociation, Vol. 56, No. 2, 2006, pp. 169-178. doi:10.1080/10473289.2006.10464446 [9] K. Mannschreck, D. Klemp, D. Kley, R. Friedrich, J. Huhlwein, B. Wickert, P. Matuska, M. Habram and F. Slemr, “Evaluation of an Emission Inventory by Com- parisons of Modeled and Measured Emission Ratios of Individual HCS, CO and NOx,” Atmospheric Environ- ment, Vol. 36, Suppl. 1, 2002, pp. 581-594.  Volatile Organic Compound Emissions from Surface Coating Facilities: Characterization of Facilities, Estimation of Emission Rates, and Dispersion Modeling of Off-Site Impacts 141 doi:10.1016/S1352-2310(02)00211-X [10] J. G. Watson, J. C. Chow and E. M. Fujita, “Review of Volatile Organic Compound Source Apportionment by Chemical Mass Balance,” Atmospheric Environment, Vol. 36, No. 9, 2001, pp. 1567-1584. doi:10.1016/S1352-2310(00)00461-1 [11] A. Srivastava and D. Majumdar, “Emission Inventory of Evaporative Emissions of VOCs in Four Metro Cities in India,” Environmental Monitoring Assessment, Vol. 160, No. 1-4, 2010, pp. 315-322. doi:10.1007/s10661-008-0697-4 [12] P. M. Randall, “Pollution Prevention Methods in the Sur- face Coating Industry,” Journal of Hazardous Materials, Vol. 29, No. 2, 1992, pp. 275-295. doi:10.1016/0304-3894(92)85073-A [13] C. M. Smith and W. E. Brown, “Elimination of VOC Emissions from Surface Coating Operations,” Journal of the Air & Waste Management Association, Vol. 43, No. 7, 1993, pp. 1015-1019. [14] C. H. Darvin, D. Proffitt and J. Ayer, “Paint Spray Booth Design Using Recirculation/Partitioning Ventilation,” En- vironmental Progress, Vol. 17, No. 3, 1998, pp. 199-202. doi:10.1002/ep.670170320 [15] M. J. McFarland, G. R. Palmer, S. Peters, A. C. Olivas and T. M. Nelson, “Maintaining High-Volume, Low- Pressure Surface-Coating Regulatory Compliance Using the U.S. Environmental Protection Agency’s Data Quality Objectives Process,” Journal of the Air & Waste Man- agement Association, Vol. 55, No. 3, 2005, pp. 365-372. doi:10.1080/10473289.2005.10465924 [16] M. J. McFarland, T. M. Nelson and G. R. Palmer, “De- velopment of a Hazardous Air Pollutants Monitoring Pro- gram Using the Data Quality Objectives Process,” Jour- nal of the Air & Waste Management Association, Vol. 54, No. 5, 2004, pp. 614-622. doi:10.1080/10473289.2004.10470932 [17] F. J. Álvarez-Hornos, C. Lafita, V. Martínez-Soria, J. M. Penya-Roja, M. C. Pérez and C. Gabaldón, “Evaluation of a Pilot-Scale Biotrickling Filter as a VOC Control Tech- nology for the Plastic Coating Sector,” Biochemical En- gineering Journal, Vol. 58-59, 2011, pp. 154-161. [18] R. A. Wadden, P. A. Scheff, J. E. Franke, L. M. Conroy, M. Javor, C. B. Keil and S. A. Milz, “VOC Emission Rates and Emission Factors for a Sheetfed Offset Printing Shop,” American Industrial Hygiene Association Journal, Vol. 56, No. 4, 1995, pp. 368-376. doi:10.1080/15428119591016999 [19] J. E. McCarthy and D. W. Senser, “Numerical Model of Paint Transfer and Deposition in Electrostatic Air Sprays,” Atomization and Sprays, Vol. 16, No. 2, 2006, pp. 195- 222. doi:10.1615/AtomizSpr.v16.i2.40 [20] M. Coldiron and E. Mack, “Painting Basics and Emission Calculations for TCEQ Air Quality Permit Applications,” 2006. Copyright © 2013 SciRes. JEP
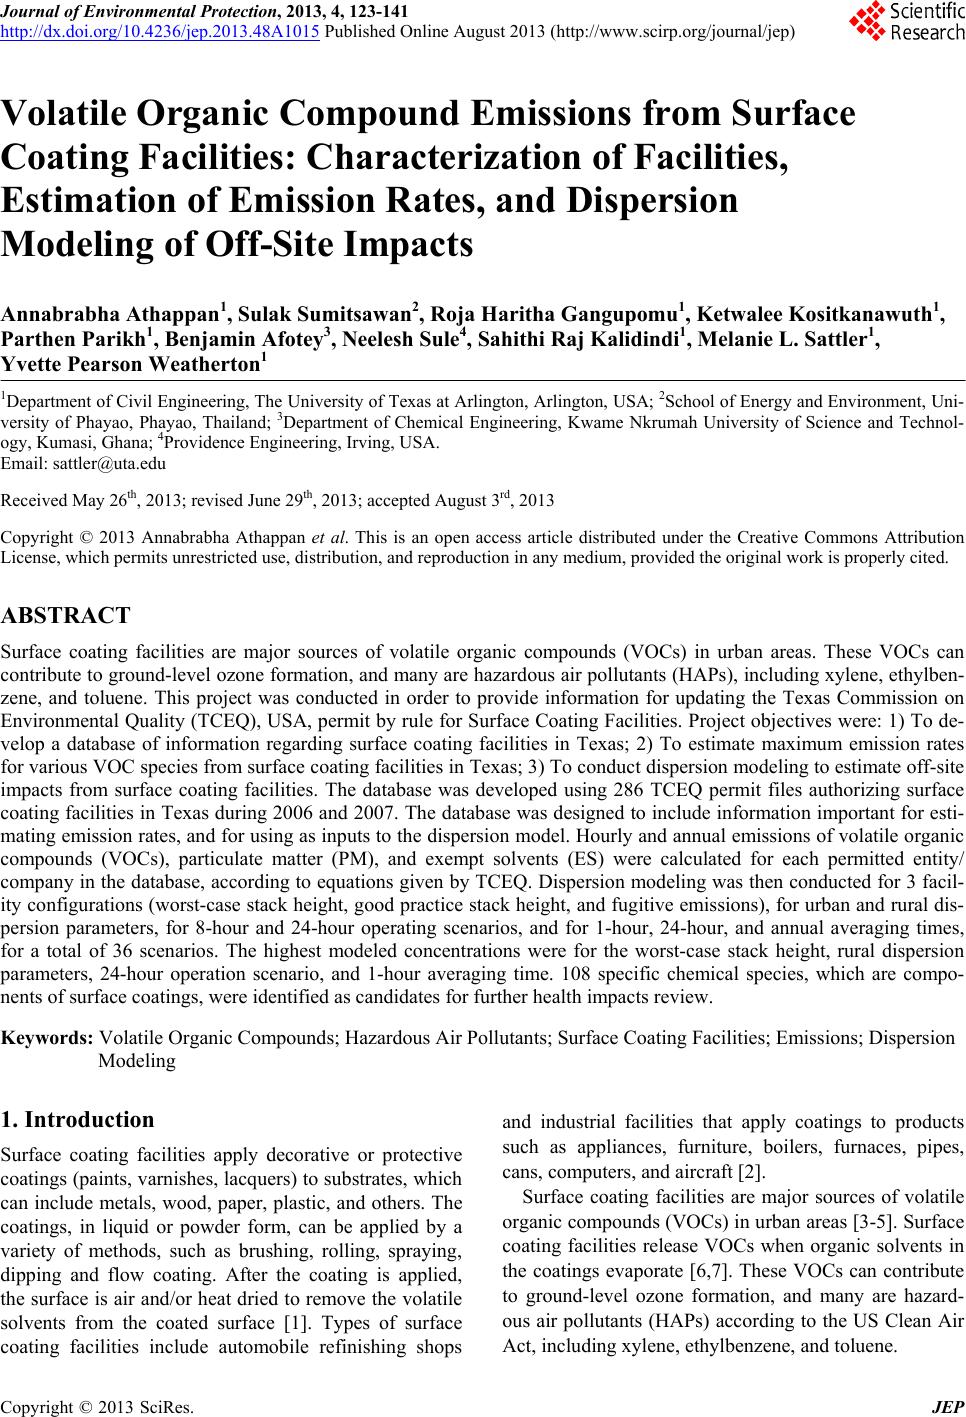
|