Paper Menu >>
Journal Menu >>
 Modern Economy, 2013, 4, 520-534 http://dx.doi.org/10.4236/me.2013.48056 Published Online August 2013 (http://www.scirp.org/journal/me) Revenue Sharing in Mining: Insights from the Philippine Case* Ronald U. Mendoza, Tristan A. Canare Policy Center, Asian Institute of Management, Makati City, Philippines Email: rumendoza@aim.edu, tcanare@aim.edu Received May 15, 2013; revised June 15, 2013; accepted July 15, 2013 Copyright © 2013 Ronald U. Mendoza, Tristan A. Canare. This is an open access article distributed under the Creative Commons Attribution License, which permits unrestricted use, distribution, and reproduction in any medium, provided the original work is properly cited. ABSTRACT Most mining operations in developing countries are defacto public-private partnerships, as the state typically owns the resources and partner s with a company or con sortium in extr action. Revenue sharing is a critically important element of such partnerships, and it is the starting point for any meaningful analysis of over-all costs and benefits from mining. As a contribution to the policy discussions on th is topic, this paper tries to clarify issues in properly evaluating public sec- tor revenues from mining, using data on the Philippines as a case. The main obj ective here is to illustrate the main dif- ferences between macro-level and micro (firm-) level data, and explain why such differences exist. We find evidence that macro-level revenue sharing indicators in the Philippines fail to capture a high degree of heterogeneity in micro- (firm-) level revenue sharing outcomes. For instance, using a sample of large-scale metallic mines, we find that this group’s payment to the government (as a share of revenue) is much higher than the industry average and is roughly comparable to some foreign comparator firms. Clarifying and explaining these discrepancies could help determine broader net benefits from extractive industries, and thus establish whether and to what extent mining operations provide enough net gains to the country. Our analysis suggests that industry-level analysis of mining revenue sharing is inade- quate in determinin g fairness and comparability to internatio nal standard s. More complete simulation of tax revenues is necessary in accurately analyzing revenue sharing and in designing revenue-sharing policies. Keywords: Mining; Revenue Sharing; Royalty; Natural Resources 1. Introduction In most cases, mining operations are defacto public- pri- vate partnerships because the state usually owns the minerals while the company does the extraction. Reve- nue sharing is thus a critical component of this partner- ship and is the starting point of cost-benefit analysis for mining. Like other mining countries, the Philippines lev- ies taxes, royalties and other fees to mining firms operat- ing within its borders. Using macro-level and firm-level data, we did a first pass analysis of mining revenue shar- ing regime in the Philippines. Government data show that, on the average over the last four years, roughly 10% of revenues from the entire mining industry were paid to the government. This figure, however, should be interpreted with caution as there is much heterogeneity in the cost and revenue structure across different types of mines. For instance, using a sample of two large-scale metallic mines with publicly- available financial statements, we found that this grou p’s payment to the government (as a share of revenue) is much higher than the industry average and is roughly comparable to some foreign comparator firms. This im- plies that tax payments (as a share of revenue) are widely different across firms. Although there are miners that pay taxes (as a share of revenue) that are similar to interna- tional comparators, some firms must be pulling down the figures to the current industry average. There ar e several rea sons for wide discrepancies in tax payment across firms. These firms operate in different contexts and on different minerals. Mines are also at va- rying stages in their life cycle. Mining companies also differ in their economic scope (i.e. large scale versus small scale), with possible implications on their techno- *This paper was presented at the 2012 Philippine Economic Society Annual Meeting—Session on “How Should the Philippines Reform Its Mining Tax Law?” The authors also benefited from comments during a p resentation at the Asian Institute of Manage m ent (AIM) Policy Center. Any remaining errors of commission or omission in this article are the responsibility of the authors. The views and analysis expressed herein do not necessarily reflect the policies of the Asian Institute of Manage- ment. C opyright © 2013 SciRes. ME 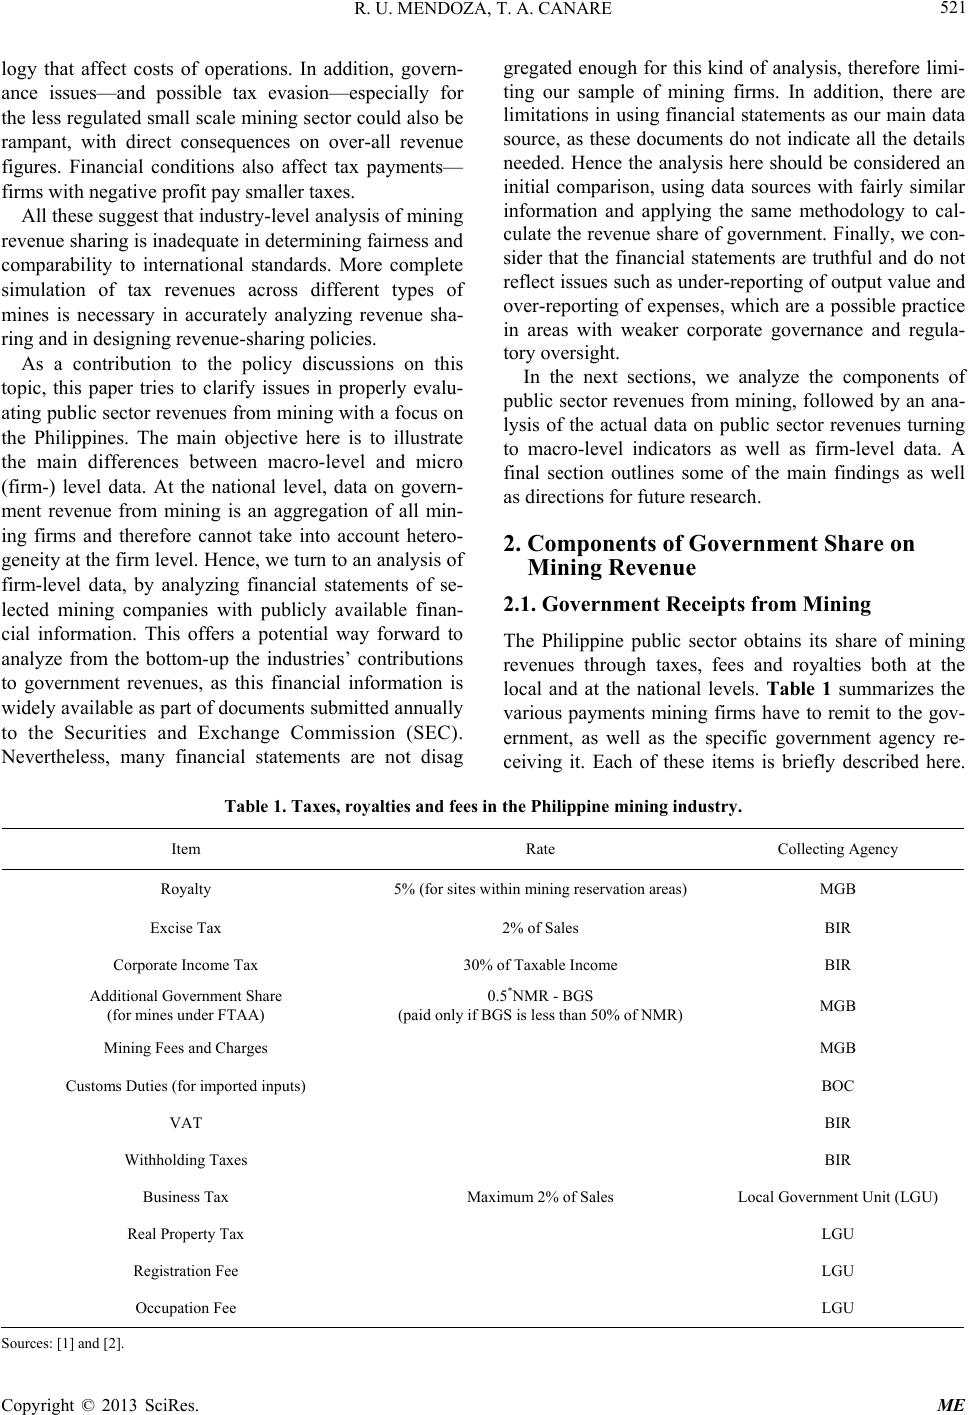 R. U. MENDOZA, T. A. CANARE 521 logy that affect costs of operations. In addition, govern- ance issues—and possible tax evasion—especially for the less regulated small scale mining sector could also be rampant, with direct consequences on over-all revenue figures. Financial conditions also affect tax payments— firms with negative profit pay smaller taxes. All these suggest that industry -level analysis of mining revenue sharing is inadequa te in determining fairne ss and comparability to international standards. More complete simulation of tax revenues across different types of mines is necessary in accurately analyzing revenue sha- ring and in designing revenue-sharing policies. As a contribution to the policy discussions on this topic, this paper tries to clarify issues in properly evalu- ating public sector revenues from mining with a focus on the Philippines. The main objective here is to illustrate the main differences between macro-level and micro (firm-) level data. At the national level, data on govern- ment revenue from mining is an aggregation of all min- ing firms and therefore cannot take into account hetero- geneity at the firm level. Hence, we turn to an analysis of firm-level data, by analyzing financial statements of se- lected mining companies with publicly available finan- cial information. This offers a potential way forward to analyze from the bottom-up the industries’ contributions to government revenues, as this financial information is widely available as part of documents submitted annually to the Securities and Exchange Commission (SEC). Nevertheless, many financial statements are not disag gregated enough for this kind of analysis, therefore limi- ting our sample of mining firms. In addition, there are limitations in using finan cial statements as our main data source, as these documents do not indicate all the details needed . Hence the ana lysis here should b e conside red an initial comparison, using data sources with fairly similar information and applying the same methodology to cal- culate the revenue share of government. Finally, we con- sider that the financial statements are truthful and do not reflect issues such as under-reporting of output value and over-reporting of expenses, which are a possible practice in areas with weaker corporate governance and regula- tory oversig ht . In the next sections, we analyze the components of public sector revenues from mining, followed by an ana- lysis of the actual data on public sector revenues turning to macro-level indicators as well as firm-level data. A final section outlines some of the main findings as well as directions for future research. 2. Components of Government Share on Mining Revenue 2.1. Government Receipts from Mining The Philippine public sector obtains its share of mining revenues through taxes, fees and royalties both at the local and at the national levels. Table 1 summarizes the various payments mining firms have to remit to the gov- ernment, as well as the specific government agency re- ceiving it. Each of these items is briefly described here. Table 1. Taxes, royalties and fees in the Philippine mining industry. Item Rate Collecting Agency Royalty 5% (for sites within mining reservation ar eas) MGB Excise Tax 2% of Sales BIR Corporate Income Tax 30% of Taxable Income BIR Additional Government Share (for mines under FTAA) 0.5*NMR - BGS (paid only if BGS is less than 50% of NMR) MGB Mining Fees and Charges MGB Customs Duties (for impor ted inputs) BOC VAT BIR Withholding Taxes BIR Business Tax Maximum 2% of Sales Local Government Unit (LGU) Real Property Tax LGU Registration Fee LGU Occupation Fee LGU S ources: [1] and [2]. Copyright © 2013 SciRes. ME 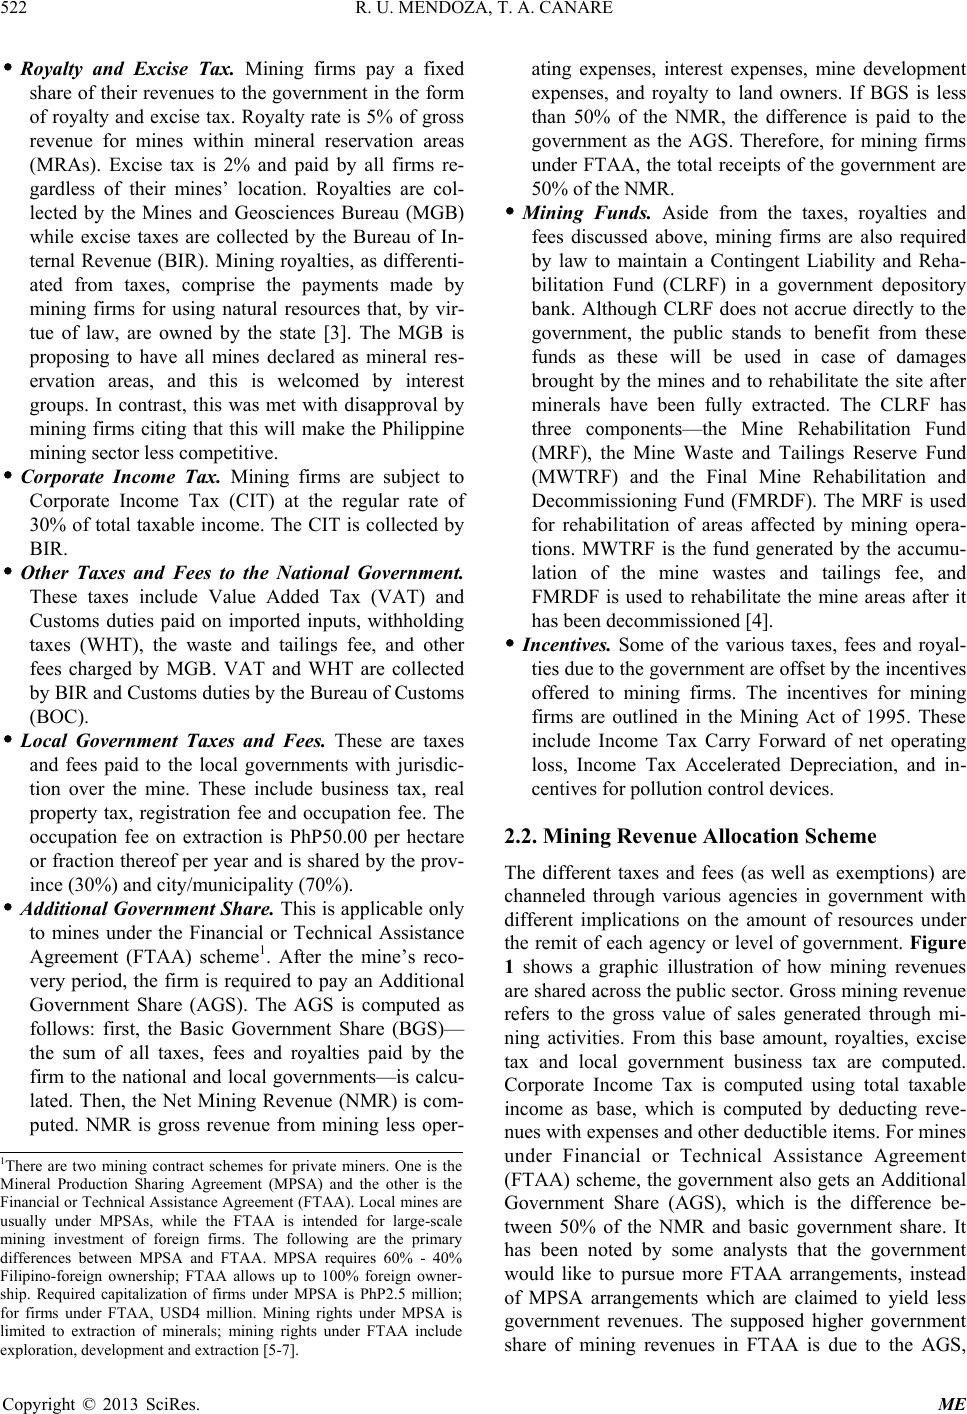 R. U. MENDOZA, T. A. CANARE 522 Royalty and Excise Tax. Mining firms pay a fixed share of their revenues to the government in the form of royalty and excise tax. Royalty rate is 5% of gross revenue for mines within mineral reservation areas (MRAs). Excise tax is 2% and paid by all firms re- gardless of their mines’ location. Royalties are col- lected by the Mines and Geosciences Bureau (MGB) while excise taxes are collected by the Bureau of In- ternal Revenue (BIR). Mining royalties, as differenti- ated from taxes, comprise the payments made by mining firms for using natural resources that, by vir- tue of law, are owned by the state [3]. The MGB is proposing to have all mines declared as mineral res- ervation areas, and this is welcomed by interest groups. In contrast, this was met with disapproval by mining firms citing that this will make the Philippine mining sector less competitive. Corporate Income Tax. Mining firms are subject to Corporate Income Tax (CIT) at the regular rate of 30% of total taxable income. The CIT is collected by BIR. Other Taxes and Fees to the National Government. These taxes include Value Added Tax (VAT) and Customs duties paid on imported inputs, withholding taxes (WHT), the waste and tailings fee, and other fees charged by MGB. VAT and WHT are collected by BIR and Customs duties by the Bureau of Customs (BOC). Local Government Taxes and Fees. These are taxes and fees paid to the local governments with jurisdic- tion over the mine. These include business tax, real property tax, registration fee and occupation fee. The occupation fee on extraction is PhP50.00 per hectare or fraction thereof per year and is shared by the prov- ince (30%) and city/municipality (7 0%). Additional Government Share. This is app licable only to mines under the Financial or Technical Assistance Agreement (FTAA) scheme1. After the mine’s reco- very period, the firm is required to pay an Additional Government Share (AGS). The AGS is computed as follows: first, the Basic Government Share (BGS)— the sum of all taxes, fees and royalties paid by the firm to the national and local governments—is calcu- lated. Then, the Net Mining Revenue (NMR) is com- puted. NMR is gross revenue from mining less oper- ating expenses, interest expenses, mine development expenses, and royalty to land owners. If BGS is less than 50% of the NMR, the difference is paid to the government as the AGS. Therefore, for mining firms under FTAA, the total receipts of the government are 50% of the NMR. Mining Funds. Aside from the taxes, royalties and fees discussed above, mining firms are also required by law to maintain a Contingent Liability and Reha- bilitation Fund (CLRF) in a government depository bank. Although CLRF does not accrue directly to the government, the public stands to benefit from these funds as these will be used in case of damages brought by the mines and to rehabilitate the site after minerals have been fully extracted. The CLRF has three components—the Mine Rehabilitation Fund (MRF), the Mine Waste and Tailings Reserve Fund (MWTRF) and the Final Mine Rehabilitation and Decommissioning Fund (FMRDF). The MRF is used for rehabilitation of areas affected by mining opera- tions. MWTRF is the fund generated by the accumu- lation of the mine wastes and tailings fee, and FMRDF is used to rehabilitate the mine areas after it has been decomm i ssi oned [4 ]. Incentives. Some of the various taxes, fees and royal- ties due to the government are offset by the incentives offered to mining firms. The incentives for mining firms are outlined in the Mining Act of 1995. These include Income Tax Carry Forward of net operating loss, Income Tax Accelerated Depreciation, and in- centives for pollution control devices. 2.2. Mining Revenue Allocation Scheme The different taxes and fees (as well as exemptions) are channeled through various agencies in government with different implications on the amount of resources under the remit of each agency or level of government. Figure 1 shows a graphic illustration of how mining revenues are shared across the public sector. Gross mining revenue refers to the gross value of sales generated through mi- ning activities. From this base amount, royalties, excise tax and local government business tax are computed. Corporate Income Tax is computed using total taxable income as base, which is computed by deducting reve- nues with expenses and other deductible items. For mines under Financial or Technical Assistance Agreement (FTAA) scheme, the government also gets an Additional Government Share (AGS), which is the difference be- tween 50% of the NMR and basic government share. It has been noted by some analysts that the government would like to pursue more FTAA arrangements, instead of MPSA arrangements which are claimed to yield less government revenues. The supposed higher government share of mining revenues inFTAA is due to the AGS, 1There are two mining contract schemes for private miners. One is the Mineral Production Sharing Agreement (MPSA) and the other is the Financial or Technical Assistance Agreement (FTAA ). Local mines are usually under MPSAs, while the FTAA is intended for large-scale mining investment of foreign firms. The following are the primary differences between MPSA and FTAA. MPSA requires 60% - 40% Filipino-foreign ownership; FTAA allows up to 100% foreign owner- ship. Required capitalization of firms under MPSA is PhP2.5 million; for firms under FTAA, USD4 million. Mining rights under MPSA is limited to extraction of minerals; mining rights under FTAA include exploration, development and extraction [5-7]. Copyright © 2013 SciRes. ME  R. U. MENDOZA, T. A. CANARE 523 Figure 1. Philippine Mining Revenue Allocation Scheme. Notes: Illustration draws on information reported in [1,2,4]. a) Net Mining Revenue = Gross Sales − Operating Expenses − Interest Expenses − Development Expenses − Royalty to Land Own- ers; b) Basic Government Share = Sum of all taxes, royalties and fees paid to the national and local governments; c) VAT and Customs Duties on imported goods and services; d) S et by LGUs; e) PhP75 or PhP100 per hectare per annum, PhP5 per hec- tare per annum for exploration. which is absent in MPSA. AGS is essen tially used to tax resource rent, but it is not progressive, unlike the instru- ments used by other governments to tax excess profit [1]. However, pursuing more FTAAs is easier said than done, and this is highlighted by the disproportionately large amount of MPSAs compared to FTAAs. There are currently 339 existing MPSAs as opposed to only six FTAAs. Analysts cite various reasons why mining firms choose MPSA over FTAA. One is amount of capitaliza- tion—firms who want to apply for an FTAA are required USD4 million capitalization compared to PhP2.5 million for MPSA. Another is the longer application process for FTAA. FTAA requires the approval of the President of the Philippines while MPSA is approved only by the DENR Secretary. FTAA is generally intended for foreign firms as this allows up to 100% foreign ownership of the investing company. Aside from royalty, income tax, excise tax and busi- ness tax, the government also receives other fees and taxes not based on income or revenue. These are VAT and duties on imported inputs, withholding taxes, fees imposed by the MGB, and local government fees and taxes. Strictly speaking, therefore, these items cannot be considered as government share in mining revenues. Nevertheless, these are still payments made by mining firms to the government, and these parts of the over-all payments to government are not unique to mining active- ties. 3. An Analysis of Data on Government Mining Revenues In order to provide a clearer picture of the government share from mining, this section contains an analysis using both macro- (industry-level) and micro- (firm-level) data. One important caveat in the analysis of industry-level data is that it fails to take into account the heterogeneity among individual firms. Hence, we also turn to firm- level data, by analyzing financial statements of selected domestic mining companies with publicly available fi- nancial information. This offers a potential way forward to analyze from the bottom-up the industries’ contribu- tions to government revenues, as this financial informa- tion are widely available as part of documents submitted annually to the Securities and Exchange Commission (SEC). Most large companies also post their financial statements in their website. However, some financial statements are not disaggregated enough for this kind of analysis. Analyzing financial statements in order to cal- culate the tax payment as a share of total mining revenue Copyright © 2013 SciRes. ME  R. U. MENDOZA, T. A. CANARE 524 of the firm would also face some limitations, as these documents do not indicate all the details needed. Never- theless, the analysis here presents a first pass estimate of the revenue share of government. We implement this standard approach using financial statements of Philip- pine mining companies and selected foreign comparators in order to arrive at some initial comparison. 3.1. Macro Level Data Table 2 shows the amount of government revenues de- rived from mining against the sum of all government re- venues. The share of mining revenue in total govern- ment receipts averaged 0.87% from 2007 to 2010, al- though figures for the latter two years are much higher than the previous two. The share of mining in total go- vernment revenue is significantly less th an the industry’s share in total Philippin e GDP, as high lighted in Figure 2. Reference [8] pointed out that this is an indicatio n of low revenue contribution from mining, and attributed it to the large share of small-scale mines (which pay small amount of tax) in total production, old mines nearing the end of operations, and new mines that are still enjoying tax perks. Further, Table 3 shows the amounts disbursed by mining firms to the government, both at the national and local levels, disaggregated into the main tax instrument (or fee) categories. Table 4 presents the share of each category in the total. Data shows that Taxes Collected by National Gov- ernment Agencies, mostly composed of income taxes, account for the largest share of disbursements made by mining firms to the government. A far second in 2010 was Excise Taxes Collected by BIR, with 9.72% share, followed closely by Taxes and Fees Collected by LGUs with 8.01%. Fees, Charges and Royalties Collected by DENR-MGB come in last at 5.88%, although the latter three items’ rankings frequently interchange in the last four years. Table 2. Government revenues, total and received from mining, (in Billions PhP), 2007 to 2010. 2007 2008 2009 2010 Average (07 to 10) National Government Revenue (A) 1137 1203 1123 1208 1168 Total LGU Revenue from Local Sources (B) 79 90 92 98 90 Total Revenue (A + B) 1216 1292 1215 1306 1258 Total Revenue from Mining (National and Local) 10.4 7.7 12.4 13.4 11.0 Share of Mining Revenue to Total 0.9% 0.6% 1.0% 1.0% 0.9% Source: Data from DOF and MGB; authors’ computations. Note: Figures may not add up due to round ing. Table 3. Components of mining firms’ payments to the government, (in Billions PhP), 2007 to 2010. 2007 2008 2009 2010 Fees, Charges and Royalties Collected by DENR-MGB/LGUs 0.77 0.56 0.40 0.80 Excise Tax Collected by BIR 0.94 0.66 0.72 1.30 Taxes Collected by National Government Agencies 8.37 5.95 10.27 10.20 Taxes and Fees Collected by LGUs 0.36 0.52 0.99 1.07 Total 10.45 7.69 12.38 13.37 Source: Data from MGB. Note: Figures may not add up due to rounding. Table 4. Components of mining firms’ payments to the government, (% Shares), 2007 to 2010. 2007 2008 2009 2010 Fees, Charges and Royalties Collected by DENR-MGB/LGUs7.4% 7.3% 3.2% 6.0% Excise Tax Collected by BIR 9.0% 8.6% 5.8% 9.7% Taxes Collected by National Government Agencies 80.1% 77.3% 82.9% 76.2% Taxes and Fees Collected by LGUs 3.4% 6.8% 8.0% 8.0% Total 100% 100% 100% 100% Source: Authors’ computations based on data from MGB. Note: Figures may not add up due to rounding. Copyright © 2013 SciRes. ME  R. U. MENDOZA, T. A. CANARE 525 Figure 2. Share of mining in total national revenue and GDP, 2007 to 2010. Source: Data from NSCB, MGB and DOF; authors’ computations. A rather direct way of looking at the actual share of the government in mining revenues is to directly com- pare the total revenues earned by all mining firms with the total amount of taxes, royalties and fees they paid. As shown in Table 5, an average share of roughly around 10% of all mining revenues goes to the government. A casual comparison might indicate that this is lower than the 15.3% calculated by the professional services firm PricewaterhouseCoopers (PWC) in a study of 22 mining firms from 20 countries in 2008 [9]. It must be noted, though, that the number of firms surveyed relative to the number of countries covered is small. The study there- fore is not meant to be representative of each country included. Figure 3 shows a comparative illustration of the share of governments in mining revenue across coun- try groups included in the PWC survey. 3.2. Firm Level Data The aggregate tax indicators only paint a partial picture of the government share. These macro-level indicators do not capture the heterogeneity in tax and fees payments across mining companies which have varying mining lifecycle points at any one point in time. For instance, a newer mine may be paying less in the beginning due to tax incentives in the early stages of mining operations. An older mine could be paying the peak of its tax pay- ments already, due to extraction schedule. A detailed financial statement with fully disaggregated Figure 3. Government share in mining revenues, Selected Mining Firms and Regions, 2008. Source: Survey data from [9]. data on revenues, taxes, fees and royalties is necessary in order to complete the firm-level snapshot. Corporations registered with the SEC are required to submit financial statements annually, and they often post these in their websites if the company has one. However, one impor- tant caveat is that there is no required disaggregation of data on revenues and expenses. Consequently, there are firms that do not have more detailed financial statements that allow us to distinguish between different types of taxes and fees, as well as on where revenues were deri- ved from3. Nevertheless, the financial statements of two4 Philip- pine mining firms were sufficiently detailed for our analysis. The financial statements of these corporations have enough disaggregation to reasonably isolate taxes, fees and royalties from other payments and expenses. Their source of revenue is also limited mainly to mining activities, i.e. any o ther so ur ces accoun t for a minor sh are of revenues. The mining companies analyzed were Nickel Asia Corporation and Philex Mining Corporation. These are large-scale mining firms with asset size of PhP26.4 bil- lion and PhP3 2.5 billion, respectively, in 2011. Nickel Asia is the largest miner of nickel in the coun- try today. The corporation was formally registered with the Securities and Exchange Commission in 2008 but its subsidiaries have been operating mines for several deca- 3Some mining firms have sizeable revenue sources other than mining activities. Although some firms report their revenues disaggregated by revenue source, the same is not true for taxes, fees and royalties. It would thus be difficult to distinguish which part of the costs, fees and taxes are attributable to mining and which part are attributable to the other revenue sources. 4We actually found three firms suitable for revenue-sharing analysis. However, the third firm—Apex Mining Corporation–posted negative income in the years of analysis [10]. It is thus giving outlying figures on taxes and revenue sharing. Nevertheless, we will use this case later as an example of heterogeneity of firm-le vel data. 2The 15.3% share includes “taxes borne” and “taxes collected” com- bined. “Taxes borne” are taxes borne out of the company’s own costs, revenues and income. For example, property taxes are borne out of the company’s own properties and income taxes are borne out of the com- p any’s own income. “Taxes collected” are those that the company collects on behalf of the government and then remits it to the latter. Example is employee income tax withheld from the employees’ payroll. The 15.3% government share in revenues is comprised of 10.8% taxes b orne and 4.5% taxes collected. Copyright © 2013 SciRes. ME  R. U. MENDOZA, T. A. CANARE 526 des now. Its subsidiaries with current mining operations inc lud e (a rea and start of year of operation in parenthesis) Hinatuan Mining Corporation (Surigao del Norte, 1980), Cagdianao Mining Corporation (Dinagat Island, 1999), Taganito Mining Corporation (Surigao del Norte, 1987) and Rio Tuba Nickel Mining Corporation (Palawan, 1975). Three of N ickel Asia’s four mines are nearing the end of their expected lives. Rio Tuba, Cagdianao and Hi- natuan have expected mine lives of 28, 6 and 9 years, respectively5. These sites are therefore operating well beyond their expected lives. Taganito is the only one operating within its expected life of 29 years. All o f these four mines are under MPSA. Philex Mining Corporation was incorporated in 1955 and has since operated the Padcal Mine in Benguet. It produces copper, gold and silver. It also extracts petro- leum and coal, although these account for only a small portion of sales. Padcal Mine is under MPSA and is ex- pected to operate until 2020. From the start of operations until 2011, the mine produced 359.3 million tons of ore containing 2.1 billion pounds of copper, 5.6 million ounces of gold and 6.1 million ounces of silver6. To begin with firm-level revenue sharing analysis, the amounts of the different types of disbursements (i.e. taxes, royalties and fees) made by the two mining firms to the government are presented. These are then com- pared to the firms’ revenues and the share of each type of disbursement in the total is calculated. The summary of payments made by the mining firms to the government is presented in Table 6, and the per- centage shares for each type of payment are shown in Figure 4. It can be seen from the bar graph that income tax is the most dominant form of payment to the gov- ernment for Philex and Nickel Asia. Royalties and excise tax account for the second largest share of the pie, fol- lowed by other taxes and licenses. Next, Table 7 shows the actual amounts paid by thetwo sample firms to the government in comparison to their revenues. It also gives the amount of disbursements to the government expressed as percent of total firm revenues. The firm-level revenue sharing (the percent share of government in total revenues) is close between Nickel Asia (18.8%) and Philex (20.0%). Recall that the taxes and fees expressed as a share of total industry revenue indicated earlier in Table 5 points to an indus- try-wide average figure of about 10%. These firm-spe- cific figures drive home the point that macro-level indi- cators fail to reflect a considerable amount of variation across firms. The PWC survey found a 15.3% average government share in mining revenues in its sample of 22 large-scale mining companies in 20 countries. For our sample of two Philippine firms, the average share of Figure 4. Share of each payment type in total disburse- ments to the government. Note: 2010 and 2011 average. Source: Authors’ computations based on firms’ financial statements. Table 5. Government share in mining revenues, 2007 to 2010, in Billions PhP and percentage share. 20072008 2009 2010 Average (07 to 10) Mining Gross Production Value102 87 106 145 110 Amount Paid to the Government10.4 7.7 12.4 13.4 11.0 Percent Share of Government 10.2%8.8% 11.7% 9.2% 10.0% Source: Data from MGB; authors’ computations. Note: Mining Gross Pro- duction Value and Amount Paid to the Government are rounded, thus direct division may not give the Percent Share of Government shown. Table 6. Disbursements to the government by type of pay- ment, in PhP, average figures for 2010 and 2011. Nickel Asiaa Philex Mining Income Tax 1,315,951,000 2,035,112,500 Royaltiesb and Excise Tax 629,735,000 783,382,500 Taxes and Licenses26,761,500 134,408,500 Total 1,972,447,500 2,952,903,500 Source: Authors’ computations based on firms’ financial statements. Notes: a Based on information shared by Nickel Asia on its 2010 taxes, the royalties it paid to the government were only PhP233, 522,000 out of the PhP361, 722,000 indicated in the income statement. The rest were paid to claim holders and indigenous people. Also, for taxes and licenses, the amount was PhP65,351,000 (instead of PhP21,125,000 indicated in the income state- ment). The d ifference was due to the wharfage fees col lected by the Phili p- pine Ports Authority. These items cannot be extracted from the financial statements. If these will be incorporated in the computations, total payments of the company to the government in 2010 would amount to PhP1,408, 087,000 (instead of PhP1,492,061,000 if these information are not taken into account). This would not significantly change our calculations, although we note this down here to recognize the caveats of our analysis. b Includes royalties paid to private enterprises. 5Based on information from Nickel Asia website and 2010 and 2011 Annual Reports [11], [12] and [13]. 6Based on information from Philex Mining website and 2011 Annual Report [14]. Copyright © 2013 SciRes. ME  R. U. MENDOZA, T. A. CANARE 527 Table 7. Revenue sharing between mining firms and go- vernment, average figures for 2010 and 2011. Nickel Asia Philex Mining Firm Revenue 10,515,372,000 14,764,192,500 Amount Paid to the Government 1,972,447 ,500 2,952,903 ,500 Government Share in Revenues 18.76%a 20.00% Source: Authors’ computations based on firms’ financial statements. Notes: a This will become 18.59% if adjustments in Footnote a of Table 6 will be taken into accou nt. government in mining revenues is 19.4% and thus is somewhat comparable—even higher—to those in the PWC surv ey. A variety of factors could help explain the heteroge- neity in tax payments across firms. These firms operate in different contexts, on different minerals, which sug- gest that the price dynamics for these different minerals, and thus tax payments, may also differ widely. Extract- ing different types of minerals and operating different types of mines entail different cost structures. Mining firms in the Philippines are also engaged at different stages of the mining lifecycle7. For instance, the explora- tion stage typically does not yield any profit, and govern- ments usually allow loss carry forward at this stage. The development phase also yields high cost for the firm as this entails construction of the necessary infrastructure and purchase of equipment. It is in the utilization phase where mining firms are most profitable [15]. Mining firms that are still in the exploration and development phases may have therefore dragged down the average government share in mining revenues in the macro-level data. Mining companies or operators could also differ widely in their economic scope (i.e. small scale vs. large scale mining operations), with possible implications on their technology use and other factor inputs which also affect costs of operations and net revenue calculations. Large-scale mines are more efficient than small-scale ones due to economies of scale and more modern equip- ment. Thus, large scale mines are able to produce more at similar costs. Inadequate technical knowledge in mining operations, as well as inadequacy of access to financial and consultancy services, lead small-scale miners to in- efficiency [16]. Inefficiencies lead to lower revenue and profit, which in turn lead to lower tax payments. In addition, governance issues—and possible tax eva- sion—especially for the less regulated small scale mining sector could also be rampant, with direct consequences on over-all revenue figures. The Chamber of Mines of the Philippines has recently urged the government to regulate and collect taxes from small-scale miners. The organization asserts that there are many loopholes in the regulation of small-scale miners and that many of them do not pay taxes8. Another source of heterogeneity in revenue-sharing across firms is the financial condition of companies. Companies experiencing negative income do not pay as much taxes compared to those who are profitable. Be- cause income tax is the biggest component of payments to the government, a negative income will significantly drive down the government share. This is best exem- plified by the example of Apex Mining. As we noted in a footnote earlier, Apex Mining’s financial statements are viable for a reasonable revenue-sharing analysis. How- ever, it was dropped from our analysis due to its outlying low tax figures (as share of revenue) compared to Nickel Asia and Philex9. Inspecting this firm’s financial state- ment will reveal that, in contrast to the two other firms, it posted losses10 in the subject years. This sharply drove down its income tax. And since the income tax is the largest source of government share in mining revenue (at least for firms with positive profit), this pulled down the amount of disbursements to the government as share of mining reve n u e s. A casual scrutiny of the macro and firm-level data will show some similarities and differences between revenue sharing trends at the national and at the firm levels. The most glaring similarity is the large share of income tax to the total disbursements of Philex and Nickel Asia, and the large share of income tax to the total amount received by the government from the mining industry as a whole. The main difference lies in the share of government to total mining revenues. The average of the two firms is 19.4%, which is higher than the overall average for the entire mining industry of about 10.0% from 2007 to 2010. 3.3. Firm Level Analysis of Foreign Mining Firms To complement the firm-level analysis of mining benefit 8The Chamber of Mines was quoted in a newspaper article [17] . 9Apex Mining’s taxes as share of revenue is 7.4%. If this will be in- cluded among the sample firms for micro-level analysis, the average taxes as share of revenue will drop from 19.4% to 15.4% –still higher than industry-level figure. 10Apex reported a PhP50 million profit for the first quarter of 2012, a reversal of the PhP50 million loss for the same period the previous year and losses for 2010 The company attributed this to higher gold prices and “streamlining of company operations”. Further exploration and development of the Maco mine in recent years also increased its gold p otential by 90% from 588,000 troy ounces in 2009 to 1.118 million troy ounces [18,19]. 7The life cycle of a mine is composed of four stages: exploration, de- velopment, utilization/commercial operation, and decommissioning and rehabilitation. Exploration involves the search for mineral deposits. Development is the construction of mine and other necessary infra- structure for mining operations. Utilization/commercial operation refers to the actual extraction of minerals. Decommissioning is the closure o f the mine after the site’s mineral supplies have been fully extracted, while rehabilitation is the restoration of the site and cleanup of mine wastes. Copyright © 2013 SciRes. ME  R. U. MENDOZA, T. A. CANARE 528 sharing among local firms, we undertake a similar analy- sis of foreign mining firms to compare their revenue sharing behavior with those of Philippine mining compa- nies. Five firms with headquarters in established mining countries and operating in various continents are in- cluded to serve as comparators. These are Barrick Gold Corporation, the Rio Tinto Group, Eurasian Natural Re- sources Corporation (ENRC), Norilsk Nickel and PT Vale Indonesia Tbk (formerly PT International Nickel Indonesia Tbk). All in all, these comparator firms have operations in at least 25 countries and produce at least 20 mine products. Similar to the analysis of local mining companies, we had to rely on publicly available financial statements of foreign firms, which are available in company websites. A similar caveat holds in that financial statements shou ld be disaggregated enough to be used for a reasonable analysis. Analyzing foreign financial statements can also be more difficult than analyzing local ones because the former follows the generally accepted accounting prince- ples (GAAP) of their home countries. Reporting of ex- pense and revenue items thus are different11. Barrick is the world’s largest gold producer in terms of production, reserves and market capitalization. The com- pany’s headquarters is in Canada, but it operates 26 mines in Canada, United States, Australia, Peru, Argen- tina, Chile, Zambia, Saudi Arabia, Dominican Republic, Papua New Guinea, Pakistan and Tanzania. Although gold is its primary extracted mineral, it also produces copper. The company was founded in 1983 and has an asset size of USD48.9 billion as of 2011. The company’s gold production for the same year was 7.7 million ounces, of which 44% were from North America, 25% from Australia and the Pacific, 24% from South America and 7% from Africa. As of 2011, it has proven and probable gold reserves of 139.9 million ounces. Barrick is also in the exploration phase of several potential mine sites across the globe12. Rio Tinto is another large mining firm with operations all over the world. Although its headquarters is lo cated in the United Kingdom, bulk of its operations is located abroad. It operates mines in Australia, Brazil, Guinea, Chile, Indonesia, United States, South Africa, Canada, Zimbabwe and Namibia. It mines five major product groups—aluminum, copper and gold, diamonds, iron ore, and coal and uranium. Iron ore contributes the largest revenue among these product groups with 49.6% share followed by aluminum with 20.2%, copp er and gold with 12.7%, coal and uranium with 12.2% and diamond with 5.3%. Rio Tinto was founded in 1873 and has an asset size of USD119.5 billion. Rio Tin to is also exp loring and developing several other mine sites in its countries of operation13. ENRC has its head office in London but the corpora- tion traces its roots in Kazakhstan, where the first invest- tors bought mining assets from the Kazakh government during its privatization program in the 1990s. Since then, the company expanded its operatio ns to several countries to include Russia, China, Brazil, Mali, Democratic Re- public of Congo, Zambia, Zimbabwe, Mozambique and South Africa. Its mine products are iron ore, chromium, manganese, silicon and aluminum. As of 2011, it has an asset size of USD15.5 billion and employs 70,000 peo- ple14. On the other hand, Norilsk Nickel is the world’s larg- est producer of its two major products—nickel and palla- dium. Its secondary products are platinum and copper and it also produces co balt, rhodiu m, silver, gold, irid ium, ruthenium, selenium, tellurium and sulfur. The com- pany’s headquarters are located in Moscow, Russia but operations are also located in Australia, Botswana, Finland and South Africa. The company started operating in 1939 and has grown to an asset size of USD18.9 bil- lion in 2011. In the same year, its production of nickel stood at 295,000 tons for 18% share of world total. Pal- ladium production was 2.8 million ounces or 41% of world total15. Established in 1968 and a 58% owned subsidiary of Vale Canada, Vale Indonesia operates 190,510 hectares of nickel mine in the island of Sulawesi. In 2011, it pro- duced 66,9 00 metric tons of nickel in matte and has 72 .1 million metric tons of proven reserves and 37.3 million metric tons of probable reserves of nickel ore. As of 2011, it has an asset size of USD2 .2 billion. Mining operations are projected to cease in 203516. Unlike the four other comparator companies, Vale In- donesia operates solely in one country17. It is also the most similar with Philippine mining companies in terms of its operational scheme. The company is limited to ex- tracting nickel ore and processing these into nickel matte. This product is then exported abroad for refining and further processing. This is unlike most large multina- tional mining firms that sometimes do refining and smelting of some of their ore extracts. Aside from having publicly available financial state- ments that are disaggregated enough for a reasonable 13Based on information from the Rio Tinto Website and 2011 Annual Report [21]. 14Based on information from the ENRC Website and 2011 Annual Report [22]. 15Based on information from Norilsk Nickel’s Website and 2011 An- nual Report [23]. 16Based on information from Vale Indonesia 2011 Annual Report [24]. 17Although its parent company, Vale, operates all over the world. 11For instance, some foreign firms report revenues as net of sales taxes. Some also subsume sales tax in royalties in their financial statements (because they are both indexed on revenue). Nevertheless, we chose firms that we can reasona b ly isolate the tax items in their financial statements. 12Based on information from the Barrick Gold Website and 2011 An- nual Re p ort [ 20 ] . Copyright © 2013 SciRes. ME  R. U. MENDOZA, T. A. CANARE Copyright © 2013 SciRes. ME 529 revenue sharing analysis, these five firms have particular attributes that make them good comparators. Barrick Gold, Rio Tinto, ENRC and Norilsk Nickel are multina- tional corporations that operate mines in different coun- tries at different stages of the mining life cycle. They also extract different types of minerals. Their tax figures thus level out differences in revenue sharing arising from dif- ferences in minerals extracted, stages in mine life cycle, and revenue sharing policies in the hos t countries. On the other hand, Vale Indonesia is a good comparator because it operates in a country with a similar economic and socio-political condition as the Philippines. Its structure is also similar to many mines in the Philippines—partly or majority owned by foreigners and production process is limited to extraction and initial processing of ores be- fore being exported for refining, smelting and further processing. Taxes paid by Rio Tinto are 128 times higher than the taxes paid by Philex Mining, and about 288 times that of Nickel Asia. Taxes paid by Barrick Gold, ENRC and Norilsk Nickel are also much larger than those of the two Philippine firms being studied. Indeed, Barrick Gold, Rio Tinto, ENRC and Norilsk Nickel are all included in the world’s 100 largest mining firms based on market value [27]. The taxes paid by Vale Indonesia—the only South East Asian firm in the comparator group—are also larger than the taxes paid by the Philippine firms being studied, but only by a relatively smaller degree. Scaling tax payments by company revenues provides a more meaningful comparison. Table 8 presents the amount of taxes paid by the foreign firms scaled by their revenues. Taxes as share of company revenue for Barrick Gold, Rio Tinto, ENRC, Norilsk Nickel and Vale Indo- nesia of 17.9%, 13.6%, 16.8%, 17.1% and 13.3%, re- spectively—for an average of 15.7%—do not seem far from the 19.4% average of Nickel Asia and Philex Min- ing. Moreover, these figures are also very close to the 15.3% average government share found by the PWC survey mentioned above. The next point of comparison is on the share of each payment type to total disbursements to the government. The summary of payments made by the firms to the go- vernments where they operate are shown in Table 9, and the percent share of each payment type for each firm is shown in Figure 5. Similar to local firms, income tax is the largest com- ponent of payments to government of the five foreign companies. Income tax accounts for an average 68.7% of all disbursements to governments. This is comparable to the share of income tax in total tax payments of the two Philippine firms in the sample at 67.8%. The share of revenue-based taxes (royalties and excise tax) is, how- ever, larger for the Philippine firms at 29.2% against 16.4% for the foreign comparators. Two things may be observed from the revenue sharing analysis of the domestic mining firms and the comparator foreign companies. First, the share of taxes in total reve- nue is comparable between the foreign and the Philippine firms analyzed in this study. As shown in Figure 6, the share for the Philippine firms in the sample is even higher by 3.7 percentage points. However, this must be interpreted with caution. As discussed earlier, the Indus- try-wide average in the Ph ilippines is lower than this, an d the share of the mining industry in total government revenues is less than its share in total GDP. From 2007 to 2010, the average annual share of mining in total gov- ernment revenue is less than half its share in total GDP (0.87% against 1.93%). This is a possible sign that the government is not getting enough from the mining indus- try as a whole [8]. Second, taxes indexed to income make up the bulk of payments to the government for both Philippine and foreign mining firms—and the share of income tax to total tax payments is comparable between Table 8. Revenue sharing between mining firms and government, 2010 and 2011 average, in millions USD. Barrick Gold Rio Tintoa ENRC Norilsk Nickel Vale Indonesia Firm Revenue 12,697 65,234 7155 13,449 1259 Amount Paid to the Government 2270 8844 1202 2299 167 Government Share in Revenues 17.9% 13.6% 16.8% 17.1% 13.3% Source: Authors’ computations based on firms’ financial statements. Note: a Rio T into publishes a separate report on taxes paid [25] [26]. Table 9. Disbursements to governments by type of payment, 2010 and 2011 average, in millions USD. Barrick Gold Rio Tinto ENRC Norilsk Nickel Vale Indonesia Income Tax 1642 5523 775 1504 131 Royalties and Sales Taxa 346 2006 380 171b 9 Other Taxes 283 1316 48 624 27 Total 2270 8844 1202 2299 167 Source: Authors’ computations based on firms’ financial statements. Notes: a Royalties may include royalties paid to private enterprises. This item may include ther taxes subsumed under or reported with sales tax and royalties. b “Ta x Directly Attributable to Cost of Goods Sold ” in Norilsk Nickel’s fina ncial statem ent. o  R. U. MENDOZA, T. A. CANARE 530 Figure 5. Share of each payment type in total disbursements to governments, 2010 and 2011 average. Source: Authors’ computations based on firms’ financial statements. the two groups. The difference lies in the share of reve- nue-based taxes (royalties and sales tax). The share of this tax component for the sample Philippine firms is 29%, and 16% for the foreign comparators. This is illus- trated in Figure 7. The data on income-based and revenue-based taxes is emphasized here because of the differences in implica- tions of charging income-based and revenue-based taxes. Presumably, a tax arrangement that is tied to company income also ensures that the government gains during natural resource booms18. One question is whether the Philippines would like to explore slightly higher taxes on mining that would be indexed on income, yet be applied over and above th e corporate income tax, when ther e are supernormal profits. The present corporate income tax rate in the country is 30%—near the levels of other Asian economies such as Thailand (30%)19, Malaysia (25%), Indonesia (25%), Viet Nam (25%), China (25%) and India (30%)20. The literature suggests that there are several advan- tages of using taxes tied to income over taxes tied to revenue. Royalties imposed on revenue introduce ineffi- ciencies and affect the firm’s production decision be- cause these increase the marginal cost of production. In contrast, a tax on profit is more efficient because it does not affect the optimal level of output. Indexing of taxes also affect the sharing of risk between firm and govern- ment. Tax on income tends to distribute risk between the Figure 6. Revenue sharing between mining firms and gov- ernment. Note: Average for 2010 and 2011. Source: Au- thors’ computations based on firms’ financial statements. Figure 7. Share of each payment type in total disburse- ments to Government. Note: Average for 2010 and 2011. Source: Authors’ computations based on firms’ financial statements. mining firms and the government while tax on revenue shifts risk to the former [15,28]. A tax on profit also better captures mining rent com- pared to royalties, notably when there are price booms. And while many countries use royalty to get hold of early revenue flows, it is often offset by lower income tax rates. Some countries also use variable income tax rates on mining firms. Tax rates could be higher in years when profitability is high and lower in years when prof- itability is low [1]. This is, however, an administrative challenge. Another disadvantage of a revenue-based tax is its regressive effect on the tax regime. With high roy- alties, the average effective tax rate is higher for less profitable firms and lower for more profitable mines [8]. 18If tax is tied to revenue, collections will also increase during natural resource price booms, but only if the miner’s selling price follows the world price. Some mining firms and the buyers of their mineral prod- ucts engage in hedging—the price of future transactions is already specified in the contract. Thus, even if market price increases by a large amount, revenue and therefore taxes do not. 19Temporarily reduced to 23% for 2012 and 20% for 2013 and 2014. 20Based on data from PricewaterhouseCoopers Worldwide Tax Sum- maries database [29]. On the other hand, the advantage of a revenue-based tax is it assures the government of some share in mining revenue even during years when mines post losses, aside from guaranteed government share in early revenue flows as mentioned earlier. Copyright © 2013 SciRes. ME  R. U. MENDOZA, T. A. CANARE 531 From the preceding analysis of available data, it is clear that macro-level revenue indicators should be inter- preted with care. Much heterogeneity in firm-level information is averaged-away by merely looking at the industry-level indicators. Indeed, our preliminary calcu- lations suggest that some firms’ tax revenues are much higher than these industry averages indicate. It must be emphasized that data on Figure 2 (share of mining in government revenue and GDP) and Table 5 (government share in mining revenue) are for the entire mining industry, while the two Philippine firms and five foreign firms in the sample are large-scale metallic mines. Pre- sumably, some types of mining—small scale and/or non-metallic—are pulling the figures down21. 3.4. An Analysis of Net Revenue Sharing Another way of analyzing mining benefit sharing is by looking at net revenue rather than gross revenue. Using this method controls for differences in cost structures arising from differences in type of mine, age of mine and type of mineral extracted, among other factors. Net revenues—gross revenues less costs—measure the actual returns that the firm and the economy receive from min- ing. For the purpose of this study, the terms net revenue and net benefit will be used interchangeably and will refer to the mining firms’ profit before income tax. Figure 8 shows taxes and other payments to the gover- nment as share of both gross and net benefits for the two Philippine mining firms and the five foreign mining firms in the sample. The Philippine mining firms’ avera- ge taxes as a share of net benefits stood at 40.22%— almost equal to that of the foreign firms’ average of 40.37%. Hence, expressing the indicator in terms of net revenues does not really change the gist of our earlier analysis. 4. Summary, Recommendations and Directions for Future Policy Research Drawing on the analysis herein, there are at least three main messages for policymakers here. First, we find signs that the mining industry as a whole may not be contributing enough to government revenue. Possible reasons for this include the large share of small-scale mining to total production and the presence of mines that only recently commenced and may still be enjoying tax perks. This highlights the need to examine whether these tax incentives are still needed and to what extent small scale mines can contribute their fair share in tax pay- ments. A word of caution, though, for policy makers is that increasing taxes, particularly for those who are al- ready at par with international standards, may bring in some tradeoffs. The usual argument of unattractiveness to investors is one, but there can be other less obvious Figure 8. Taxes as share of gross and net revenue. Note: Average for 2010 and 2011. Source: Authors’ computations based on firms’ financial statements. consequences. Because taxes are higher, the mining firms may be incentivized to drive down their cost as low as possible. This might result in disincentives to invest in technologies that are cleaner but are often more expen- sive. Policymakers need to consider that an increase in taxes collected may just be offset by additional cleanup or mitigation expenses. This does not necessarily mean that taxes should not be increased—it just implies that any planned increase in taxes should be studied carefully, with costs and benefits being weighed. Analysis should also be mineral-specific and mine-type-specific as these groups have heterogeneous technologies and cost struc- tures. Second, analysts and researchers should be careful in interpreting macro-level data on revenue sharing due to heterogeneity of firm-level data. The scale of the mine, its stage in the mining cycle, and even governance and implementation of laws can affect the sharing of revenue between mining firms and the government. Nevertheless, based on the preliminary evidence we have here, at least two of the Philippine mines actually stack-up well on tax payments , when juxtap osed against the available interna- tional comparators. More disag gregated, yet still compre- hensive, information is necessary to provide a fuller and fair picture of the revenue sharing across the public and the private sectors. A complete simulation of tax pay- ments for the entire mine life across different minerals and different mine types is essential in determining if we really are at par with other established mining countries in terms of taxing mining firms. Simulation will also guide policy-makers in gauging the fairness of revenue- sharing regime. Future research on revenue sharing could be usefully expanded in at least two more directions. First, this paper has examined benefits using government revenues as a 21This is confirmed by our discussions with industry officials. Copyright © 2013 SciRes. ME  R. U. MENDOZA, T. A. CANARE Copyright © 2013 SciRes. ME 532 Table 10. Selected sovereign wealth funds from the extractives industry. Country Fund Name Date Est. Assets ($Bn) Fund Type Modes of Distr i bution Impact on Social Development & Children Transparency Scorea Source of Revenue Botswana Pula Fund 1994 6.9 Savings The fund is part of the foreign exchange reserves. Its goal is to preserve a portion of the income for future generations. Investment rule recognizes investments in human capital as part of “sustainable investment/spending” 6 diamonds and minerals Brunei Brunei Investment Agency 1983 30 Savings Earnings produced from the oil industry are utilized to build up foreign reserves. The fund helps to finance free education and health care provided by the government 1 oil Chile Social & Economic Stabilization Fund 1985 21.8 Stabilization Savings The aim of the Pension Reserve Fund is to address an expected future government pension liability shortfall. As a Savings Fund, it enables a transfer of wealth from one generation to the next for the purpose of future sustainability. In 2009, 14.5% growth in public spending despite fiscal revenues falling by 23%; Direct transfer to low income families of around $80 each during the crisis. 10 copper Kiribati Revenue Equalization Reserve Fund 1956 0.4 Stabilization The fund is part of the government’s assets and contained more than U.S. $500 million in 2009. 1 phosphates Mauritania National Fund for Hydrocarbon Reserves 2006 0.3 Stabilization Savings The fund plays the role of a macroeconomic stabilization for country. It has goal of accumulating savings for future generations . 1 oil & gas Mongolia Mongolia Human Health Fund 2013 30 Stabilization SW Fund will come on line in 2013; Direct transfer cash/non-cash securities to 2.7 million citizens plus central budget allocations for health and education Special monthly direct cash transfers to all citizens n/a EITI Copper and gold Papua New Guinea PNG Mineral Resources Stabilization Fund 1974-1999 Stabilization The MRSF was designed as a fiscal tool to support macro-economic management of the national economy. The current government plans to create a new SWF Special youth and children support grants to local governments & communities n/a Minerals , oil/natural gas Qatar Qatar Investment Authority 2005 85 The fund devoted to diversification using money from its energy sector to invest in non-energy related sectors. The QIA controls around $75 billion in assets. 5 oil Timor Leste Timor-Leste Petroleum Fund 2005 8.3 Stabilization Savings The Fund is integrated into the State Budget. By law, annual draw downs cannot exceed the Estimated Sustainable Income. The fund has built-in requirements for transparency and accountability. Currently funding overseas graduate education for 160 students; Central budget support for health and education 1 EITI Oil and natural gas Texas Permanent School Fund 1895 The fund is used exclusively for the benefit of Texas public schools Supports primary and secondary schools N/A Oil/gas and mineral royalty payments Nigeria Sovereign Investment Fund 2011 1 Savings stabilization Funding mechanism for 3 funds: Future Generation Fund Infrastructure Fund Stabilization Fund Supports human development and infrastructure investments N/A Oil revenues Kuwait Investment Authority 1953 296 Savings Provides a source of reserve funding for Future Generation Fund 6 State transfers 10% of oil revenues annually to this fund Bahrain Taskeen Investment Board 2007 Savings Funding mechanism to support investments in job creation Targets creation of 20,000 jobs N/A Oil revenues Source: [30]. Notes: aLinaburg-Maduell Tra nspar enc y Index.  R. U. MENDOZA, T. A. CANARE 533 possible metric. Yet benefits derived from the public are not just reflected in tax revenues or mining royalties. These are also included in aspects such as job creation, and community-related investments and the corporate social responsibility (CSR) projects supported by the firms. The public sector is expected to try to represent the views of various stakeholders with potentially widely varying interests and objectives—spanning both national and local government, civil society, and other groups in society with a stake in natural resource wealth manage- ment (including present and future generations). This difficult aggregation of preferences often involves very rough and often difficult bargains across different interest groups. It would be useful to shed light on these different aspects in a more empirical way. Second, it is also clearly relevant to go beyond the concept of benefits, and better reflect net benefits—or benefits net of costs related to mining—which creates a much more nuanced understanding of the net impact on the different stakeholders of this economic activity. Al- though this paper presented a brief overview of govern- ment share in mining firms’ profit, net benefit may be defined in other ways other than profit, and this is worth studying further in future research in this area. For in- stance, if neither the mining company nor the govern- ment agencies (both local and national) provide resources for mine clean-up and environmental rehabilitation, the brunt of the environmental damage and its costs to hu- man development will likely be born e by the community hosting the mine. Facing such costs, it is unlikely that they will get a net positive gain fro m mining. This is part of the reason why it is now considered international best practice for mining companies to contribute to a fund that would be dedicated for the future cost of clean-up and mine site rehabilitation once the mining operations cease [30]. The Philippines does not fall behind in this resp ect, as mining companies are required to maintain funds for future cost of rehabilitation and clean-up. Ho wever, what the country lacks is a concrete sch eme on how to use and distribute wealth derived from the mining industry. Ta- ble 10 shows a summary description of selected sover- eign wealth funds derived from extractive industries in selected countries. These funds enable the government to better manage wealth derived from mining in promoting human development. Future research on the broader net gains from extrac- tive industries should therefore involve a full accounting of all the benefits and gains—including the cost inci- dence for aspects like environmental clean-up and pro- tection—in order to clarify the true net benefits of these industries for the present and future generations. REFERENCES [1] K. Nakayama, S. Caner and P. Mullins, “Philippines: Technical Assistance Report on Road Map for a Pro- Growth and Equitable Tax System,” International Mone- tary Fund, Washington, 2011. [2] Department of Environment and Natural Resources, “Ad- ministrative Order 2007-12: Revised Guidelines Estab- lishing the Fiscal Regime of Financial or Technical As- sistance Agreements (FTAA),” Department of Environ- ment and Natural Resources, Manila, 2007. [3] F. Consiglieri, “Mining Royalty as Compensation Not Tax,” In: International Development Research Centre, Ed., Mining and Sustainable Development Series: Mining Ro- yalties, Mining Policy Research Initiative, Montevideo, 2004, pp. 4-6. [4] Department of Environment and Natural Resources, “Ad- ministrative Order 2005-07: Amendments to Chapter XVIII of DENR Administrative Order No. 96-40, as Amended, Providing for the Establishment of a Final Mine Rehabilitation and Decommissioning Fund,” De- partment of Environment and Natural Resources, Manila, 2005. [5] Republic of the Philippines, “Republic Act 7942: An Act Instituting a New System of Mineral Resources Explora- tion, Development, Utilization and Conservation,” 1995. [6] Mines and Geosciences Bureau, “Investor’s Corner”. http://www.mgb.gov.ph/pgs.aspx?pgsid=13 [7] Mines and Geosciences Bureau, “Types of Mining Rights”. http://www.mgb.gov.ph/pgs.aspx?pgsid=32 [8] E. M. Sunley, S. Caner, R. Krever and O. Luca, “Philippi- nes: Reform of the Fiscal Regimes for Mining and Petro- leum,” International Monetary Fund, Washington, 2012. [9] PricewaterhouseCoopers, “Total Tax Contribution: A Study of the Economic Contribution Mining Companies Make to Public Finances,” Pricewaterhouse Coopers, London, 2010. [10] Apex Mining Company, Incorporated, “Apex Mining Company, Inc., Annual Report for the Year Ended De- cember 31, 2010,” 2011. http://www.apexmines.com/docs/annual_report_2010.pdf [11] Nickel Asia Corporation, “Nickel Asia Corporation and Subsidiaries Consolidated Financial Statements Decem- ber 31, 2011 and 2010 and Years Ended December 31, 2011, 2010 and 2009 and Independent Auditor’s Report,” 2012. http://www.nickelasia.com/NACS_CFS1211_Nickel%20 Asia_Corporation_and_Subsidiaries.pdf [12] Nickel Asia Corporation, “Nickel Asia Corporation An- nual Report 2011,” 2012. http://www.nickelasia.com/NAC_17A_2011_Final_Odis y.pdf [13] Nickel Asia Corporation, “Nickel Asia Corporation An- nual Report 2010,” 2011. http://www.nickelasia.com/NAC_17A_2010_v.1.4.pdf [14] Philex Mining Corporation, “Philex Mining Corporation Annual Report for the Year Ended December 31, 2011,” 2012. http://philexmining.com.ph/images/stories/Philex/docume nts/px_17a_dec2011.pdf [15] P. Mitchell, “Taxation and Investment Issues in Mining,” Copyright © 2013 SciRes. ME  R. U. MENDOZA, T. A. CANARE 534 In: C. Eads, P. Mitchell and F. Paris, Eds., Advancing the EITI in the Mining Sector: A Consultation with Stake- holders, Extractive Industries Transparency Initiative, Oslo, 2009, pp. 27-31. [16] Economic Commission for Africa, “Compendium on Best Practices in Small-Scale Mining in Africa,” United Na- tions Economic Commission for Africa, Addis Ababa, 2002. [17] L. D. Desiderio, “Government Must Focus on Collecting Taxes from Small Miners—COMP,” The Philippine Star, 23 April 2012. [18] L. D. Desiderio, “Apex Upgrades Maco Mine Estimate,” The Philippine Star, 13 April 2012. [19] R. T. Olchondra, “Apex Reports P50M in Q1 Profit,” Philippine Daily Inquirer, 14 June 2012. [20] Barrick Gold Corporation, “Barrick Gold Corporation Annual Report 2011,” 2012. http://www.barrick.com/files/doc_financials/2011Annual Reports/Barrick-Annual-Report-2011.pdf [21] Rio Tinto Group, “2011 Financial Statements,” 2012. http://www.riotinto.com/annualreport2011/pdf/financial_ statements.pdf [22] Eurasian Natural Resources Corporation, “Eurasian Natural Resources Corporation PLC Annual Report and Accounts 2011,” 2012. www.enrc.com/system/files/financialdocs/ENRC_AR201 1.pdf [23] Norilsk Nickel, “Mining and Metallurgical Company Norilsk Nickel Consolidated Financial Statements for the Year Ended 31 December 2011,” 2012. http://www.nornik.ru/_upload/editor_files/file1862.pdf [24] PT Vale Indonesia Tbk, “2011 Annual Report,” 2012. http://www.valeindonesia.co.id/doc/PTVI%202011%20A nnual%20Report.pdf [25] Rio Tinto Group, “Taxes Paid in 2010: A Report on the Economic Contribution Made by Rio Tinto to Public Fi- nances,” 2011. http://www.riotinto.com/documents/ReportsPublications/ RT_Taxes_paid_in_2010.pdf [26] Rio Tinto Group, “Taxes Paid in 2011: A Report on the Economic Contribution Made by Rio Tinto to Public Fi- nances,” 2012. http://www.riotinto.com/documents/RioTinto_taxespaidin 2011.PDF [27] B. Seargeant, “Top 100 Mining Companies: What a Dif- ference a Year Makes,” Mineweb, 12 January 2010. http://www.mineweb.com/mineweb/view/mineweb/en/pa ge67?oid=95737&sn=Detail [28] J. Otto, C. Andrews, F. Cawood, M. Doggett, P. Guj, F. Stermole, et al., “Mining Royalties: A Global Study of Their Impact on Investors, Government and Civil Soci- ety,” The World Bank, Washington, 2006. [29] PricewaterhouseCoopers, “Corporate Income Tax Head- line Rates for WWTS Countries,” 2012. http://www.taxsummaries.pwc.com/uk/taxsummaries/ww tsattach- ments.nsf/vwLUQuickChartAttachments/CJWY-8PCQA N/$File/WWTS%20Quick%20Chart%20-%20CIT%20Ra tes%201-July-2013.pdf [30] R. U. Mendoza, H. J. McArthur and A. O. Lopez, “Devil’s Excrement or Manna from Heaven? A Survey of Strategies in Natural Resource Wealth Management,” Asian Institute of Management Working Paper, April 25, 2012. Copyright © 2013 SciRes. ME |