 Journal of Data Analysis and Information Processing, 2013, 1, 30-34 http://dx.doi.org/10.4236/jdaip.2013.13005 Published Online August 2013 (http://www.scirp.org/journal/jdaip) Application of Extended Multiplicative Signal Correction to Short-Wavelength near Infrared Spectra of Moisture in Marzipan Pedro dos Santos Panero1, Francisco dos Santos Panero2, João dos Santos Panero3, Henrique Eduardo Bezerra da Silva4 1Câmpus Novo Paraíso, Instituto Federal de Educação, Ciência e Tecnologia de Roraima, Boa Vista, Brazil 2Instituto Federal de Educação, Ciência e Tecnologia de Roraima, Boa Vista, Brazil 3Departamento de Engenharia Elétrica, Universidade Federal de Roraima, Boa Vista, Brazil 4Departamento de Química, Universidade Federal de Roraima, Boa Vista, Brazil Email: fspaneroit@yahoo.com.br Received June 15, 2013; revised July 22, 2013; accepted August 12, 2013 Copyright © 2013 Pedro dos Santos Panero et al. This is an open access article distributed under the Creative Commons Attribution License, which permits unrestricted use, distribution, and reproduction in any medium, provided the original work is properly cited. ABSTRACT Short-wavelength near infrared spectroscopy (SW-NIR) is a very rapid, versatile and precise technique, which can be used in many different situations and for very types of products and chemical compounds. Extended multiplicative sig- nal correction (EMSC) is a modification of the standard MSC pre-processing method that allows the separation of physical light scattering effects from chemical (vibrational) ligh t absorbance effects in spectra. In this paper, the EMSC is applied and compared with first derivate, second derivate, MSC and SNV in combination of PLSR to obtain robust models in terms of accuracy and predict ab ility with a reduced calibration data set using SW-NIR spectra of moisture in marzipan. The Extended Multiplicativ e Signal Correction—EMSC and combination methods provide the best results in terms of prediction ability and calibration SW-NIR spectra of moisture in marzipan. The b est classification results were obtained by Extended Multip licative Signal Correction followed by second derivates. Keywords: EMSC; PLSR; SW-NIR; Extended Multiplicative Signal Correction; Chemometrics 1. Introduction Multivariable electromagnetic spectrophotometry in the near or mid-infrared region offers great practical and economical advantages for analysis of large sample se- ries, as demonstrated by diffuse NIR reflectance or transmittance spectroscopy in areas such as agriculture, food technology, pharmaceutics, and petrochemistry [1]. Today, such high-speed instruments are routinely de- signed to yield precise quantitative determination for a variety of chemical and physical properties, using multi- variate calibration to solve the selectivity problems caused by the lack of sample preparation and for auto- matic detection of outliers [2]. Preprocessing of the sp ec- tral measurements is used for optimizing the subsequent multivariate calibration. When analyzing more or less intact complex samples by diffuse reflectance or transmittance spectroscopy, uncontrolled variations in light scattering are often a dominating artifact that co mplicates subsequent quantita- tive chemical analysis. This undesired scattering varia- tion is due to uncontrolled physical variations in the measured samples: particle size and shape, sample pack- ing, sample surface, etc. If the light scattering could be modeled and corrected for mathematically in a more elaborate preprocessing stage, these problems could be reduced or eliminated. The cost of NIR analysis could then be reduced, because the need for controlled sample preparation could be further reduced, the number of cali- bration samples could be reduced, and the statistical calibration modeling process could be simplified. More- over, a pragmatic but reasonably accurate model-based light scatter correction may shed new light on the light scattering processes themselves [3]. One of the main mistake sources found in quantitative determinations, through the spectroscopy or Short- Wavelength near Infrared (SW-NIR) spectroscopy (700 - 1100 nm), it is phenomenon of scattering of light, pro- voked by the non homogeneity of the sample, mainly for the granulometric differences, geometry, packing and C opyright © 2013 SciRes. JDAIP 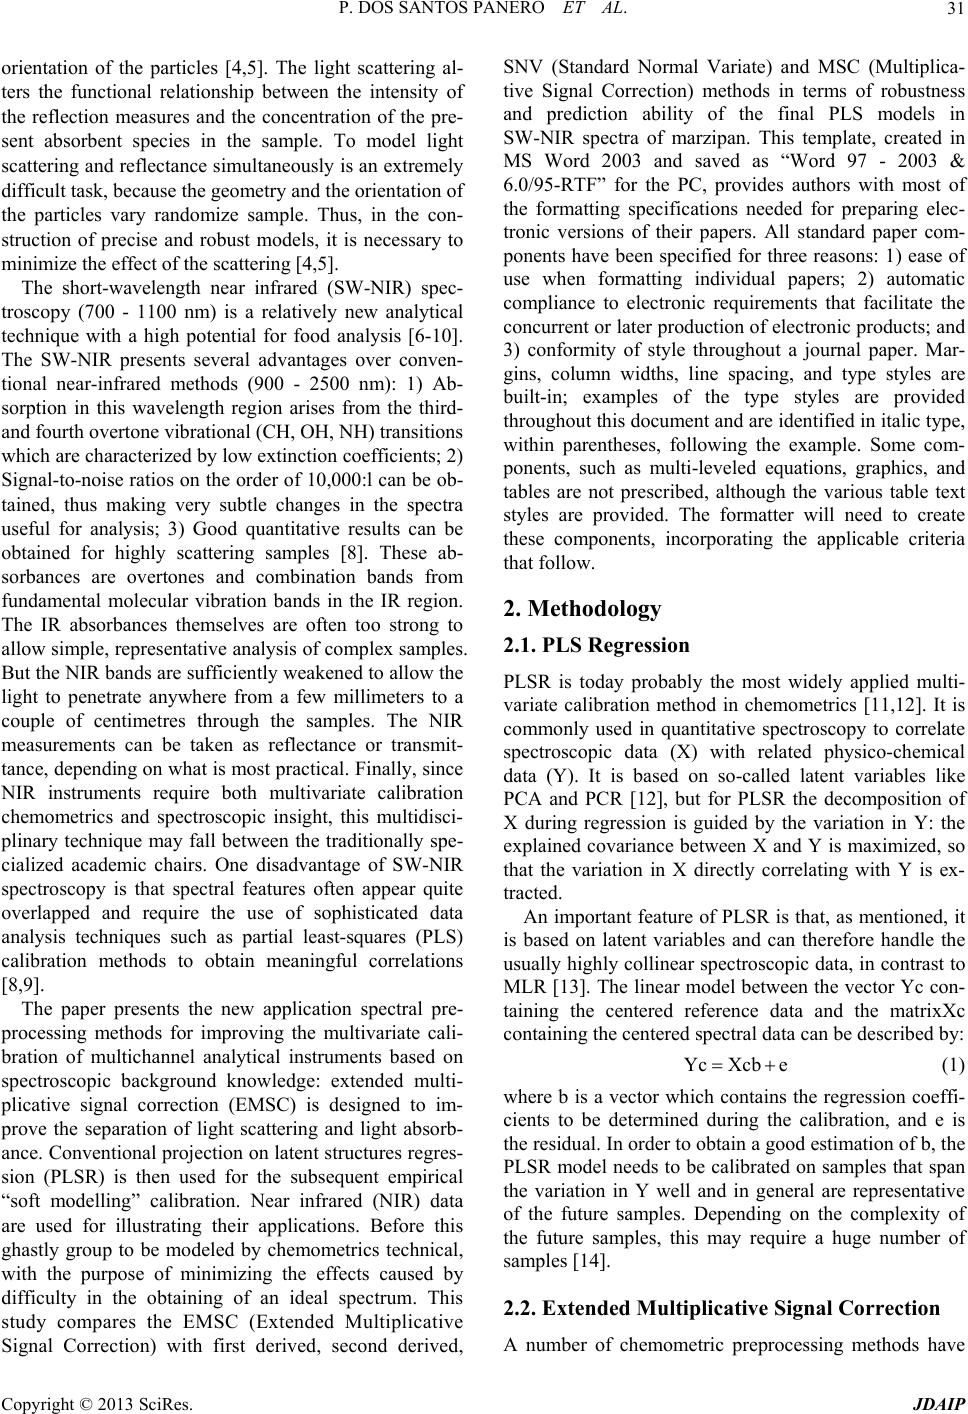 P. DOS SANTOS PANERO ET AL. 31 orientation of the particles [4,5]. The light scattering al- ters the functional relationship between the intensity of the reflection measures and the concentration of the pre- sent absorbent species in the sample. To model light scattering and reflectance simultaneously is an extremely difficult task, because the geometry and the orientation of the particles vary randomize sample. Thus, in the con- struction of precise and robust models, it is necessary to minimize the effect of the scattering [4,5]. The short-wavelength near infrared (SW-NIR) spec- troscopy (700 - 1100 nm) is a relatively new analytical technique with a high potential for food analysis [6-10]. The SW-NIR presents several advantages over conven- tional near-infrared methods (900 - 2500 nm): 1) Ab- sorption in this wavelength region arises from the third- and fourth overtone vibrational (CH, OH, NH) transitions which are characterized by low extinction coefficients; 2) Signal-to-noise ratios on the order of 10,000:l can be ob- tained, thus making very subtle changes in the spectra useful for analysis; 3) Good quantitative results can be obtained for highly scattering samples [8]. These ab- sorbances are overtones and combination bands from fundamental molecular vibration bands in the IR region. The IR absorbances themselves are often too strong to allow simple, representative analysis of complex samples. But the NIR bands are su fficiently weaken ed to allow th e light to penetrate anywhere from a few millimeters to a couple of centimetres through the samples. The NIR measurements can be taken as reflectance or transmit- tance, depending on what is most practical. Finally, since NIR instruments require both multivariate calibration chemometrics and spectroscopic insight, this multidisci- plinary technique may fall between the traditionally spe- cialized academic chairs. One disadvantage of SW-NIR spectroscopy is that spectral features often appear quite overlapped and require the use of sophisticated data analysis techniques such as partial least-squares (PLS) calibration methods to obtain meaningful correlations [8,9]. The paper presents the new application spectral pre- processing methods for improving the multivariate cali- bration of multichannel analytical instruments based on spectroscopic background knowledge: extended multi- plicative signal correction (EMSC) is designed to im- prove the separation of light scattering and light absorb- ance. Conventional projection on latent structures regres- sion (PLSR) is then used for the subsequent empirical “soft modelling” calibration. Near infrared (NIR) data are used for illustrating their applications. Before this ghastly group to be modeled by chemometrics technical, with the purpose of minimizing the effects caused by difficulty in the obtaining of an ideal spectrum. This study compares the EMSC (Extended Multiplicative Signal Correction) with first derived, second derived, SNV (Standard Normal Variate) and MSC (Multiplica- tive Signal Correction) methods in terms of robustness and prediction ability of the final PLS models in SW-NIR spectra of marzipan. This template, created in MS Word 2003 and saved as “Word 97 - 2003 & 6.0/95-RTF” for the PC, provides authors with most of the formatting specifications needed for preparing elec- tronic versions of their papers. All standard paper com- ponents have been specified for three reasons: 1) ease of use when formatting individual papers; 2) automatic compliance to electronic requirements that facilitate the concurrent or later production of electronic products; and 3) conformity of style throughout a journal paper. Mar- gins, column widths, line spacing, and type styles are built-in; examples of the type styles are provided throughout this do cument and are iden tified in italic typ e, within parentheses, following the example. Some com- ponents, such as multi-leveled equations, graphics, and tables are not prescribed, although the various table text styles are provided. The formatter will need to create these components, incorporating the applicable criteria that follow. 2. Methodology 2.1. PLS Regression PLSR is today probably the most widely applied multi- variate calibration method in chemometrics [11,12]. It is commonly used in quantitative spectroscopy to correlate spectroscopic data (X) with related physico-chemical data (Y). It is based on so-called latent variables like PCA and PCR [12], but for PLSR the decomposition of X during regression is guided by the variation in Y: the explained covariance between X and Y is maximized, so that the variation in X directly correlating with Y is ex- tracted. An important feature of PLSR is that, as mentioned, it is based on latent variables and can therefore handle the usually highly collinear sp ectroscopic data, in contrast to MLR [13]. The linear model between the vector Yc con- taining the centered reference data and the matrixXc containing the centered spectral data can be described by: YcXcb e (1) where b is a vector which contains the regression coeffi- cients to be determined during the calibration, and e is the residual. In order to obtain a good estimation of b, the PLSR model needs to be calibrated on samples that span the variation in Y well and in general are representative of the future samples. Depending on the complexity of the future samples, this may require a huge number of samples [14]. 2.2. Extended Multiplicative Signal Correction A number of chemometric preprocessing methods have Copyright © 2013 SciRes. JDAIP  P. DOS SANTOS PANERO ET AL. 32 been proposed to explicitly model the effect of multipli- cative light scattering [15]. One of the most frequently reported techniques in the literature is that of multiplica- tive signal correction (MSC) [16]. The methodology in- volves regressing each spectrum in a set of related sam- ples, i.e., the samples comprise the same chemical com- ponents, on a reference spectrum (for example, the mean spectrum) to estimate the intercept and slope of the esti- mated regression equation that will theoretically capture the information relating to the effect of multiplicative light scattering. Each individual spectrum is then cor- rected by subtracting the intercept and dividing by the slope. An alternative procedure proposed to correct for multiplicative light scattering, that is similar to MSC, is the inverted scatter correction (ISC), more recently is the Extended multiplicative signal correction (EMSC) is a modification of the standard MSC pre-processing method [4,5,15-18] that allows the separation of physical light scattering effects from chemical (vibrational) light ab- sorbance effects in spectra. It was developed by Martens and Stark [19,20] the methodology to identify and sepa- rate various effect in multi-chanel measurements making the measurements suitable lives it goes multivariate cali- bration, improving robustness and predictive ability [4, 5,19]. This approach is able to estimate and separate multiplicative physical effects (path length, light scatter- ing, sample thickness, etc.) from additive chemical effect s (absorbance of analytes and interferants) and additive physical effects (temperature shifts, baseline variations, etc.) [4,5,14,21]. It can also be used to remove identified but undesired “physical” and “chemical” interference effects, while retaining identified, but desired effects as well as unidentified effects in the data. For these pur- poses, EMSC allows the use of previous knowledge about the system and its components (constituents’ spec- tra) in the correction, which can sometimes be very use- ful and yield good calibration results [4,5]. EMSC ap- pears to be applicable to different types of spectroscopic data (UV, VIS, NIR, IR, Raman), chromatography, elec- trophoresis and sensory data [14]. 3. Experimental 3.1. Data Sets The spectral measurement compositional analysis of 32 marzipan samples. Traditional moisture was performed on all samples. The Spectral data matrix is obtened in a Instrument: Infratec 1255, Dispersive scanning is a opti- cal principle, the Available Spectral Range is 850 - 1050 nm, the Spectral Sampling is 2 nm. The data set was produced by J. Chri stensen et al. [22].The file of this data set was obtended in the Public data sets for multivariate data analysis, located in the home page of the Quality and Technology, Department of Food Science, Faculty of Science, University of Copenhagen, the matrix (32 × 100), more information http://www.models.kvl.dk/research/data/Marzipan /index. asp. 3.2. Model of Calibration and Prediction The 32 spectral of marzipan samples was utilized for construction of the models of calibration and prediction, using full Cross Validation (CV), was construction one models of calibration and prediction of each on preproc- essing: Raw, First Derivative (1st), Second Derivative (2nd), SNV, MSC, EMSC, EMSC + 1st, 1st + EMSC, EMSC + 2nd and 2nd + EMSC. All the techniques of preprocessing were evaluated in terms of robustness and prediction ab ility of the final PLSR. For the construction of the models, the date set was centered in the average. The robustness of preprocessing techniques was evalu- ated for RMSEC (Root Mean Square Error of Cross Validation) and RMSEP (Root Mean Error of Prediction) and correlation (calibration and prediction). For the con- struction of the models of calibration, prediction and comparison of the preprocessing techniques was utilized the UNSCRAMBLER V 9.2. 4. Results and Discussion Figure 1 presents different preprocessing methods ap- plied to the short-wavelength near infrared (SW-NIR) spectra (850 - 1050 nm) of moisture in marzipan. The Figure 1(a) is the SW-NIR spectra without any pr eproc- essing, the raw spectra of the 32 samples of marzipan in the calibration set. From the figure, large additive offset, multiplicative scaling effects and light scattering are readily observed. Figure 1(b) displays the same SW-NIR spectra after SNV pre-transformation. In comparison, Figure 1(c) shows MSC pre-tran sformed spect ra. Figure 1(d) displays the same SW-NIR spectra after EMSC pre- transformation. Table 1 presents the performance statistics of the PLSR models goes quantization of the marzipan moisture predictions using SW-NIR (850 - 1050 nm) spectra from the calibration and the prediction s (32 sample), using full cross validation. CV is cross validation, RMSEC is the root mean square error of cross validation and RMSEP is the root mean error of prediction. The calibration and prediction test set results for all the tested pre-transformation methods are summarized in Table 1 in terms of the RMSEC (CV) and RMSEP (CV), CV is cross validation, and of the correlation coefficients based thereon. Compared to the untransformed raw data, the basic second derivative (2nd), SNV and MSC did not affect the results very much. The first derivative (1st) and EMSC pre-transforma- Copyright © 2013 SciRes. JDAIP  P. DOS SANTOS PANERO ET AL. 33 (a) (b) (c) (d) Figure 1. SW-NIR spectra (850 - 1050 nm) of the 32 marzi- pan sample; (a) Raw; (b) SNV transformed; (c) MSC trans- formed; (d) EMSC transformed. Table 1. Performance statistics of the PLSR models. Correlation Prediction error (% moisture) Preprocessing Calibration (CV) Prediction (CV) RMSEC (CV) RMSEP (CV) Raw 0.991 0.987 0.489 0.570 First Derivative (1st) 0.992 0.989 0.449 0.529 Second Derivative (2nd) 0.991 0.988 0.480 0.561 SNV 0.993 0.990 0.462 0.533 MSC 0.993 0.991 0.467 0.536 EMSC 0.991 0.988 0.447 0.527 EMSC + 1st 0.992 0.990 0.443 0.518 1st + EMSC 0.963 0.987 0.429 0.512 EMSC + 2nd 0.993 0.990 0.420 0.500 2nd + EMSC 0.984 0.979 0.631 0.730 tion affect the results very much. But the combination between EMSC and first derivative (1st) and second de- rivative (2nd) present the b etter correlation of calibration and prediction, and the better RMSEC (CV) and RMSEP (CV). The better calibration and prediction test set is Ex- tended Multiplicative Signal Correction followed by second derivates (EMSC + 2nd), this combination usu- ally results in a reduction of the scatter related offset and light scattering and reveals mores spectral features com- pared to the raw spectra. 5. Conclusion The result of the different preprocessing methods shows that the new, extended MSC, or be, the Extended Multi- plicative Signal Correctio n—EMSC methods provide the best overall performance in terms of prediction ability and calibration short-wavelength near infrared spectros- copy (SW-NIR) spectra of moisture in marzipan. The suc- cess is presumably du e to the ability o f spectral modeling to separate chemical light-absorbance and physical light scatter effects. The best classification results were ob- tained by Extended Multiplicative Signal Correction fol- lowed by second derivates (EMSC + 2nd). This way the application of the extended multiplicative signal correc- tion—EMSC is very important for estimating and sepa- rating multiplicative physical effects (light scattering) and additive chemical effects (light absorbance) in near infrared spectroscopy. REFERENCES [1] C. Pasquini, “Near Infrared Spectroscopy: Fundamentals, Practical Aspects and Analytical Applications,” Journal of the Brazilian Chemical Society, Vol. 14, No. 2, 2003, pp. 198-219. doi:10.1590/S0103-50532003000200006 [2] H. Martens and T. Naes, “Multivariate Calibration,” 1st Edition, John Wiley & Sons, New York, 1996. [3] H. Martens, J. P. Nielsen and S. B. Engelsen, “Light Scattering and Light Absorbance Separated by Extended Multiplicative Signal Correction. Application to Near- Infrared Transmission Analysis of Powder Mixtures,” Analytical Chemistry, Vol. 75, No. 3, 2003, pp. 394-404. doi:10.1021/ac020194w [4] H. E. B. da Silva, F. S. Pane ro and L. P. D. Ribeiro, “Ap- plication by Extended Multiplivative Signal Correction to Reflectance Difuse the Near-Infrared of Ration for Shrimp,” 10th International Conference on Chemomet- rics in Analytical Chemistry, Águas de Lindóia, 10-15 September 2006, p. 23. [5] F. S. Panero and H. E. B. da Silva, “Application by Ex- tended Multiplicative Signal Correction to NIR FR Ra- man Spectra of Pharmaceutical Tablets,” 58th Pittsburg Conference on Analytical Chemistry and Applied Spec- troscopy , Chicago, 25 February-2 March 2007, p. 57. [6] M. Lin, A. G. Cavinato, D. M. Mayes, S. Smiley, Y. Huang, M. Al-Holy and B. A. Rasco, “Bruise Detection in Pacific Pink Salmon (Oncorhyncus gorbuscha) by Short-Wavelength Near-Infrared Spectroscopy,” Journal of Agricultural and Food Chemistry, Vol. 51, No. 22, 2003, pp. 6404-6408. doi:10.1021/jf0346197 [7] M. H. Lee, A. G. Cavinato, D. M. Mayes and B. A. Rasc o, “Noninvasive Short Wavelength Neon IR Spectroscopic Method to Exhibit the Crude Lipid Content in the Muscle of Intact Rainbow Trout,” Journal of Agricultural and Food Chemistry, Vol. 40, No. 1, 1992, pp. 2176-2181. doi:10.1021/jf00023a026 [8] E. Ben-Dar, Y. Inbar and Y. Chen, “The Reflectance Copyright © 2013 SciRes. JDAIP  P. DOS SANTOS PANERO ET AL. Copyright © 2013 SciRes. JDAIP 34 Spectra of Organic Matter in the Visible near Infrared and Short Wave Infrared Region (400 - 2500 nm) during a Control Decomposition Process,” Remote Sensing of En- vironment, Vol. 61, No. 1, 1997, pp. 1-15. doi:10.1016/S0034-4257(96)00120-4 [9] M. G. Trevisan and R. J. Poppi, “Química Analítica de Processos,” Quimica Nova, Vol. 29, No. 5, 2006, pp. 1065-1071. doi:10.1590/S0100-40422006000500029 [10] A. S. Malik, O. Boyko, N. Atkar and W. F. Young, “A Comparative Study of MR Imaging Profile of Titanium Pedicle Screws,” Acta Radiologica, Vol. 42, No. 3, 2001, pp. 291-293. doi:10.1080/028418501127346846 [11] H. Martens and T. Næs, “Multivariate Calibration,” 1st Edition, John Wiley & Sons, Chichester, 1989. [12] T. Næs, T. Isaksson, T. Fearn and T. Davies, “A User- Friendly Guide to Multivariate Calibration and Classifi- cation,” 1st Edition, NIR Publications, Chichester, 2002. [13] D. L. Massart, B. G. M. Vandeginste, S. N. Deming, Y. Michotte and L. Kaufman, “Data Handling in Science and Technology, Vol. 2: Chemometrics: A Textbook,” 1st Edition, Elsevier, Amsterdam, 1988. [14] M. J. Saiz-Abajo, B. H. Mevik, V. H. Segtnam and T. Naes, “Ensemble Methods and Data Augmentation by Noise Addition Applied to the Analysis of Spectroscopic Data,” Analytica Chimica Acta, Vol. 533, No. 2, 2005, pp. 147-159. doi:10.1016/j.aca.2004.10.086 [15] Z. P. Chen, J. Morris and E. Martin, “Extracting Che- mical Information from Spectral Data with Multiplicative Light Scattering Effects by Optical Path-Length Estima- tion and Correction,” Analytical Chemistry, Vol. 78, No. 22, 2006, pp. 7674-7681. doi:10.1021/ac0610255 [16] P. Geladi, D. McDougall and H. Martens, “Linearization and Scatter-Correction for Near-I nfrared Reflectance Spec- tra of Meat,” Applied Spectroscopy, Vol. 39, No. 3, 1985, pp. 491-500. doi:10.1366/0003702854248656 [17] H. Martens and E. Stark, “Extended Multiplicative Signal Orrection and Spectral Interference Subtraction: New Pre- processing Methods for near Infrared Spectroscopy,” Jour- nal of Pharmaceutical and Biomedical Analysis, Vol. 9, No. 8, 1991, pp. 625-635. doi:10.1016/0731-7085(91)80188-F [18] M. Zeaiter, J.-M. Roger and V. Bellon-Maurel, “Robust- ness of Models Developed by Multivariate Calibration. Part II: The Influence of Pre-Processing Methods,” Trends in Analytical Chemistry, Vol. 24, No. 5, 2005, pp. 437- 445. doi:10.1016/j.trac.2004.11.023 [19] B. D. K. Pedersen, H. Martens, J. Pram-Nielsen and S. Balling-Engelsen, “Near-Infrared Absorption and Scatter- ing Separated by Extended Inverted Signal Correction (EISC): Analysis of Near-Infrared Transmittance Spectra of Single Wheat Seeds,” Applied Spectroscopy, Vol. 56, No. 9, 2002, pp. 1206-1224. doi:10.1366/000370202760295467 [20] H. Martens, J. Pram-Nielsen and S. Balling-Engelsen, “Light Scattering and Light Absorbance Separated by Extended Multiplicative Signal Correction. Application to Near-Infrared Transmission Analysis of Powder Mix- tures,” Analytical Chemistry, Vol. 75, No. 3, 2003, pp. 394-404. doi:10.1021/ac020194w [21] M. Decker, P. V. Nielsen and H. Martens, “Near-Infrared Spectra of Penicillium camemberti Strains Separated by Extended Multiplicative Signal Correction Improved Pre- diction of Physical and Chemical Variations,” Applied Spectroscopy, Vol. 59, No. 1, 2005, pp. 56-68. doi:10.1366/0003702052940486 [22] Christensen, L. Nørgaard, H. Heimdal, J. G. Pedersen and S. B. Engelsen, “Rapid Spectroscopy Analysis of Marzi- pan: Comparative Instrumentation,” Journal of near In- frared Spectroscopy, Vol. 12, No. 1, 2004, pp. 63-75. doi:10.1255/jnirs.408
|