Paper Menu >>
Journal Menu >>
 Energy and Power Engineering, 2013, 5, 1-5 doi:10.4236/epe.2013.53B001 Published Online May 2013 (http://www.scirp.org/journal/epe) Design and Application of a MCU-based Smart Contactor System Fuqing Huang, Weipeng Lin Engineering & Technology Training Center , Civil Aviation University of China , Tianjin , China Email: fqhuang@cauc.edu.cn Received 2013 ABSTRACT This paper aims to design a MCU-based smart contactor system, which will realize functions of real time surveillance of contactors’ work status and data exchange with host computer, thus instantly reflect different status of the system. In case of abnormal status such as over-current or under-voltage, the contactor will be able to automatically cut off power supply to protect electrical load and the circuit. Through ARINC485 bus, system computer will collect and record con- tactor parameters, including contact voltage, contact current, supply frequency, contact temperature and contact status to provide critical data to the examination and repair of contactors. Keywords: Aerial Contactor; MCU; Testing; ARINC485 1. Introduction Aerial contactors have many applications in aircrafts and play an important role in power supply for on-board equipments and instruments. A malfunctioned contactor would cause the destruction of electric load and, even worse, an on-board electrical fire. Hence, the performance of contactors has direct impact on power supply quality for on-board system devices and has a close relation with flight safety. If it is possible to carry out real time sur- veillance and recording of contactors during a flight, then arising fault would be instantly detected and relative electrical load be disconnected to ensure the normal functioning of other electrical loads and power circuits. By this way, accident caused by breakdowns such as short circuit will be avoided and flight safety would be greatly improved. Meanwhile, maintenance interval will be greatly shortened and operation cost be saved as maintenance personnel are directed to targets based on system information, such as recorded contactor status. 2. System Design First, we select Micro Controller Unit (MCU) as the sys- tem’s main control chip to realize functions of surveil- lance and communications. Second, make sure the device is able to perform real time measuring of three phase voltage and current as signal excursion may appear. To enable an accurate measurement, we need to synchronize the sampling frequency of MCU A/D with signal fre- quency and phase position, which calls for three-phase AC signal measuring. What’s more, enable the direct control of contactor through the driving of contactor coil via I/O signal and the receiving of external control level. At last, make sure the Full-duplex communication by way of two groups of half-duplex operation RS485. The system structure framework is shown in Figure 1. 2.1. Hardware Design The system controller adopts MSP430F149 [1] MCU, an ultra-low power consumption unit produced by TI.The MCU is especially suitable for battery applications or handheld devices. Besides, the integration of a large amount of peripheral modules into the controller unit enables the MCU a perfect option for the design of SoC; and abundant alternative components with various types also enrich its flexibility for designers. As a 16 bit sim- plified instruction architecture, the MCU has plenty of working registers and data storage units, including Figure 1. System structure framework. Copyright © 2013 SciRes. EPE 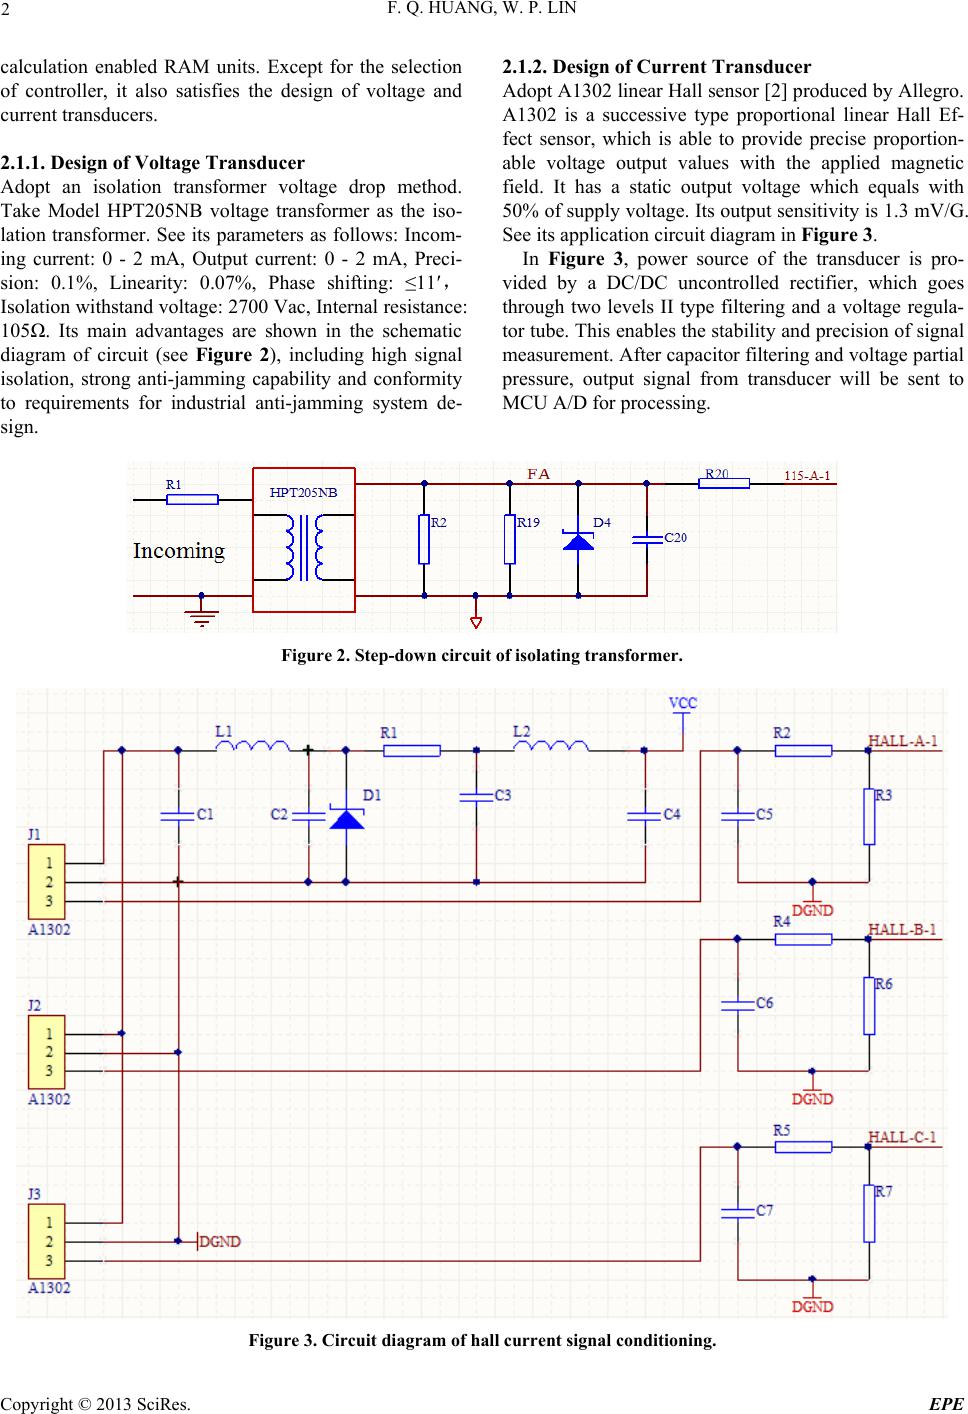 F. Q. HUANG, W. P. LIN 2 calculation enabled RAM units. Except for the selection of controller, it also satisfies the design of voltage and current transducers. 2.1.1. Design of Voltage Transducer Adopt an isolation transformer voltage drop method. Take Model HPT205NB voltage transformer as the iso- lation transformer. See its parameters as follows: Incom- ing current: 0 - 2 mA, Output current: 0 - 2 mA, Preci- sion: 0.1%, Linearity: 0.07%, Phase shifting: ≤11′, Isolation withstand voltage: 2700 Vac, Internal resistance: 105Ω. Its main advantages are shown in the schematic diagram of circuit (see Figure 2), including high signal isolation, strong anti-jamming capability and conformity to requirements for industrial anti-jamming system de- sign. 2.1.2. Design of Current Transducer Adopt A1302 linear Hall sensor [2] produced by Allegro. A1302 is a successive type proportional linear Hall Ef- fect sensor, which is able to provide precise proportion- able voltage output values with the applied magnetic field. It has a static output voltage which equals with 50% of supply voltage. Its output sensitivity is 1.3 mV/G. See its application circuit diagram in Figure 3. In Figure 3, power source of the transducer is pro- vided by a DC/DC uncontrolled rectifier, which goes through two levels II type filtering and a voltage regula- tor tube. This enables the stability and precision of signal measurement. After capacitor filtering and voltage partial pressure, output signal from transducer will be sent to MCU A/D for processing. Figure 2. Step-down circuit of isolating transformer. Figure 3. Circuit diagram of hall current signal conditioning. Copyright © 2013 SciRes. EPE 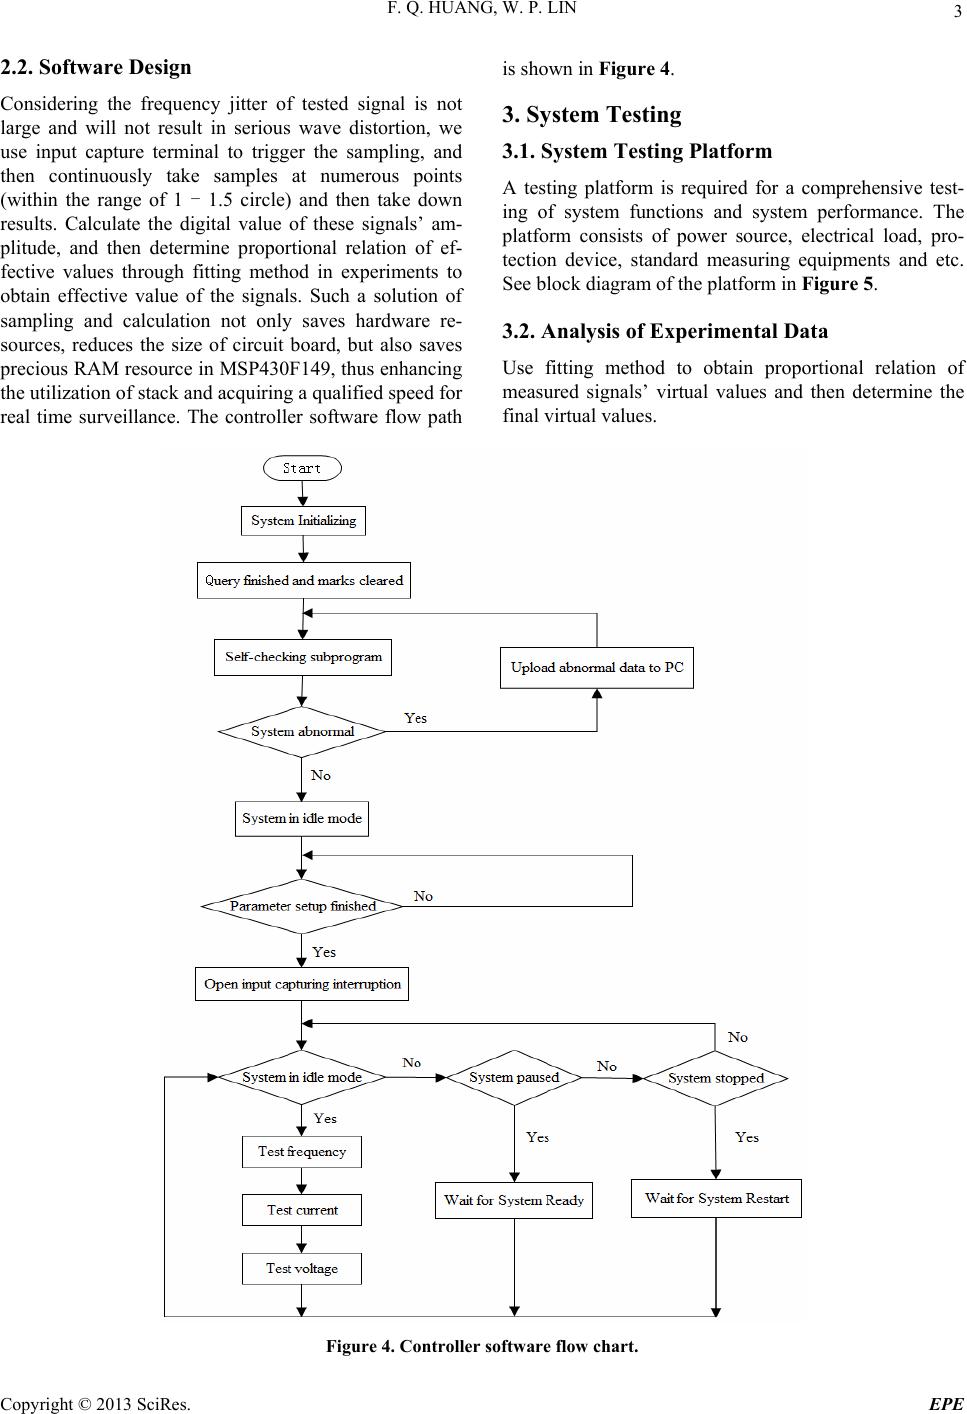 F. Q. HUANG, W. P. LIN 3 2.2. Software Design Considering the frequency jitter of tested signal is not large and will not result in serious wave distortion, we use input capture terminal to trigger the sampling, and then continuously take samples at numerous points (within the range of 1 - 1.5 circle) and then take down results. Calculate the digital value of these signals’ am- plitude, and then determine proportional relation of ef- fective values through fitting method in experiments to obtain effective value of the signals. Such a solution of sampling and calculation not only saves hardware re- sources, reduces the size of circuit board, but also saves precious RAM resource in MSP430F149, thus enhancing the utilization of stack and acquiring a qualified speed for real time surveillance. The controller software flow path is shown in Figure 4. 3. System Testing 3.1. System Testing Platform A testing platform is required for a comprehensive test- ing of system functions and system performance. The platform consists of power source, electrical load, pro- tection device, standard measuring equipments and etc. See block diagram of the platform in Figure 5. 3.2. Analysis of Experimental Data Use fitting method to obtain proportional relation of measured signals’ virtual values and then determine the final virtual values. Figure 4. Controller software flow chart. Copyright © 2013 SciRes. EPE 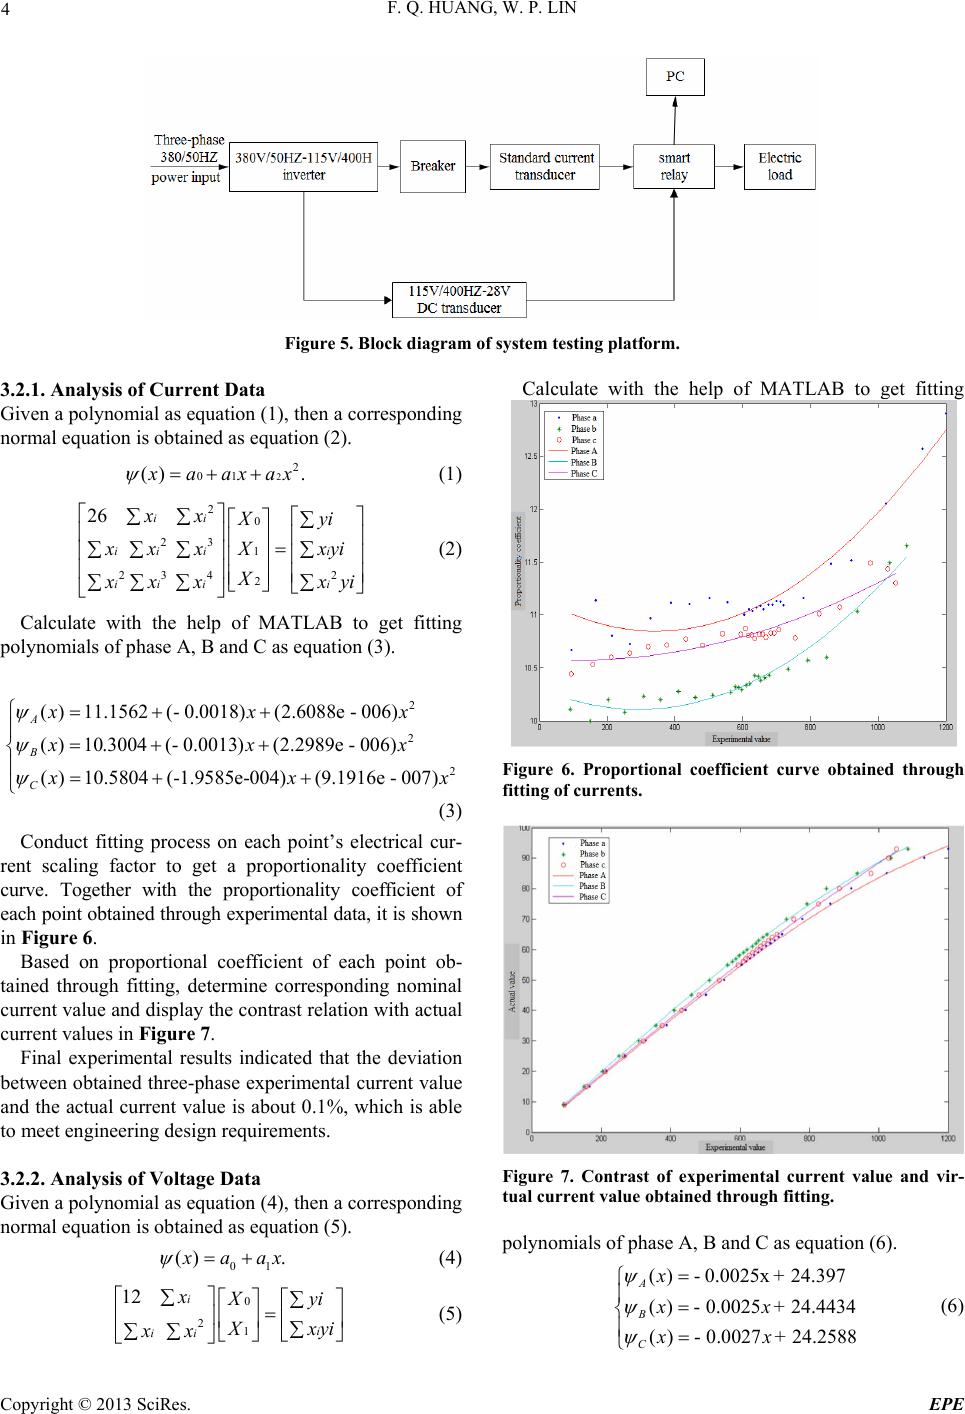 F. Q. HUANG, W. P. LIN 4 Figure 5. Block diagram of system testing platform. 3.2.1. Analysis of Current Data Given a polynomial as equation (1), then a corresponding normal equation is obtained as equation (2). 22 01 () . x aaxax (1) 2 0 23 1 23 42 2 26 ii ii ii ii ii xx Xyi x xxXxyi X x xx xyi x x (2) Calculate with the help of MATLAB to get fitting polynomials of phase A, B and C as equation (3). 2 2 02 ()11.1562(- 0.0018)(2.6088e - ()10.3004(- 0.0013)(2.2989e - ( )10.5804(-1.9585e-004)(9.191 A B C xx xx 006) 006) 6e -07) x xx (3) Conduct fitting process on each point’s electrical cur- rent scaling factor to get a proportionality coefficient curve. Together with the proportionality coefficient of each point obtained through experimental data, it is shown in Figure 6. Based on proportional coefficient of each point ob- tained through fitting, determine corresponding nominal current value and display the contrast relation with actual current values in Figure 7. Final experimental results indicated that the deviation between obtained three-phase experimental current value and the actual current value is about 0.1%, which is able to meet engineering design requirements. 3.2.2. Analysis of Voltage Data Given a polynomial as equation (4), then a corresponding normal equation is obtained as equation (5). 01 () . x aax (4) 0 21 12 i i ii x X yi X xyi xx (5) Calculate with the help of MATLAB to get fitting Figure 6. Proportional coefficient curve obtained through fitting of currents. Figure 7. Contrast of experimental current value and vir- tual current value obtained through fitting. polynomials of phase A, B and C as equation (6). ()- 0.0025x+ 24.397 ()- 0.0025+ 24.4434 ()- 0.0027+ 24.2588 A B C x xx xx (6) Copyright © 2013 SciRes. EPE 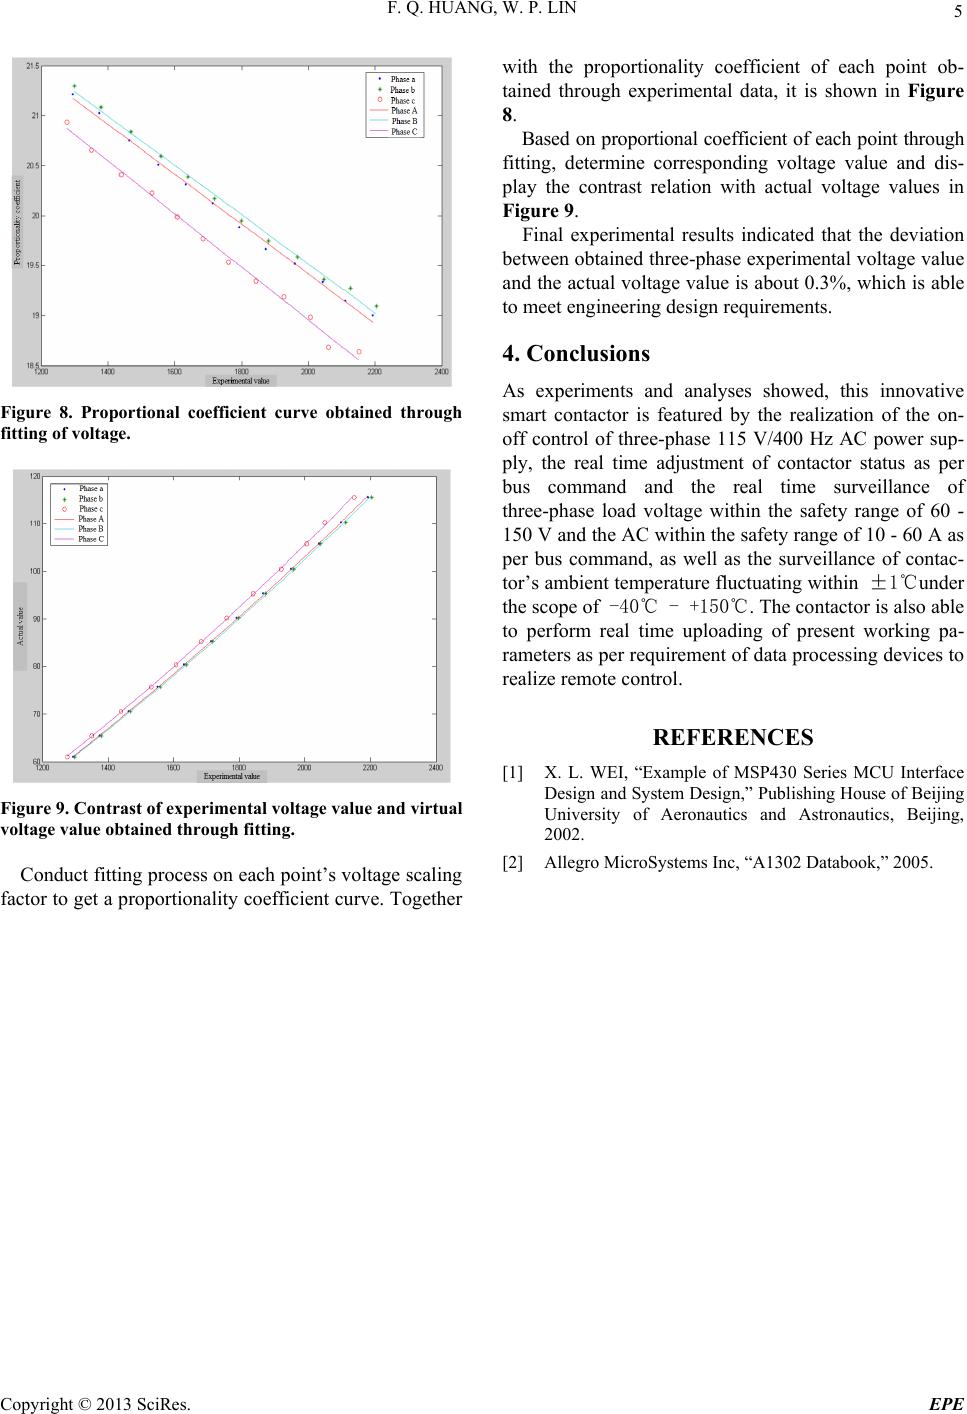 F. Q. HUANG, W. P. LIN 5 Figure 8. Proportional coefficient curve obtained through fitting of voltage. Figure 9. Contrast of experimental voltage value and virtual voltage value obtained through fitting. Conduct fitting process on each point’s voltage scaling factor to get a proportionality coefficient curve. Together with the proportionality coefficient of each point ob- tained through experimental data, it is shown in Figure 8. Based on proportional coefficient of each point through fitting, determine corresponding voltage value and dis- play the contrast relation with actual voltage values in Figure 9. Final experimental results indicated that the deviation between obtained three-phase experimental voltage value and the actual voltage value is about 0.3%, which is able to meet engineering design requirements. 4. Conclusions As experiments and analyses showed, this innovative smart contactor is featured by the realization of the on- off control of three-phase 115 V/400 Hz AC power sup- ply, the real time adjustment of contactor status as per bus command and the real time surveillance of three-phase load voltage within the safety range of 60 - 150 V and the AC within the safety range of 10 - 60 A as per bus command, as well as the surveillance of contac- tor’s ambient temperature fluctuating within ±1℃under the scope of -40℃ - +150℃. The contactor is also able to perform real time uploading of present working pa- rameters as per requirement of data processing devices to realize remote control. REFERENCES [1] X. L. WEI, “Example of MSP430 Series MCU Interface Design and System Design,” Publishing House of Beijing University of Aeronautics and Astronautics, Beijing, 2002. [2] Allegro MicroSystems Inc, “A1302 Databook,” 2005. Copyright © 2013 SciRes. EPE |