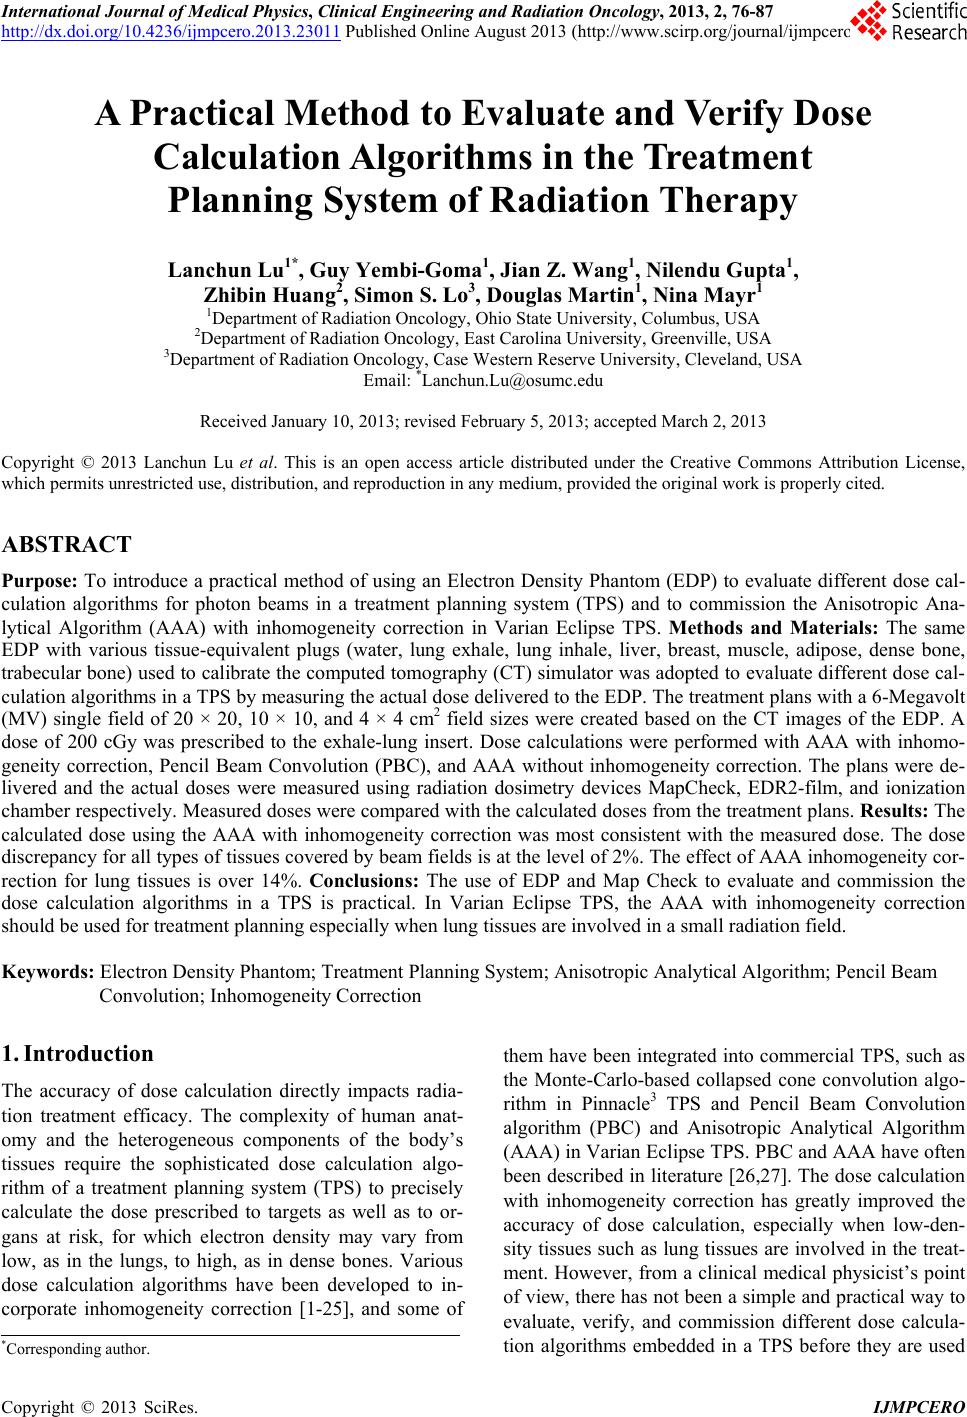
 International Journal of Medical Physics, Clinical Engineering and Radiation Oncology, 2013, 2, 76-87 http://dx.doi.org/10.4236/ijmpcero.2013.23011 Published Online August 2013 (http://www.scirp.org/journal/ijmpcero) A Practical Method to Evaluate and Verify Dose Calculation Algorithms in the Treatment Planning System of Radiation Therapy Lanchun Lu1*, Guy Yembi-Goma1, Jian Z. Wang1, Nilendu Gupta1, Zhibin Huang2, Simon S. Lo3, Douglas Martin1, Nina Mayr1 1Department of Radiation Oncology, Ohio State University, Columbus, USA 2Department of Radiation Oncology, East Carolina University, Greenville, USA 3Department of Radiation Oncology, Case Western Reserve University, Cleveland, USA Email: *Lanchun.Lu@osumc.edu Received January 10, 2013; revised February 5, 2013; accepted March 2, 2013 Copyright © 2013 Lanchun Lu et al. This is an open access article distributed under the Creative Commons Attribution License, which permits unrestricted use, distribution, and reproduction in any medium, provided the original work is properly cited. ABSTRACT Purpose: To introduce a practical method of using an Electron Density Phantom (EDP) to evaluate different dose cal- culation algorithms for photon beams in a treatment planning system (TPS) and to commission the Anisotropic Ana- lytical Algorithm (AAA) with inhomogeneity correction in Varian Eclipse TPS. Methods and Materials: The same EDP with various tissue-equivalent plugs (water, lung exhale, lung inhale, liver, breast, muscle, adipose, dense bone, trabecular bone) used to calibrate the computed tomography (CT) simulator was adopted to evaluate different dose cal- culation algorithms in a TPS by measuring the actual dose delivered to the EDP. The treatment plans with a 6-Megavolt (MV) single field of 20 × 20, 10 × 10, and 4 × 4 cm2 field sizes were created based on the CT images of the EDP. A dose of 200 cGy was prescribed to the exhale-lung insert. Dose calculations were performed with AAA with inhomo- geneity correction, Pencil Beam Convolution (PBC), and AAA without inhomogeneity correction. The plans were de- livered and the actual doses were measured using radiation dosimetry devices MapCheck, EDR2-film, and ionization chamber respectively. Measured doses were compared with the calculated doses from the treatment plans. Results: The calculated dose using the AAA with inhomogeneity correction was most consistent with the measured dose. The dose discrepancy for all types of tissues covered by beam fields is at the level of 2%. The effect of AAA inhomogeneity cor- rection for lung tissues is over 14%. Conclusions: The use of EDP and Map Check to evaluate and commission the dose calculation algorithms in a TPS is practical. In Varian Eclipse TPS, the AAA with inhomogeneity correction should be used for treatment planning especially when lung tissues are involved in a small radiation field. Keywords: Electron Density Phantom; Treatment Planning System; Anisotropic Analytical Algorithm; Pencil Beam Convolution; Inhomogeneity Correction 1. Introduction The accuracy of dose calculation directly impacts radia- tion treatment efficacy. The complexity of human anat- omy and the heterogeneous components of the body’s tissues require the sophisticated dose calculation algo- rithm of a treatment planning system (TPS) to precisely calculate the dose prescribed to targets as well as to or- gans at risk, for which electron density may vary from low, as in the lungs, to high, as in dense bones. Various dose calculation algorithms have been developed to in- corporate inhomogeneity correction [1-25], and some of them have been integrated into commercial TPS, such as the Monte-Carlo-based collapsed cone convolution algo- rithm in Pinnacle3 TPS and Pencil Beam Convolution algorithm (PBC) and Anisotropic Analytical Algorithm (AAA) in Varian Eclipse TPS. PBC and AAA have often been described in literature [26,27]. The dose calculation with inhomogeneity correction has greatly improved the accuracy of dose calculation, especially when low-den- sity tissues such as lung tissues are involved in the treat- ment. However, from a clinical medical physicist’s point of view, there has not been a simple and practical way to evaluate, verify, and commission different dose calcula- tion algorithms embedded in a TPS before they are used *Corresponding author. C opyright © 2013 SciRes. IJMPCERO 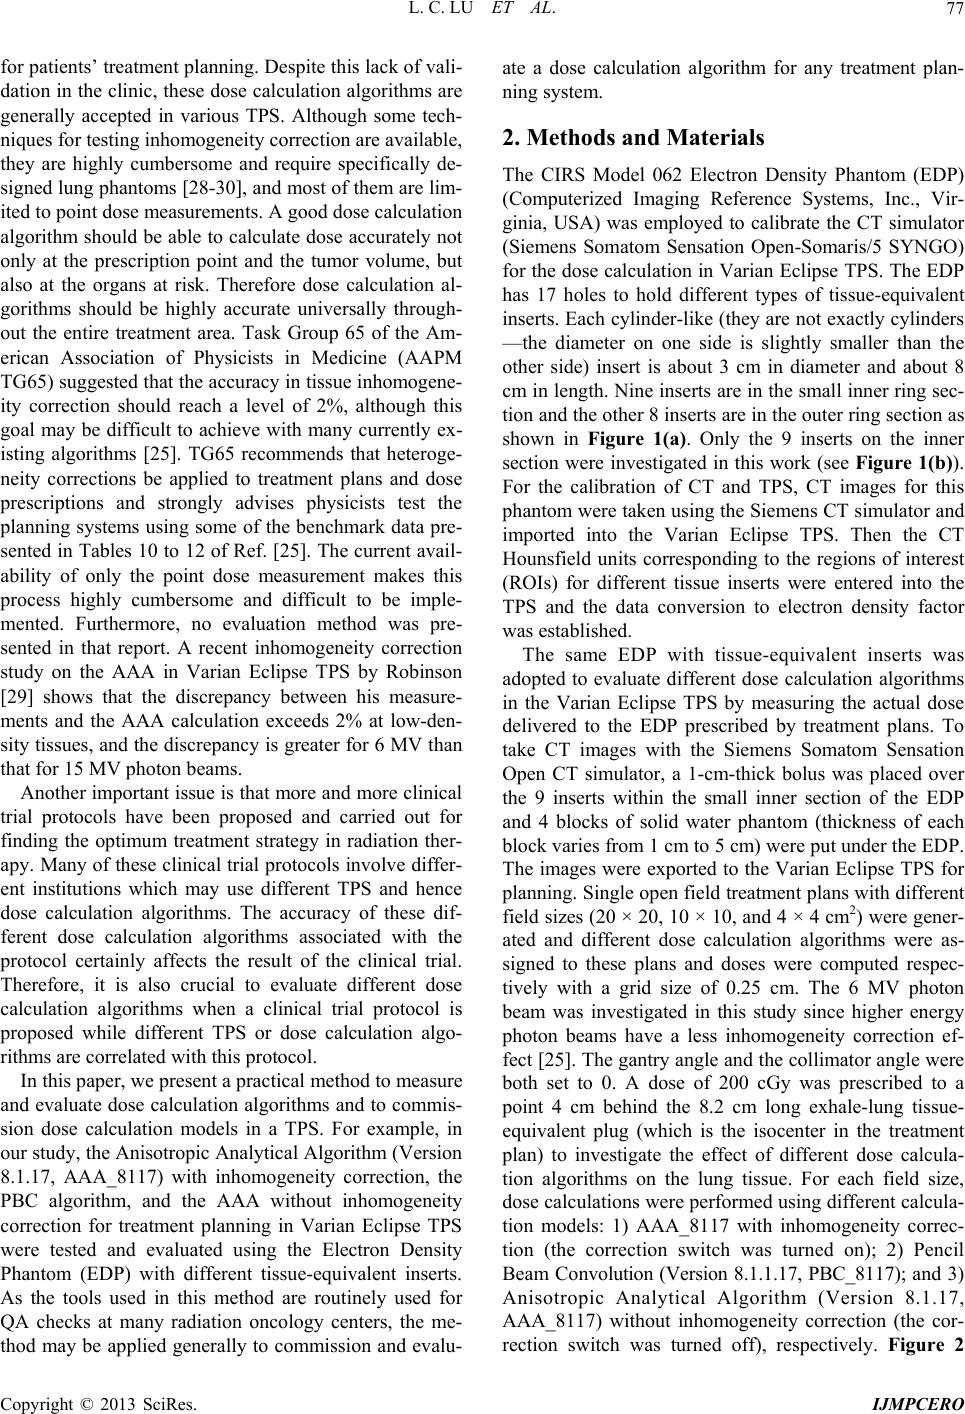 L. C. LU ET AL. 77 for patients’ treatment planning. Despite this lack of vali- dation in the clinic, these dose calculation algorithms are generally accepted in various TPS. Although some tech- niques for testing inhomogeneity correction are available, they are highly cumbersome and require specifically de- signed lung phantoms [28-30], and most of them are lim- ited to point dose measurements. A good dose calculation algorithm should be able to calculate dose accurately not only at the prescription point and the tumor volume, but also at the organs at risk. Therefore dose calculation al- gorithms should be highly accurate universally through- out the entire treatment area. Task Group 65 of the Am- erican Association of Physicists in Medicine (AAPM TG65) suggested that the accuracy in tissue inhomogene- ity correction should reach a level of 2%, although this goal may be difficult to achieve with many currently ex- isting algorithms [25]. TG65 recommends that heteroge- neity corrections be applied to treatment plans and dose prescriptions and strongly advises physicists test the planning systems using some of the benchmark data pre- sented in Tables 10 to 12 of Ref. [25]. The current avail- ability of only the point dose measurement makes this process highly cumbersome and difficult to be imple- mented. Furthermore, no evaluation method was pre- sented in that report. A recent inhomogeneity correction study on the AAA in Varian Eclipse TPS by Robinson [29] shows that the discrepancy between his measure- ments and the AAA calculation exceeds 2% at low-den- sity tissues, and the discrepancy is greater for 6 MV than that for 15 MV photon beams. Another important issue is that more and more clinical trial protocols have been proposed and carried out for finding the optimum treatment strategy in radiation ther- apy. Many of these clinical trial protocols involve differ- ent institutions which may use different TPS and hence dose calculation algorithms. The accuracy of these dif- ferent dose calculation algorithms associated with the protocol certainly affects the result of the clinical trial. Therefore, it is also crucial to evaluate different dose calculation algorithms when a clinical trial protocol is proposed while different TPS or dose calculation algo- rithms are correlated with this protocol. In this paper, we present a practical method to measure and evaluate dose calculation algorithms and to commis- sion dose calculation models in a TPS. For example, in our study, the Anisotropic Analytical Algorithm (Version 8.1.17, AAA_8117) with inhomogeneity correction, the PBC algorithm, and the AAA without inhomogeneity correction for treatment planning in Varian Eclipse TPS were tested and evaluated using the Electron Density Phantom (EDP) with different tissue-equivalent inserts. As the tools used in this method are routinely used for QA checks at many radiation oncology centers, the me- thod may be applied generally to commission and evalu- ate a dose calculation algorithm for any treatment plan- ning system. 2. Methods and Materials The CIRS Model 062 Electron Density Phantom (EDP) (Computerized Imaging Reference Systems, Inc., Vir- ginia, USA) was employed to calibrate the CT simulator (Siemens Somatom Sensation Open-Somaris/5 SYNGO) for the dose calculation in Varian Eclipse TPS. The EDP has 17 holes to hold different types of tissue-equivalent inserts. Each cylinder-like (they are not exactly cylinders —the diameter on one side is slightly smaller than the other side) insert is about 3 cm in diameter and about 8 cm in length. Nine inserts are in the small inner ring sec- tion and the other 8 inserts are in the outer ring section as shown in Figure 1(a). Only the 9 inserts on the inner section were investigated in this work (see Figure 1(b)). For the calibration of CT and TPS, CT images for this phantom were taken using the Siemens CT simulator and imported into the Varian Eclipse TPS. Then the CT Hounsfield units corresponding to the regions of interest (ROIs) for different tissue inserts were entered into the TPS and the data conversion to electron density factor was established. The same EDP with tissue-equivalent inserts was adopted to evaluate different dose calculation algorithms in the Varian Eclipse TPS by measuring the actual dose delivered to the EDP prescribed by treatment plans. To take CT images with the Siemens Somatom Sensation Open CT simulator, a 1-cm-thick bolus was placed over the 9 inserts within the small inner section of the EDP and 4 blocks of solid water phantom (thickness of each block varies from 1 cm to 5 cm) were put under the EDP. The images were exported to the Varian Eclipse TPS for planning. Single open field treatment plans with different field sizes (20 × 20, 10 × 10, and 4 × 4 cm2) were gener- ated and different dose calculation algorithms were as- signed to these plans and doses were computed respec- tively with a grid size of 0.25 cm. The 6 MV photon beam was investigated in this study since higher energy photon beams have a less inhomogeneity correction ef- fect [25]. The gantry angle and the collimator angle were both set to 0. A dose of 200 cGy was prescribed to a point 4 cm behind the 8.2 cm long exhale-lung tissue- equivalent plug (which is the isocenter in the treatment plan) to investigate the effect of different dose calcula- tion algorithms on the lung tissue. For each field size, dose calculations were performed using different calcula- tion models: 1) AAA_8117 with inhomogeneity correc- tion (the correction switch was turned on); 2) Pencil Beam Convolution (Version 8.1.1.17, PBC_8117); and 3) Anisotropic Analytical Algorithm (Version 8.1.17, AAA_8117) without inhomogeneity correction (the cor- ection switch was turned off), respectively. Figure 2 r Copyright © 2013 SciRes. IJMPCERO 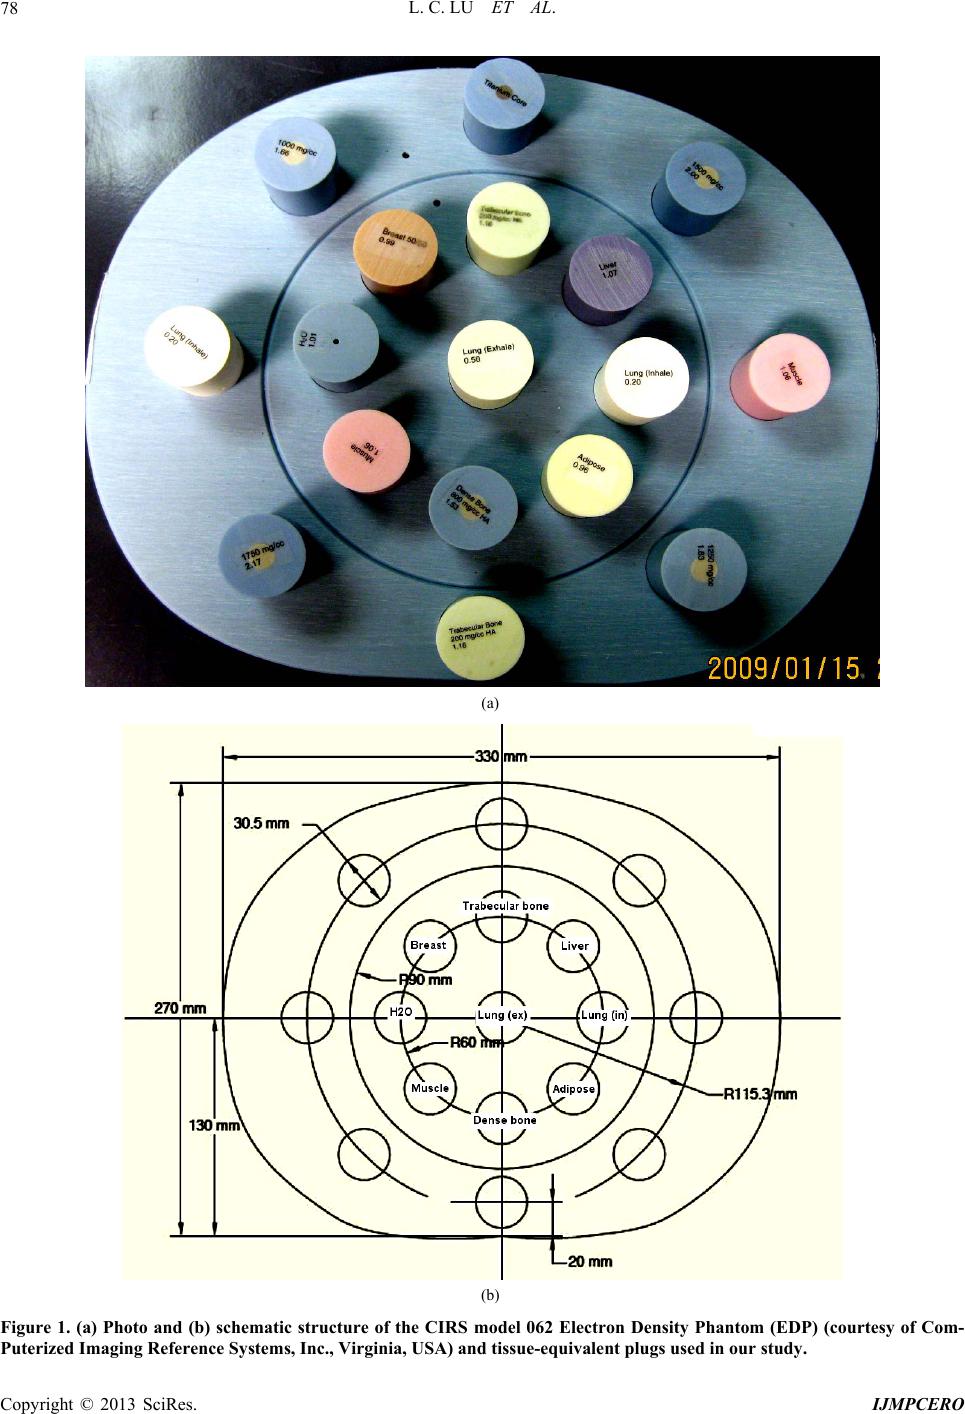 L. C. LU ET AL. Copyright © 2013 SciRes. IJMPCERO 78 (a) (b) Figure 1. (a) Photo and (b) schematic structure of the CIRS model 062 Electron Density Phantom (EDP) (courtesy of Com- Puterized Imaging Reference Systems, Inc., Virginia, USA) and tissue-equivalent plugs used in our study.  L. C. LU ET AL. 79 Figure 2. The treatment plan using the AAA inhomogeneity correction algorithm with the field size of 20 × 20 cm2. shows a treatment plan for the field size of 20 × 20 cm2 with AAA inhomogeneity correction algorithm for dose calculation. To measure the actual dose delivered to the prescription point, the individual plans were delivered to “treat” the EDP. The MUs delivered were defined by the related treatment plans. The dose at a defined plane was measured by MapCheck (Sun Nuclear Corporation Model 1175, software version 3.05.02, 445 diode detec- tors). The setup of MapCheck is shown in Figure 3. A 2 cm thick solid water phantom was placed on top of the MapCheck to measure the 2-D dose distribution at a depth of 4 cm below the EPD as shown in the bottom left plot of Figure 2 created from Varian Eclipse TPS. As the intrinsic depth from the surface of MapCheck to the de- tector plane (the physical thickness is 1.35 cm) is 2 cm water-equivalent thick, the depth to the measured 2-D dose plane (coronal) in solid water blocks is 4 cm with the isocenter in the detector plane. The source-axis dis- tance (SAD) setup was used in the measurement so that the inverse-square factor due to the difference between the physical thickness (1.35 cm) and the water-equivalent thickness (2 cm) does not need to be included. The MapCheck was calibrated by running a 10 × 10 cm2 6 MV beam with a known dose at 5 cm depth before it was used to measure the dose. We performed the measure- ments for all the field sizes mentioned above (20 × 20, 10 × 10, and 4 × 4 cm2) with different dose calculation mod- els, and compared the measured results with calculation Figure 3. The setup for MapCheck measurement. results from related treatment plans. Similar procedures but independent measurements were carried out using EDR-2 films with the RIT VXR-16 Dosimetry Vidar System. The setup is similar to Figure 3 but the Map- Check was replaced by an EDR-2 film placed at a depth of 4 cm in the solid water. We compared not only the measured dose with the calculated dose by different dose calculation algorithms, but also compared the results from MapCheck method with EDR-2 film method to make sure the results from these two methods were mu- tually consistent. To further verify our results, we also measured the 2-D dose distributions at a different depth (i.e. 3 cm) using the film method and compared the re- Copyright © 2013 SciRes. IJMPCERO 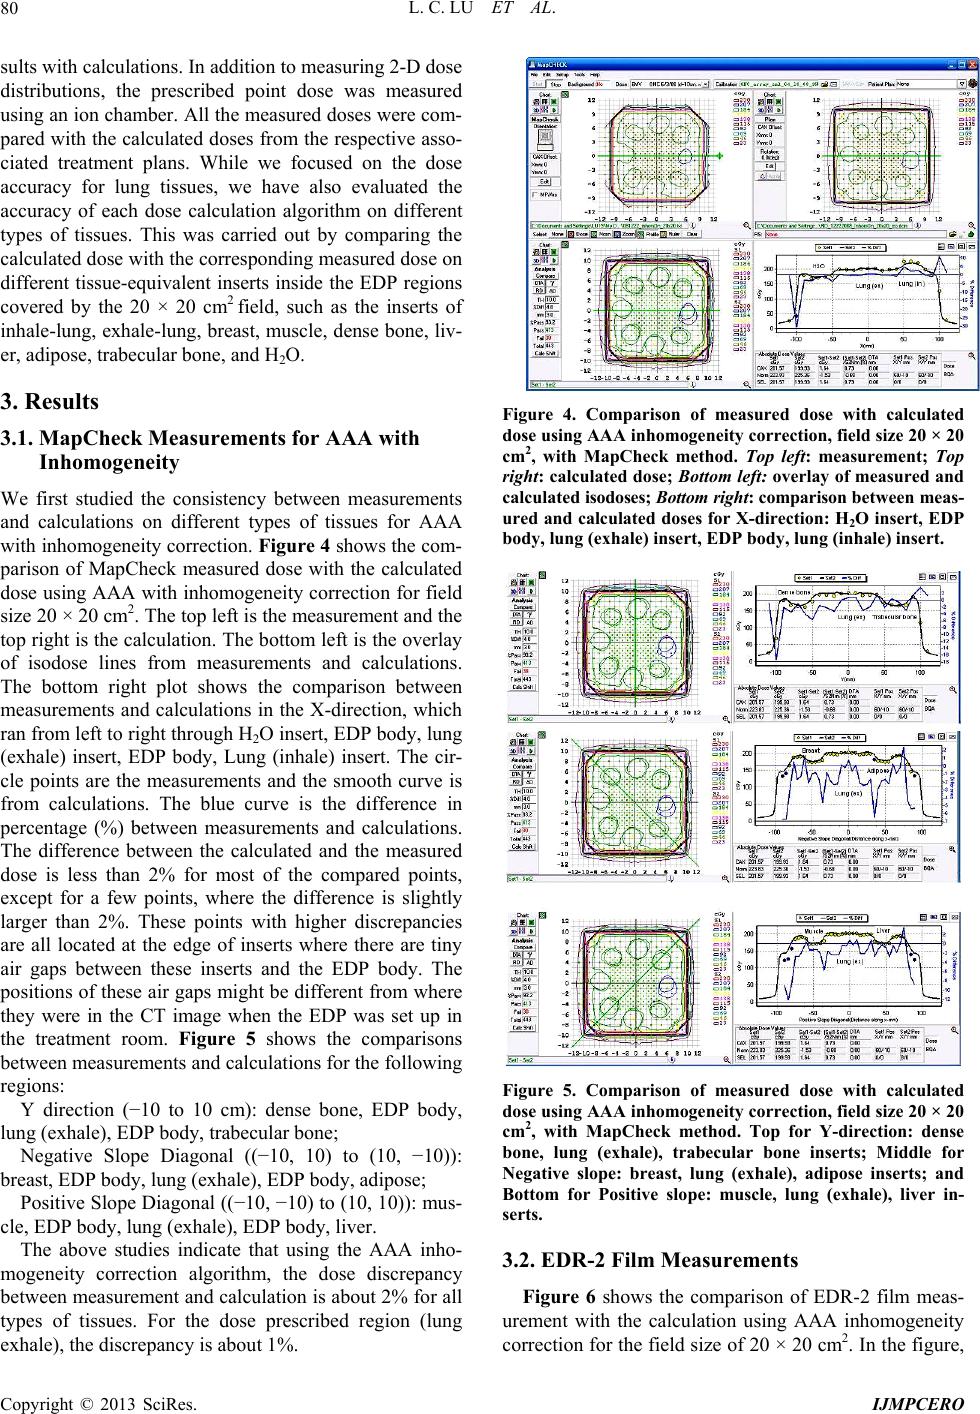 L. C. LU ET AL. 80 sults with calculations. In addition to measuring 2-D dose distributions, the prescribed point dose was measured using an ion chamber. All the measured doses were com- pared with the calculated doses from the respective asso- ciated treatment plans. While we focused on the dose accuracy for lung tissues, we have also evaluated the accuracy of each dose calculation algorithm on different types of tissues. This was carried out by comparing the calculated dose with the corresponding measured dose on different tissue-equivalent inserts inside the EDP regions covered by the 20 × 20 cm2 field, such as the inserts of inhale-lung, exhale-lung, breast, muscle, dense bone, liv- er, adipose, trabecular bone, and H2O. 3. Results 3.1. MapCheck Measurements for AAA with Inhomogeneity We first studied the consistency between measurements and calculations on different types of tissues for AAA with inhomogeneity correction. Figure 4 shows the com- parison of MapCheck measured dose with the calculated dose using AAA with inhomogeneity correction for field size 20 × 20 cm2. The top left is the measurement and the top right is the calculation. The bottom left is the overlay of isodose lines from measurements and calculations. The bottom right plot shows the comparison between measurements and calculations in the X-direction, which ran from left to right through H2O insert, EDP body, lung (exhale) insert, EDP body, Lung (inhale) insert. The cir- cle points are the measurements and the smooth curve is from calculations. The blue curve is the difference in percentage (%) between measurements and calculations. The difference between the calculated and the measured dose is less than 2% for most of the compared points, except for a few points, where the difference is slightly larger than 2%. These points with higher discrepancies are all located at the edge of inserts where there are tiny air gaps between these inserts and the EDP body. The positions of these air gaps might be different from where they were in the CT image when the EDP was set up in the treatment room. Figure 5 shows the comparisons between measurements and calculations for the following regions: Y direction (−10 to 10 cm): dense bone, EDP body, lung (exhale), EDP body, trabecular bone; Negative Slope Diagonal ((−10, 10) to (10, −10)): breast, EDP body, lung (exhale), EDP body, adipose; Positive Slope Diagonal ((−10, −10) to (10, 10)): mus- cle, EDP body, lung (exhale), EDP body, liver. The above studies indicate that using the AAA inho- mogeneity correction algorithm, the dose discrepancy between measurement and calculation is about 2% for all types of tissues. For the dose prescribed region (lung exhale), the discrepancy is about 1%. Figure 4. Comparison of measured dose with calculated dose using AAA inhomogeneity correction, field si ze 20 × 20 cm2, with MapCheck method. Top left: measurement; Top right: calculated dose; Bottom left: overlay of measured and calculated isodoses; Bottom right: comparison betwee n me a s - ured and calculated doses for X-direction: H 2O insert, EDP body, lung (exhale) inser t, EDP body, lung (inhale) insert. Figure 5. Comparison of measured dose with calculated dose using AAA inhomogeneity correction, field si ze 20 × 20 cm2, with MapCheck method. Top for Y-direction: dense bone, lung (exhale), trabecular bone inserts; Middle for Negative slope: breast, lung (exhale), adipose inserts; and Bottom for Positive slope: muscle, lung (exhale), liver in- serts. 3.2. EDR-2 Film Measurements Figure 6 shows the comparison of EDR-2 film meas- urement with the calculation using AAA inhomogeneity correction for the field size of 20 × 20 cm2. In the figure, Copyright © 2013 SciRes. IJMPCERO  L. C. LU ET AL. Copyright © 2013 SciRes. IJMPCERO 81 Figure 6. Comparison of measured dose with calculated dose of AAA inhomogeneity correction, field size 20 × 20 cm2 with EDR2-film method. Target: calculated dose from treatment plan; Reference: film measurement. Green curve for X-direction: H2O, lung (exhale), and lung (inhale) inserts; Red curve for Y-direction: trabecular bone, lung (exhale), and dense bone in- serts. “target image” is for the 2-D dose distribution from the treatment plan, and “reference image” is for the one from the film measurement. The 3-D gamma surface in Figure 6 represents the difference between measurement and dose calculation in the 3-D format. Similar to the Map- Check study, the large discrepancy between measure- ments and calculations again were at the edge of inserts —air gap. However, the overall discrepancy between measurements and calculations for all tissue plugs is still about 2%, which is consistent with the results from the MapCheck study. 3.3. Point Dose Measurement Table 1 gives the results of dose measurements at the prescribed dose point using an ion chamber (model: PTW TN30013, inner diameter 6.3 mm) and their com- parisons with calculated results from different dose cal- culation algorithms. The calculation from AAA without inhomogeneity correction underestimates the dose to lung-tissue by about 14%, and the discrepancy increases when field size decreases due to increasing deviation from nonequilibrium conditions and the ion chamber- induced perturbing level of disequilibrium for smaller field size. For the small field size 4 × 4 cm2, the AAA with inhomogeneity correction provides a more accurate result compared with the PBC calculation, although the difference is not significant for larger field sizes such as 10 × 10 and 20 × 20 cm2. 3.4. Comparison of AAA Inhomogeneity Correction, PBC Inhomogeneity Correction, and AAA without Inhomogeneity Correction The dose calculation accuracy within different tissues using the AAA with inhomogeneity correction was com- pared with 1) PBC and 2) AAA without inhomogeneity correction by evaluating the difference between meas- urements and calculations in X-direction, Y-direction, Negative-Slope diagonal direction, and Positive-Slope diagonal direction. Figures 7 and S1-S3 show those comparisons for these plans with field size 20 × 20 cm2 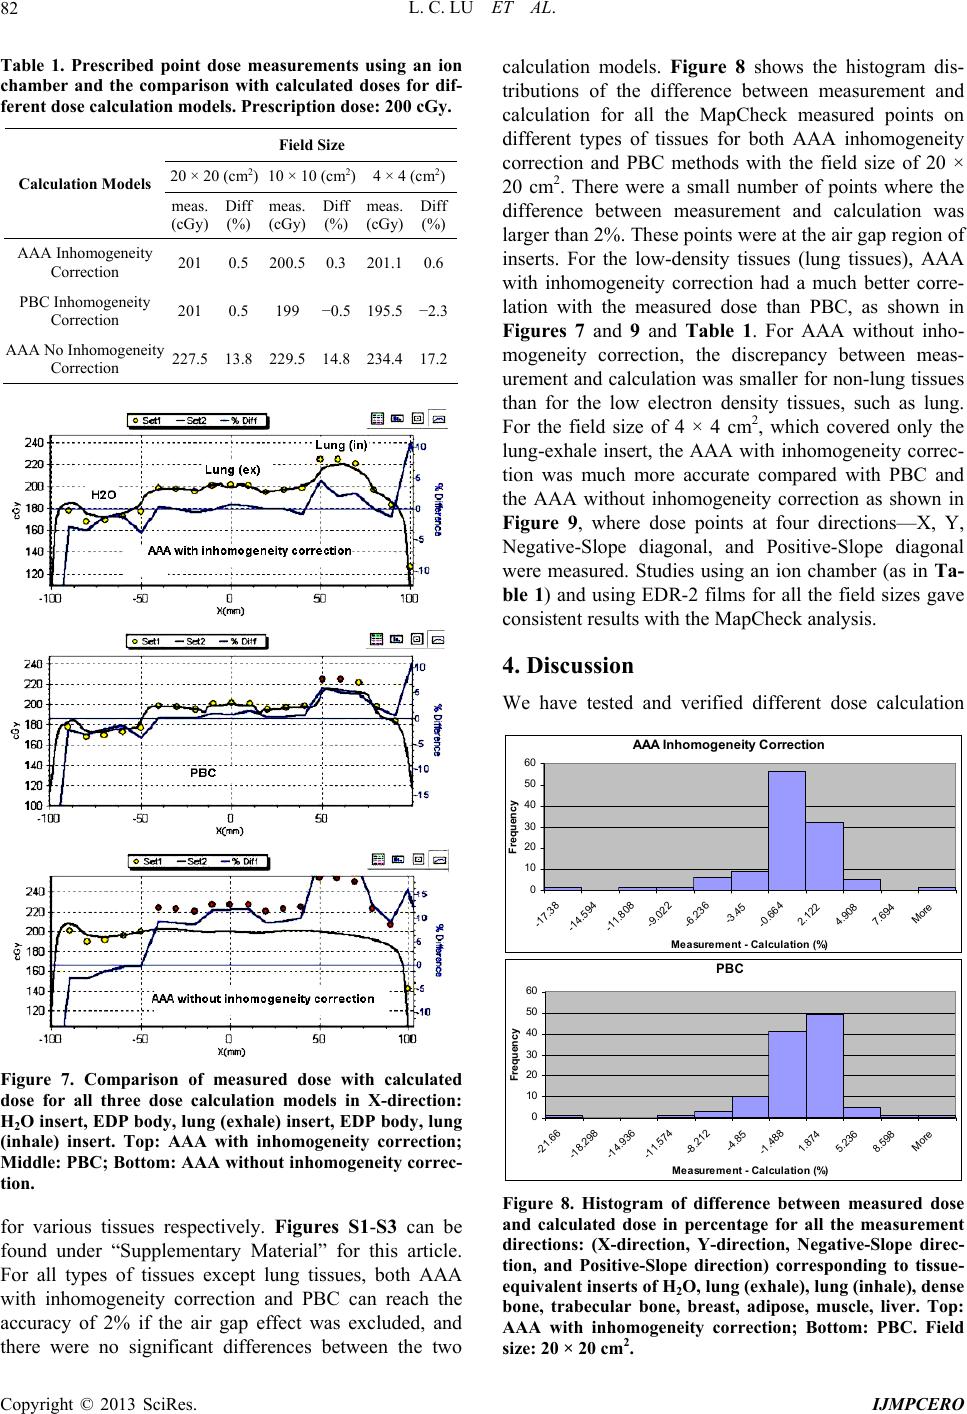 L. C. LU ET AL. 82 Table 1. Prescribed point dose measurements using an ion chamber and the comparison with calculated doses for dif- ferent dose calculation models. Prescription dose: 200 cGy. Field Size 20 × 20 (cm2) 10 × 10 (cm2) 4 × 4 (cm2) Calculation Models meas. (cGy) Diff (%) meas. (cGy) Diff (%) meas. (cGy) Diff (%) AAA Inhomogeneity Correction 201 0.5 200.5 0.3 201.1 0.6 PBC Inhomogeneity Correction 201 0.5 199 −0.5 195.5 −2.3 AAA No Inhomogeneity Correction 227.5 13.8 229.5 14.8 234.4 17.2 Figure 7. Comparison of measured dose with calculated dose for all three dose calculation models in X-direction: H2O insert, EDP body, lung (exhale) insert, EDP body, lung (inhale) insert. Top: AAA with inhomogeneity correction; Middle: PBC; Bottom: AAA without inhomogeneity correc- tion. for various tissues respectively. Figures S1-S3 can be found under “Supplementary Material” for this article. For all types of tissues except lung tissues, both AAA with inhomogeneity correction and PBC can reach the accuracy of 2% if the air gap effect was excluded, and there were no significant differences between the two calculation models. Figure 8 shows the histogram dis- tributions of the difference between measurement and calculation for all the MapCheck measured points on different types of tissues for both AAA inhomogeneity correction and PBC methods with the field size of 20 × 20 cm2. There were a small number of points where the difference between measurement and calculation was larger than 2%. These points were at the air gap region of inserts. For the low-density tissues (lung tissues), AAA with inhomogeneity correction had a much better corre- lation with the measured dose than PBC, as shown in Figures 7 and 9 and Table 1. For AAA without inho- mogeneity correction, the discrepancy between meas- urement and calculation was smaller for non-lung tissues than for the low electron density tissues, such as lung. For the field size of 4 × 4 cm2, which covered only the lung-exhale insert, the AAA with inhomogeneity correc- tion was much more accurate compared with PBC and the AAA without inhomogeneity correction as shown in Figure 9, where dose points at four directions—X, Y, Negative-Slope diagonal, and Positive-Slope diagonal were measured. Studies using an ion chamber (as in Ta- ble 1) and using EDR-2 films for all the field sizes gave consistent results with the MapCheck analysis. 4. Discussion We have tested and verified different dose calculation A AA I n hom ogenei ty Cor r ec t i on 0 10 20 30 40 50 60 -17.38 -14.594 -11.808 -9.022 -6.23 6 -3.45 -0.664 2.122 4.908 7.694 More Measurement - Calculation (%) Frequency PBC 0 10 20 30 40 50 60 -21.66 -18.298 -14.936 -11.574 -8.212 -4.85 -1.488 1.874 5.236 8.598 More Measurement - Calculation (%) Frequency Figure 8. Histogram of difference between measured dose and calculated dose in percentage for all the measurement directions: (X-direction, Y-direction, Negative-Slope direc- tion, and Positive-Slope direction) corresponding to tissue- equivalent inserts of H2O, lung (exhale), lung (inhale), dense bone, trabecular bone, breast, adipose, muscle, liver. Top: AAA with inhomogeneity correction; Bottom: PBC. Field 2 size: 20 × 20 cm. Copyright © 2013 SciRes. IJMPCERO 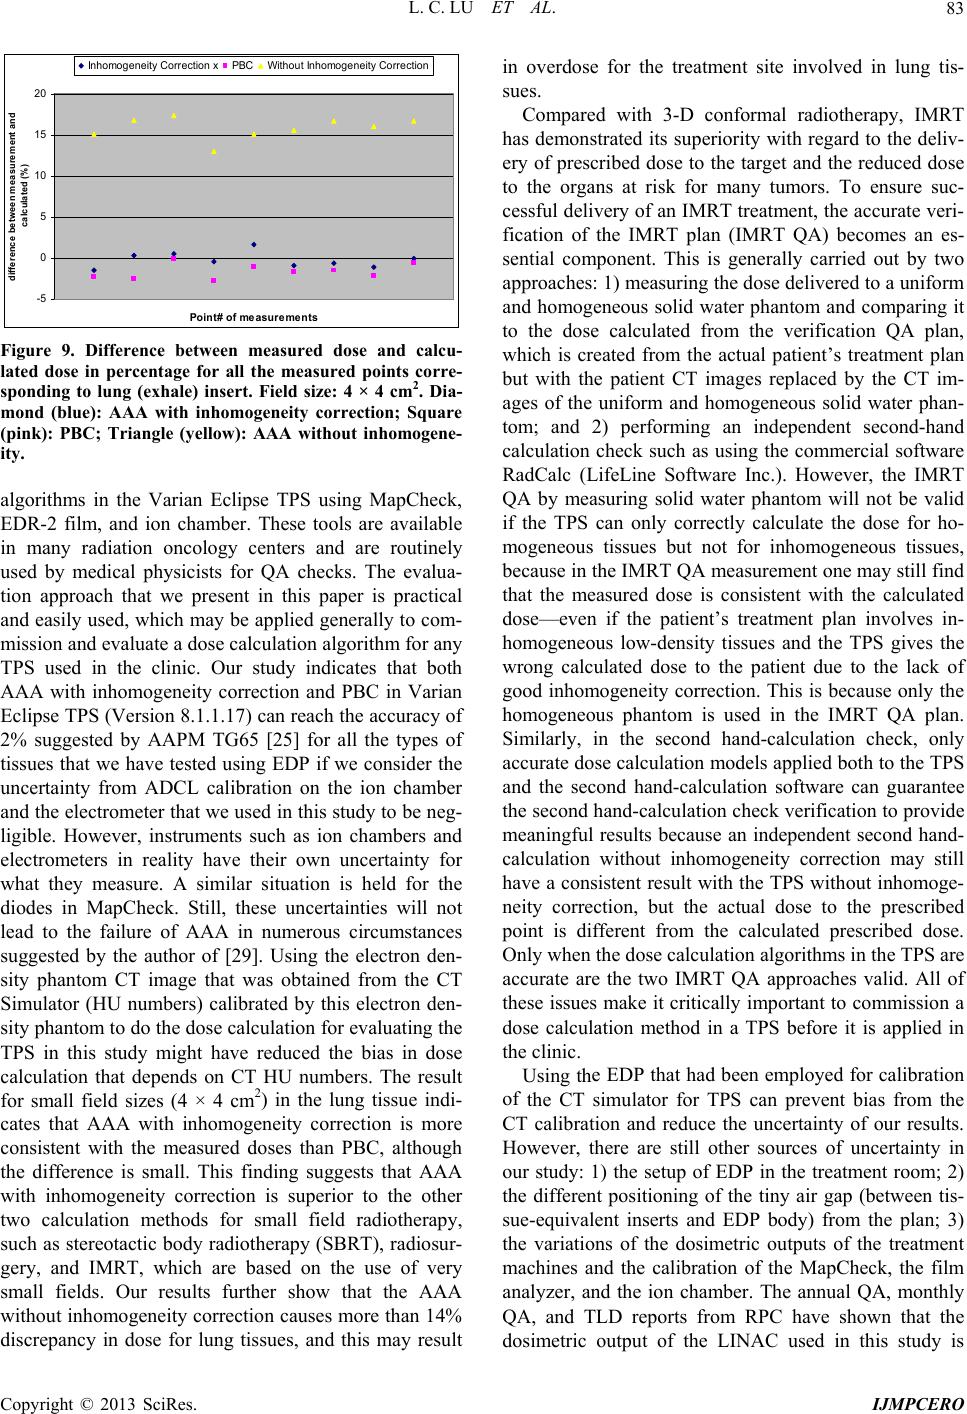 L. C. LU ET AL. 83 -5 0 5 10 15 20 Point# o f me asur ements difference between measurement and calculat ed ( %) Inhomogeneity Correction xPBC Without Inhomogeneity Correction Figure 9. Difference between measured dose and calcu lgorithms in the Varian Eclipse TPS using MapCheck, pared with 3-D conformal radiotherapy, IMRT ha e EDP that had been employed for calibration of - lated dose in percentage for all the measured points corre- sponding to lung (exhale) insert. Field size: 4 × 4 cm2. Dia- mond (blue): AAA with inhomogeneity correction; Square (pink): PBC; Triangle (yellow): AAA without inhomogene- ity. a EDR-2 film, and ion chamber. These tools are available in many radiation oncology centers and are routinely used by medical physicists for QA checks. The evalua- tion approach that we present in this paper is practical and easily used, which may be applied generally to com- mission and evaluate a dose calculation algorithm for any TPS used in the clinic. Our study indicates that both AAA with inhomogeneity correction and PBC in Varian Eclipse TPS (Version 8.1.1.17) can reach the accuracy of 2% suggested by AAPM TG65 [25] for all the types of tissues that we have tested using EDP if we consider the uncertainty from ADCL calibration on the ion chamber and the electrometer that we used in this study to be neg- ligible. However, instruments such as ion chambers and electrometers in reality have their own uncertainty for what they measure. A similar situation is held for the diodes in MapCheck. Still, these uncertainties will not lead to the failure of AAA in numerous circumstances suggested by the author of [29]. Using the electron den- sity phantom CT image that was obtained from the CT Simulator (HU numbers) calibrated by this electron den- sity phantom to do the dose calculation for evaluating the TPS in this study might have reduced the bias in dose calculation that depends on CT HU numbers. The result for small field sizes (4 × 4 cm2) in the lung tissue indi- cates that AAA with inhomogeneity correction is more consistent with the measured doses than PBC, although the difference is small. This finding suggests that AAA with inhomogeneity correction is superior to the other two calculation methods for small field radiotherapy, such as stereotactic body radiotherapy (SBRT), radiosur- gery, and IMRT, which are based on the use of very small fields. Our results further show that the AAA without inhomogeneity correction causes more than 14% discrepancy in dose for lung tissues, and this may result in overdose for the treatment site involved in lung tis- sues. Com s demonstrated its superiority with regard to the deliv- ery of prescribed dose to the target and the reduced dose to the organs at risk for many tumors. To ensure suc- cessful delivery of an IMRT treatment, the accurate veri- fication of the IMRT plan (IMRT QA) becomes an es- sential component. This is generally carried out by two approaches: 1) measuring the dose delivered to a uniform and homogeneous solid water phantom and comparing it to the dose calculated from the verification QA plan, which is created from the actual patient’s treatment plan but with the patient CT images replaced by the CT im- ages of the uniform and homogeneous solid water phan- tom; and 2) performing an independent second-hand calculation check such as using the commercial software RadCalc (LifeLine Software Inc.). However, the IMRT QA by measuring solid water phantom will not be valid if the TPS can only correctly calculate the dose for ho- mogeneous tissues but not for inhomogeneous tissues, because in the IMRT QA measurement one may still find that the measured dose is consistent with the calculated dose—even if the patient’s treatment plan involves in- homogeneous low-density tissues and the TPS gives the wrong calculated dose to the patient due to the lack of good inhomogeneity correction. This is because only the homogeneous phantom is used in the IMRT QA plan. Similarly, in the second hand-calculation check, only accurate dose calculation models applied both to the TPS and the second hand-calculation software can guarantee the second hand-calculation check verification to provide meaningful results because an independent second hand- calculation without inhomogeneity correction may still have a consistent result with the TPS without inhomoge- neity correction, but the actual dose to the prescribed point is different from the calculated prescribed dose. Only when the dose calculation algorithms in the TPS are accurate are the two IMRT QA approaches valid. All of these issues make it critically important to commission a dose calculation method in a TPS before it is applied in the clinic. Using th the CT simulator for TPS can prevent bias from the CT calibration and reduce the uncertainty of our results. However, there are still other sources of uncertainty in our study: 1) the setup of EDP in the treatment room; 2) the different positioning of the tiny air gap (between tis- sue-equivalent inserts and EDP body) from the plan; 3) the variations of the dosimetric outputs of the treatment machines and the calibration of the MapCheck, the film analyzer, and the ion chamber. The annual QA, monthly QA, and TLD reports from RPC have shown that the dosimetric output of the LINAC used in this study is Copyright © 2013 SciRes. IJMPCERO 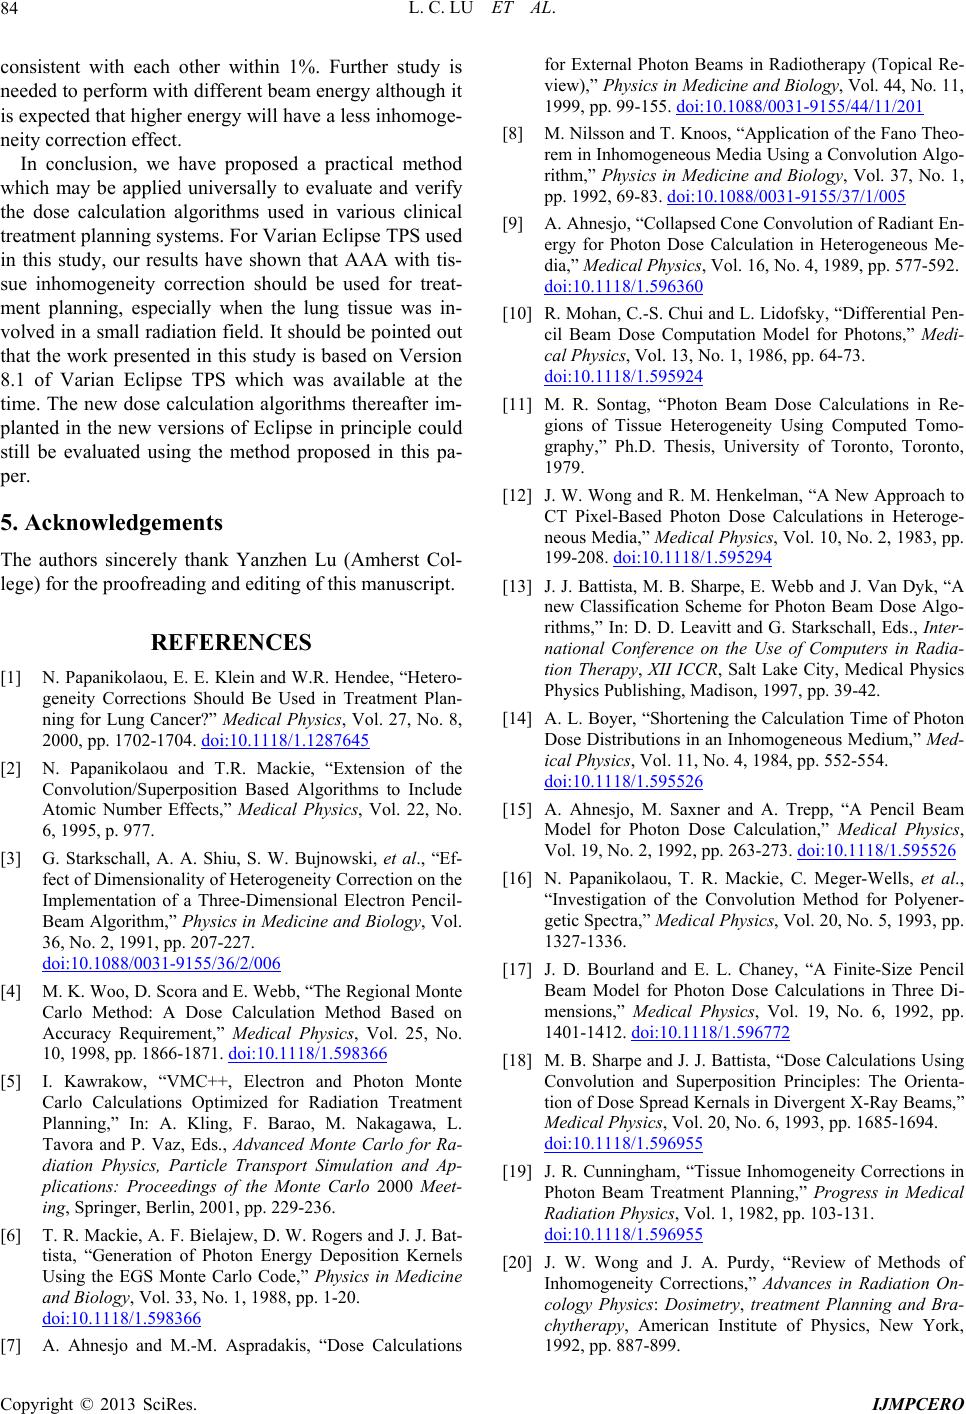 L. C. LU ET AL. 84 consistent with each other within 1%. Further study is needed to perform with different beam energy although it is expected that higher energy will have a less inhomoge- neity correction effect. In conclusion, we have proposed a practical m w 5. Acknowledgements Yanzhen Lu (Amherst Col- REFERENCES [1] N. Papanikola. Hendee, “Hetero- ethod hich may be applied universally to evaluate and verify the dose calculation algorithms used in various clinical treatment planning systems. For Varian Eclipse TPS used in this study, our results have shown that AAA with tis- sue inhomogeneity correction should be used for treat- ment planning, especially when the lung tissue was in- volved in a small radiation field. It should be pointed out that the work presented in this study is based on Version 8.1 of Varian Eclipse TPS which was available at the time. The new dose calculation algorithms thereafter im- planted in the new versions of Eclipse in principle could still be evaluated using the method proposed in this pa- per. The authors sincerely thank lege) for the proofreading and editing of this manuscript. ou, E. E. Klein and W.R geneity Corrections Should Be Used in Treatment Plan- ning for Lung Cancer?” Medical Physics, Vol. 27, No. 8, 2000, pp. 1702-1704. doi:10.1118/1.1287645 [2] N. Papanikolaou and T.R. Mackie, “Extension of the . A. Shiu, S. W. Bujnowski, et al., “Ef- 6 Convolution/Superposition Based Algorithms to Include Atomic Number Effects,” Medical Physics, Vol. 22, No. 6, 1995, p. 977. [3] G. Starkschall, A fect of Dimensionality of Heterogeneity Correction on the Implementation of a Three-Dimensional Electron Pencil- Beam Algorithm,” Physics in Medicine and Biology, Vol. 36, No. 2, 1991, pp. 207-227. doi:10.1088/0031-9155/36/2/00 , “The Regional Monte [4] M. K. Woo, D. Scora and E. Webb Carlo Method: A Dose Calculation Method Based on Accuracy Requirement,” Medical Physics, Vol. 25, No. 10, 1998, pp. 1866-1871. doi:10.1118/1.598366 [5] I. Kawrakow, “VMC++, Electron and Photon Monte rs and J. J. Bat- Carlo Calculations Optimized for Radiation Treatment Planning,” In: A. Kling, F. Barao, M. Nakagawa, L. Tavora and P. Vaz, Eds., Advanced Monte Carlo for Ra- diation Physics, Particle Transport Simulation and Ap- plications: Proceedings of the Monte Carlo 2000 Meet- ing, Springer, Berlin, 2001, pp. 229-236. [6] T. R. Mackie, A. F. Bielajew, D. W. Roge tista, “Generation of Photon Energy Deposition Kernels Using the EGS Monte Carlo Code,” Physics in Medicine and Biology, Vol. 33, No. 1, 1988, pp. 1-20. doi:10.1118/1.598366 [7] A. Ahnesjo and M.-M for External Photon Beams in Radiotherapy (Topical Re- view),” P hys ics in Medicine and Biology, Vol. 44, No. 11, 1999, pp. 99-155. doi:10.1088/0031-9155/44/11/201 [8] M. Nilsson and T. Knoos, “Application of the Fano Theo- rem in Inhomogeneous Media Using a Convolution Algo- rithm,” Physics in Medicine and Biology, Vol. 37, No. 1, pp. 1992, 69-83. doi:10.1088/0031-9155/37/1/005 [9] A. Ahnesjo, “Collapsed Cone Convolution of Radiant En- ergy for Photon Dose Calculation in Heterogeneous Me- dia,” Medical Physics, Vol. 16, No. 4, 1989, pp. 577-592. doi:10.1118/1.596360 [10] R. Mohan, C.-S. Chui and L. Lidofsky, “Differential Pen- cil Beam Dose Computation Model for Photons,” Medi- cal Physics, Vol. 13, No. 1, 1986, pp. 64-73. doi:10.1118/1.595924 [11] M. R. Sontag, “Photon Beam Dose Calculations in Re- ong and R. M. Henkelman, “A New Approach to gions of Tissue Heterogeneity Using Computed Tomo- graphy,” Ph.D. Thesis, University of Toronto, Toronto, 1979. [12] J. W. W CT Pixel-Based Photon Dose Calculations in Heteroge- neous Media,” Medical Physics, Vol. 10, No. 2, 1983, pp. 199-208. doi:10.1118/1.595294 [13] J. J. Battista, M. B. Sharpe, E. Webb and J. Van Dyk, “A of Photon new Classification Scheme for Photon Beam Dose Algo- rithms,” In: D. D. Leavitt and G. Starkschall, Eds., Inter- national Conference on the Use of Computers in Radia- tion Therapy, XII ICCR, Salt Lake City, Medical Physics Physics Publishing, Madison, 1997, pp. 39-42. [14] A. L. Boyer, “Shortening the Calculation Time Dose Distributions in an Inhomogeneous Medium,” Med- ical Physics, Vol. 11, No. 4, 1984, pp. 552-554. doi:10.1118/1.595526 [15] A. Ahnesjo, M. Saxner and A. Trepp, “A Pencil Beam Model for Photon Dose Calculation,” Medical Physics, Vol. 19, No. 2, 1992, pp. 263-273. doi:10.1118/1.595526 [16] N. Papanikolaou, T. R. Mackie, C. Meger-Wells, et al., nd and E. L. Chaney, “A Finite-Size Pencil “Investigation of the Convolution Method for Polyener- getic Spectra,” Medical Physics, Vol. 20, No. 5, 1993, pp. 1327-1336. [17] J. D. Bourla Beam Model for Photon Dose Calculations in Three Di- mensions,” Medical Physics, Vol. 19, No. 6, 1992, pp. 1401-1412. doi:10.1118/1.596772 [18] M. B. Sharpe and J. J. Battista, “Dose Calculations Using Convolution and Superposition Principles: The Orienta- tion of Dose Spread Kernals in Divergent X-Ray Beams,” Medical Physics, Vol. 20, No. 6, 1993, pp. 1685-1694. doi:10.1118/1.596955 [19] J. R. Cunningham, “Tissue Inhomogeneity Corrections in Photon Beam Treatment Planning,” Progress in Medical Radiation Physics, Vol. 1, 1982, pp. 103-131. doi:10.1118/1.596955 [20] J. W. Wong and J. A. Purdy, “Review of Methods of Inhomogeneity Corrections,” Advances in Radiation On- cology Physics: Dosimetry, treatment Planning and Bra- chytherapy, American Institute of Physics, New York, 1992, pp. 887-899. . Aspradakis, “Dose Calculations Copyright © 2013 SciRes. IJMPCERO 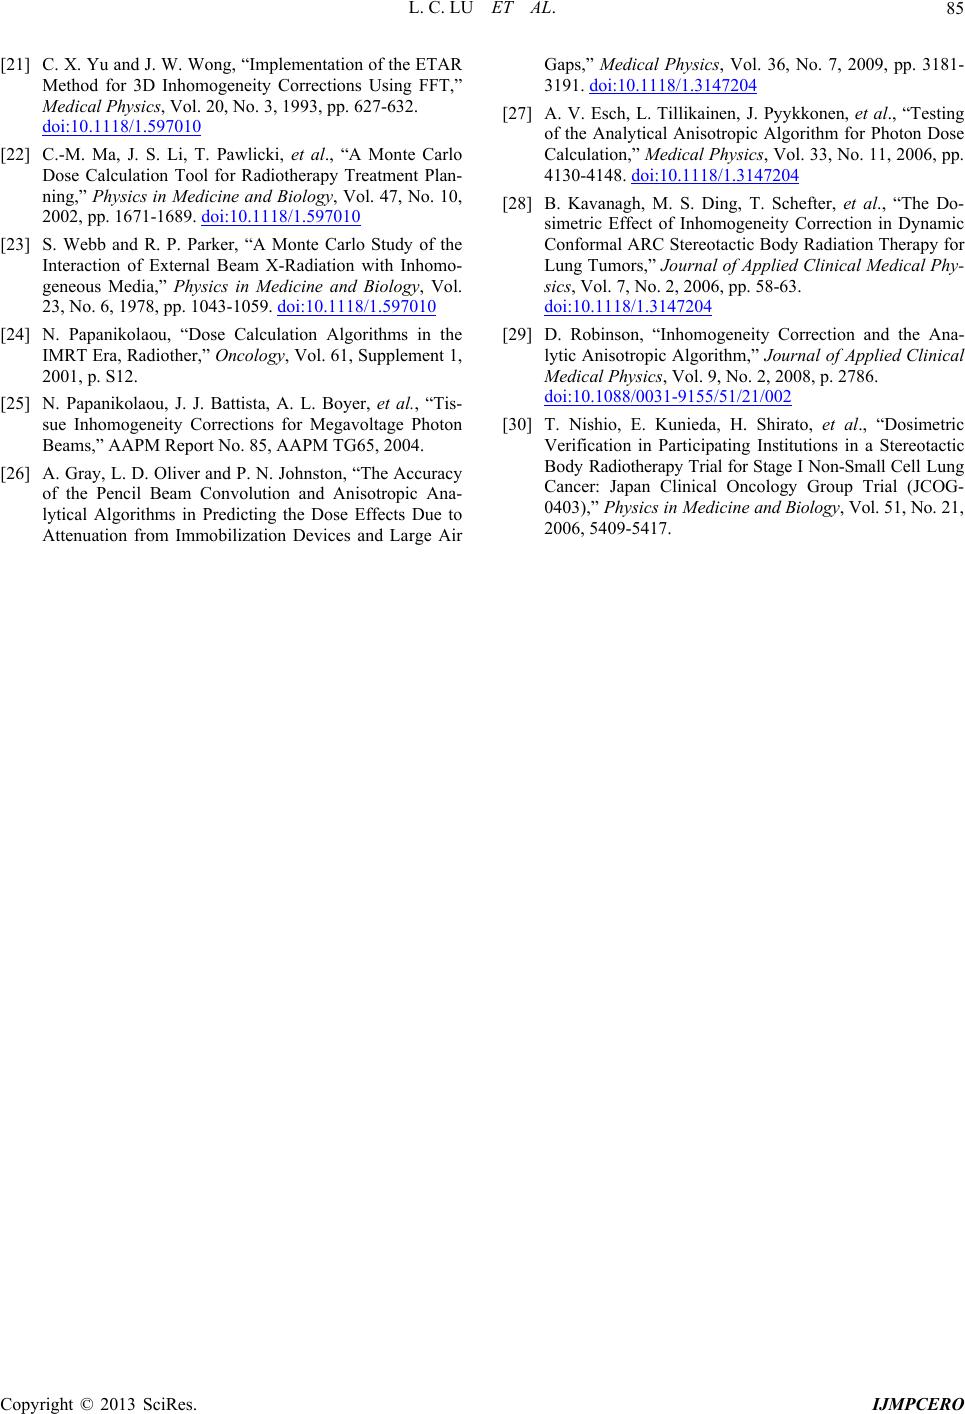 L. C. LU ET AL. Copyright © 2013 SciRes. IJMPCERO 85 Wong, “Implementation of the ETAR [21] C. X. Yu and J. W. Method for 3D Inhomogeneity Corrections Using FFT,” Medical Physics, Vol. 20, No. 3, 1993, pp. 627-632. doi:10.1118/1.597010 [22] C.-M. Ma, J. S. Li, T. Pawlicki, et al., “A Monte Carlo Dose Calculation Tool for Radiotherapy Treatment Plan- ning,” Physics in Medicine and Biology, Vol. 47, No. 10, 2002, pp. 1671-1689. doi:10.1118/1.597010 [23] S. Webb and R. P. Parker, “A Monte Carlo Study of the Interaction of External Beam X-Radiation with Inhomo- geneous Media,” Physics in Medicine and Biology, Vol. 23, No. 6, 1978, pp. 1043-1059. doi:10.1118/1.597010 [24] N. Papanikolaou, “Dose Calculation Algorithms in the ou, J. J. Battista, A. L. Boyer, et al., “Tis- cy IMRT Era, Radiother,” Oncology, Vol. 61, Supplement 1, 2001, p. S12. [25] N. Papanikola sue Inhomogeneity Corrections for Megavoltage Photon Beams,” AAPM Report No. 85, AAPM TG65, 2004. [26] A. Gray, L. D. Oliver and P. N. Johnston, “The Accura of the Pencil Beam Convolution and Anisotropic Ana- lytical Algorithms in Predicting the Dose Effects Due to Attenuation from Immobilization Devices and Large Air Gaps,” Medical Physics, Vol. 36, No. 7, 2009, pp. 3181- 3191. doi:10.1118/1.3147204 [27] A. V. Esch, L. Tillikainen, J. Pyykkonen, et al., “Testing of the Analytical Anisotropic Algorithm for Photon Dose Calculation,” Medical Physics, Vol. 33, No. 11, 2006, pp. 4130-4148. doi:10.1118/1.3147204 [28] B. Kavanagh, M. S. Ding, T. Schefter, et al., “The Do- simetric Effect of Inhomogeneity Correction in Dynamic Conformal ARC Stereotactic Body Radiation Therapy for Lung Tumors,” Journal of Applied Clinical Medical Phy- sics, Vol. 7, No. 2, 2006, pp. 58-63. doi:10.1118/1.3147204 [29] D. Robinson, “Inhomogeneity Correction and the Ana- lytic Anisotropic Algorithm,” Journal of Applied Clinical Medical Physics, Vol. 9, No. 2, 2008, p. 2786. doi:10.1088/0031-9155/51/21/002 [30] T. Nishio, E. Kunieda, H. Shirato, et al., “Dosimetric Verification in Participating Institutions in a Stereotactic Body Radiotherapy Trial for Stage I Non-Small Cell Lung Cancer: Japan Clinical Oncology Group Trial (JCOG- 0403),” Physi cs in M edi c ine and Biology , Vol. 51, No. 21, 2006, 5409-5417. 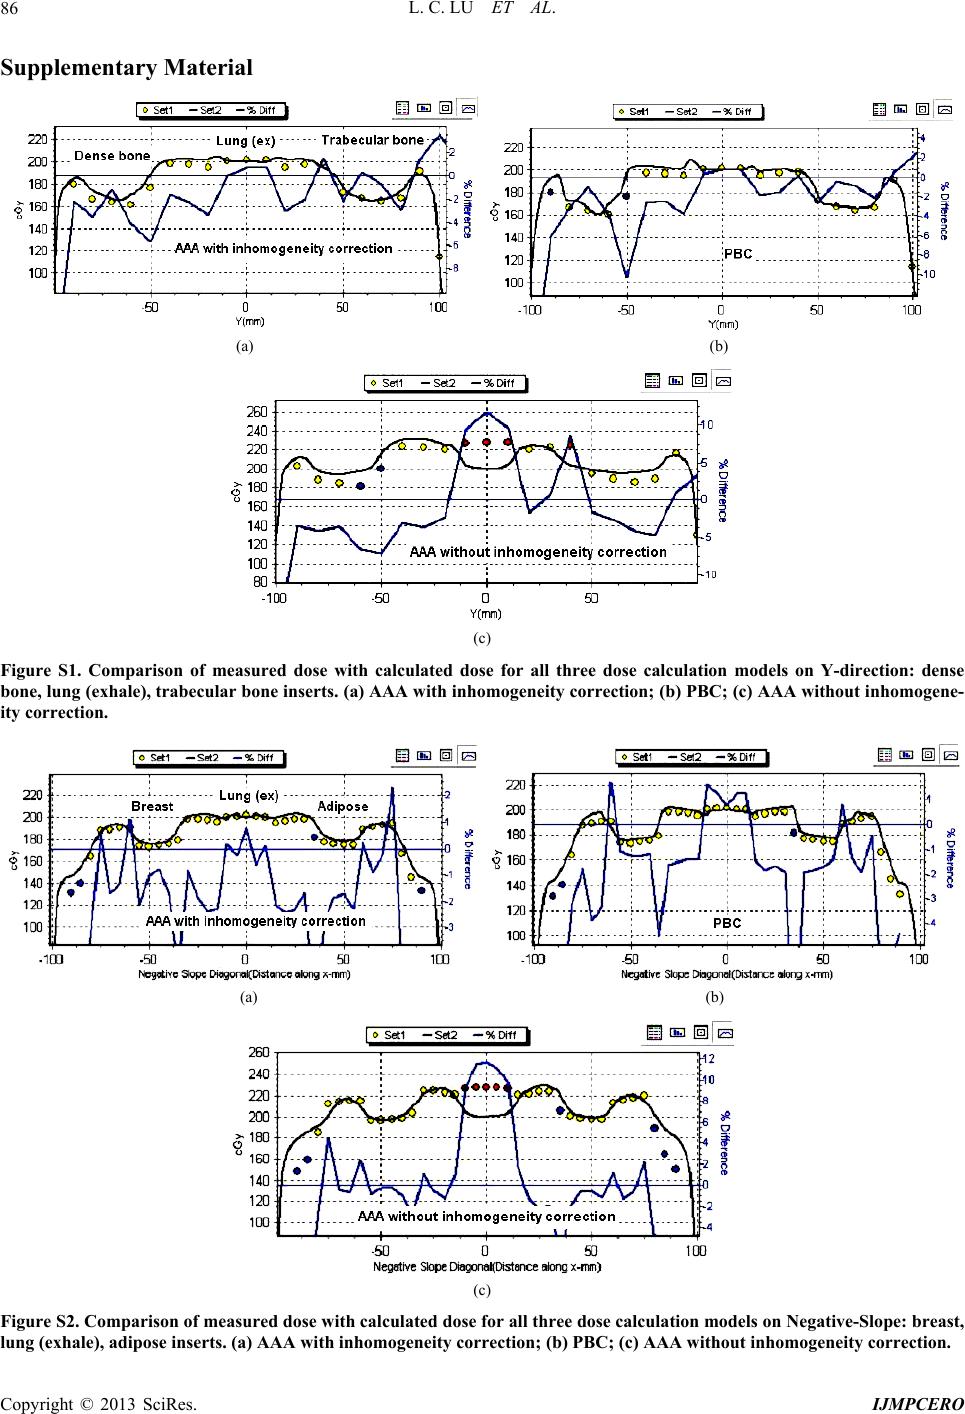 L. C. LU ET AL. 86 Supplementary Material (a) (b) (c) Figure S1. Comparison of measured dose with calculated dose for all three dose calculation models on Y-direction: dense bone, lung (exhale), trabecular bone inserts. (a) AAA with inhomogeneity correction; (b) PBC; (c) AAA without inhomogene- ity correction. (a) (b) (c) Figure S2. Comparison of measured dose with calculated dose for all three dose calculation models on Negative-Slope: breast, lung (exhale), adipose inserts. (a) AAA with inhomogeneity correction; (b) PBC; (c) AAA without inhomogeneity correction. Copyright © 2013 SciRes. IJMPCERO 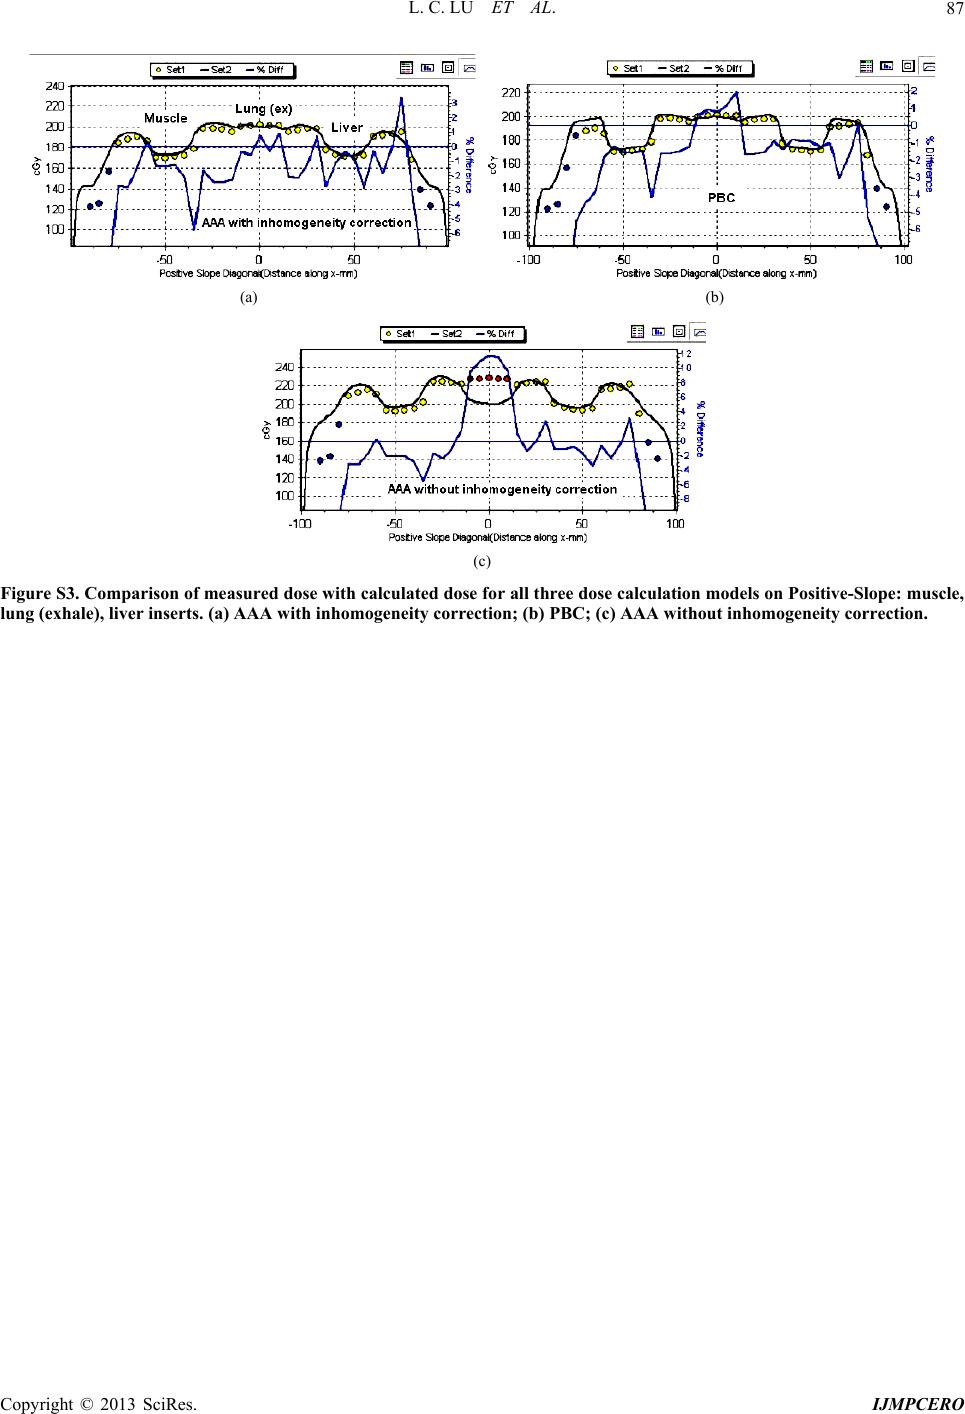 L. C. LU ET AL. 87 (a) (b) (c) Figure S3. Comparison of measured dose with calculated dose for all three dose calculation models on Positive-Slope: muscle, lung (exhale), liver inserts. (a) AAA with inhomogeneity correction; (b) PBC; (c) AAA without inhomogeneity correction. Copyright © 2013 SciRes. IJMPCERO
|