Advances in Nanoparticles, 2013, 2, 280-286
http://dx.doi.org/10.4236/anp.2013.23038 Published Online August 2013 (http://www.scirp.org/journal/anp)
Nanoparticles of Palladium, Platinum and Silver:
Incoporation into Perfluoro-Sulfonated Membrane
MF-4SK and Ionic Nafion
Alexandra Revina*, Sergey Busev, Anatoly Kalinitchev, Michail Kuznetsov,
Ardalion Ponomarev, Marina Lebedeva
Institute of Physical Chemistry and Electrochemistry, RAS, Moscow, Russia
Email: *Alex_revina@mail.ru
Received December 28, 2012; revised February 2, 2013; accepted February 10, 2013
Copyright © 2013 Alexandra Revina et al. This is an open access article distributed under the Creative Commons Attribution License,
which permits unrestricted use, distribution, and reproduction in any medium, provided the original work is properly cited.
ABSTRACT
The purpose of the investigation is the study of the physico-chemical properties and electro-catalytic characteristics of
the Nafion and MF-4SK membranes with the author’s nanoparticles (A. Revina, 2008) incorporated into the perfluoro-
sulphonated cationic membranes. An important advance in the creation of new nano-composite materials with poly-
functional activity is the inclusion of nanoparticles of various metals (Pd, Pt, Ag) in these membranes. Polymer ion ex-
change membranes represent widely applicable materials in various areas of modern nanotechnologies. The obtained
nanocomposites on the base of included nanoparticles have the perspective properties and polyfunctional activity for the
applications.
Keywords: UV-VIS Spectrophotometry; AFM; CVA-Measurements; Palladium Nanoparticles; Platinum Nanoparticles;
Silver Nanoparticles; Perfluoro-Sulfonated Membranes; Nafion; MF-4SK Membrane
1. Introduction
Proton conductive sulpho-cationite type membranes “Na-
fion” (USA, Dupont Co) together with the Russian analo-
gies (MF-4SK membranes) are often used for fuel cells
operating at ambient temperature, and besides in addition
for the electrochemical investigations of catalysis.
In recent years, while solar energy, geothermal energy,
wind energy and fusion power technology have attracted
much attention there is also the increasing interest for the
very efficient hydrogen utilization in the generation of
electrical energy. Among the different competing fuel
technologies, polymer electrolyte cells have the most
attractive advantages. The development of “Nafion” (Nf)
membranes by DuPont and the exact structure of the per-
fluorinated ionomers have been intensively investigated.
However, the morphology of Nf and its unique properties
have not yet been clearly identified [1]. The article by
Sahu et al. [2] presents an overview of Nf membranes
highlighting their merits and demerits with an emphasis
on the modified Nf membranes. Hydrated Nf clusters
may be used as a reactive vessel (or template) for other
materials such as metals. Yan-Li et al. [3] reported that
Pt NanoParticles (NPs) without the carbon support could
be prepared by an alcohol method by using an anionic Pt
complex. In particular, Pt NPs are of great interest be-
cause of their excellent catalytic activity. Their catalytic
activity depends on the size distribution and morphology
of the particles and, therefore, synthesis of the stable Pt
NPs with the possibility of the size control could be de-
terminative for these applications in membranes intended
for the fuel cells.
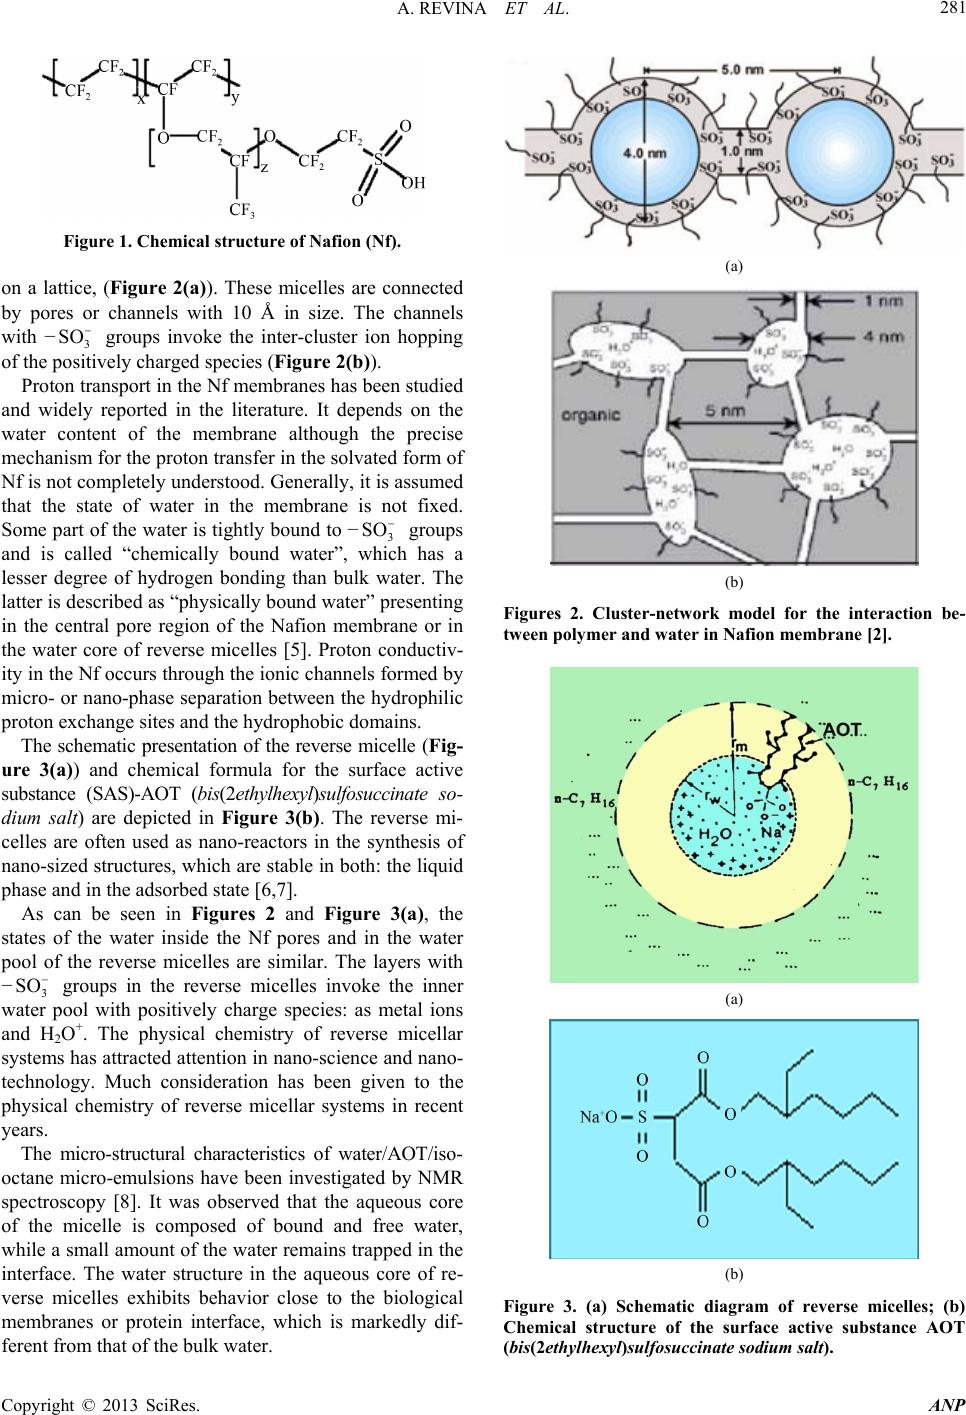
Nafion is produced by the co-polymerization of vari-
able amounts of unsaturated perfluoro-alkylsulfonylfluo-
ride with tetrafluoro-ethylene. The chemical structure of
the Nf is depicted at Figure 1. The quantitative charac-
teristic: Equivalent weight (Ew) is calculated by the
grams of the dry Nf per mole of sulfonic acid groups
with the assumption that the material is in the acid form.
These membranes and the analogous Russian MF-4SK
membranes [4] are widely used in Polymer Electrolyte
Fuel Cells (PEFCs) due to their high proton conductivity
and moderate swelling in water. Nafion has clusters
(about ~40 Å) of sulfonate-ended perfluoralkyl ether
groups organized as reverse (inverted) micelles arranged
*Corresponding author.
C
opyright © 2013 SciRes. ANP
A. REVINA ET AL. 281
Figure 1. Chemical structure of Nafion (Nf).
on a lattice, (Figur e 2(a)). These micelles are connected
by pores or channels with 10 Å in size. The channels
with 3 groups invoke the inter-cluster ion hopping
of the positively charged species (Figure 2(b)).
SO
Proton transport in the Nf membranes has been studied
and widely reported in the literature. It depends on the
water content of the membrane although the precise
mechanism for the proton transfer in the solvated form of
Nf is not completely understood. Generally, it is assumed
that the state of water in the membrane is not fixed.
Some part of the water is tightly bound to 3
SO
groups
and is called “chemically bound water”, which has a
lesser degree of hydrogen bonding than bulk water. The
latter is described as “physically bound water” presenting
in the central pore region of the Nafion membrane or in
the water core of reverse micelles [5]. Proton conductiv-
ity in the Nf occurs through the ionic channels formed by
micro- or nano-phase separation between the hydrophilic
proton exchange sites and the hydrophobic domains.
The schematic presentation of the reverse micelle (Fig-
ure 3(a)) and chemical formula for the surface active
substance (SAS)-AOT (bis(2ethylhexyl)sulfosuccinate so-
dium salt) are depicted in Figure 3(b). The reverse mi-
celles are often used as nano-reactors in the synthesis of
nano-sized structures, which are stable in both: the liquid
phase and in the adsorbed state [6,7].
As can be seen in Figures 2 and Figure 3(a), the
states of the water inside the Nf pores and in the water
pool of the reverse micelles are similar. The layers with
3
SO groups in the reverse micelles invoke the inner
water pool with positively charge species: as metal ions
and H2O+. The physical chemistry of reverse micellar
systems has attracted attention in nano-science and nano-
technology. Much consideration has been given to the
physical chemistry of reverse micellar systems in recent
years.
The micro-structural characteristics of water/AOT/iso-
octane micro-emulsions have been investigated by NMR
spectroscopy [8]. It was observed that the aqueous core
of the micelle is composed of bound and free water,
while a small amount of the water remains trapped in the
interface. The water structure in the aqueous core of re-
verse micelles exhibits behavior close to the biological
membranes or protein interface, which is markedly dif-
ferent from that of the bulk water.
(a)
(b)
Figures 2. Cluster-network model for the interaction be-
tween polymer and water in Nafion membrane [2].
(a)
(b)
Figure 3. (a) Schematic diagram of reverse micelles; (b)
Chemical structure of the surface active substance AOT
(bis(2ethylhexyl)sulfosuccinate sodium salt).
Copyright © 2013 SciRes. ANP
A. REVINA ET AL.
Copyright © 2013 SciRes. ANP
282
“Hitachi” U-3310 spectrophotometer (Japan). Analyses
of the NPs adsorption spectra were completed for the
initial micellar solutions and for the same solution after
contact with the samples of the polymer membrane MF-
4SK (or Nf) or by interaction of the NPs with MF-4SK
(or Nf) in the micellar solutions for different times. It
was established by atomic force microscopy (AFM) that
the size of NPs (Z-size) from the micellar solutions was
in the range of 1 - 10 nm depending on ω0 with the doses
(5 - 15 kGy) of γ-irradiation carried out with a RKhM_γ-
20 setup.
On the basis of the volt-ampere data the conclusion
was made, that the electro-conductivity of the reverse
micellar system does not depend on the applied voltage
and is reduced by electrolysis. It was shown by PMR that
the water proton chemical shift depends both on the wa-
ter and electrolyte concentration in the reverse micelles
water pools. In addition, it is changed by electrolysis.
The hypothesis was suggested that the mechanism of the
RMS electric conductivity is represented by an electron-
hole approach where the scattering of lattice defects is
defined by the force of the hydrogen bonds in the micelle
pool [9]. The electro catalytic activity and the electrode stability
were measured by cyclic voltammetry (CVA) with using
of the device IPC-PRO M (Technopribor, Russia).
2. Experimental
There are described the experimental preparations of
the metal-ion exchanger nanocomposites by adsorption
of the Pd NPs, Pt NPs and Ag NPs dispersed in the in-
versed micelle solution on the surface, and in the pores of
the perfluor-sulfonated cationic MF-4SK or Nf mem-
branes. The properties of the obtained nanocomposites
and metal NPs in the membranes and in the Nf films are
analyzed by the various methods: OAS, AFM and CVA.
The obtained results are presented below.
2.1. Materials
In this study, we report a similar synthetic route for Ag,
Pd and Pt NPs with different shapes and sizes by using
reverse micelles as nano-reactors for the formation of
NPs and control of their concentration due to adsorption
because of the contact with the polymer perfluoro-sul-
fonated cationic MF-4SK membrane and ionic Nf. Stable
Pd, (or Ag) NPs in the liquid phase were obtained by the
radiation-chemical reduction of Рd2+ (or Ag+) ions in the
reverse micellar system: Н2О/АОT (0.15 mol·L1)/iso-
octane with different solubilization coefficients-ω accord-
ing to the technique described earlier [6,7]. In all ex-
periments below the solubilization coefficient (ω) is de-
termined by the relation: ω = [H2O]/[AOT].
3. Results and Discussion
The adsorption for the metal nanoparticles and the intro-
duction of these nanoparticles inside the polymer matrix
were observed via optical adsorption spectra (OAS, Fig-
ures 4 and 5).
The OAS of the Pd nanoparticles (NPs) in the micellar
solution with ω = 5.0 are shown on Figure 4(a) (1—ini-
tial spectrum). The micellar solutions of the Pd NPs
(with ω = 5.0) have two adsorption maxima at 225 nm
and 280 nm (Figure 4(a), curves 1-3).
2.2. Apparatus
The optical adsorption spectra (OAS) of reverse micellar
solutions, containing metallic NPs were recorded in the
190 - 800 nm range with a quartz cell (l = 1 mm) using a
(a) Pd NPs (b) Pd NPs + membrane samples
Figure 4. (a) Evolution of OAS (190 - 500 nm) for Рd NP solution (ω = 5.0) after contact with MF-4SK membrane: 1—initial
moment (0 min); 2—after 30 min; 3—after 60 min; 4—after 120 min and (b) OAS (190 - 500 nm) for different MF-4SK mem-
brane samples: 1—initial membrane; 2—membrane after 2 days, contact with АОТ/isooctane solution (without Pd NP); 3—
membrane after 2 days contact with solution Pd NP (ω = 3.0); 4—membrane after 2 days contact with solution Рd NP (ω =
5.0). t0 = 20˚C.
A. REVINA ET AL. 283
(a) Ag NPs (b) Ag NPs + membrane samples
Figure 5. (a) Evolution of OAS (190 - 800 nm) for Ag NPs (ω = 8.0) solution (without dilution) after contact with MF-4SK
membrane: 1—initial moment (0 min), 2—15 min, 3—30 min, 4—90 min, 5—220 min, 6—255 min, 7—24 hours, 8—after 48
hours and (b) OAS (190 - 600 nm) for different MF-4SK membrane samples + RadChem Ag NPs, ω = 8.0). 1—initial mem-
brane, 2—membrane + NPs (without dilution), 3—membrane + NPs (dilution 1:1), 4—membrane + NPs (dilution 1:2).
The colorless MF-4SK membrane, which was immersed
in these solutions becomes coloured, due to the sorption
of the Pd NPs into/on the membrane. The initial OAS of
the colorless membrane is presented on Figure 4(b) (curve
1). The membrane got an adsorption maximum at 280
nm after 26 hours of the contact with solution (Figure
4(b), curves 3, 4). The evolution of the optical adsorption
spectra (OAS, 190 - 500 nm) for the Рd NPs solution
after contact with the MF-4SK membrane for the various
time periods is shown in Figure 4(a). It was found that
the metal Рd NPs may be introduced into the polymeric
matrix MF-4SK practically completely (Figure 4(a) ,
curve 4). Meanwhile the corresponding OAS of the col-
ored membrane samples is depicted in Figure 4(b)
(curves 3, 4). Comparison of the curves 3 and 4 (Figure
4(b)) shows that the maxima of the adsorption bands for
these two curves are proportional to the ω = 3.0 (curve 3);
5.0 (curve 4) values.
The optical adsorption spectra for the Ag NPs solu-
tions with the solubilization degree ω = 8.0 are repre-
sented in Figure 5(a).
The initial micellar solutions of Ag NPs (ω = 8.0)
without dilution (Figure 5(a), curve 1) and with different
amounts of dilution (1:1, 1:2 by inert solvent-isooctane;
not shown here) have a band with the same wide adsorp-
tion maximum at 430 nm. The band with this maximum
(curve 1 without dilution) disappears after contact with
MF-4SK membrane after 15 minutes. It should be ex-
plained by the transformation of the Ag NPs in the solu-
tion into the NPs of smaller sizes. This is the reason for
the peak shift and its subsequent narrowing (Figure 5(a),
transfer from peak 1 to the next ones). The newly formed
band with the sharp adsorption maximum at 390 nm
(Figure 5(a), curves 2-6) diminishes gradually and com-
pletely disappears after 24 hours (curve 7).
It follows from these data that contact the membranes
with the NPs micellar solution leads to the fast size de-
creasing (during 15 min) of the Ag NPs.
In principle some conclusions concerning the sorption
kinetic properties of the MF-4SK membrane (Figure 5(a))
may be done. For the short period Ag NPs (430 nm) are
transformed into another nanoparticles (λ = 390 nm).
Then concentrations of these NPs are decreased due to
the adsorption without changing of maximum of the OAS.
The comparison of the OAS of the initial MF-4SK
membrane (Figure 5(b), curve 1) with the OAS of the
different film samples (Figure 5(b), curves 2-4) shows
that the intensity of the spectra depends on the nanoparti-
cle content in the solution.
The AFM data (Figures 6 and 7) show the changes of
properties of Pd NPs which occur during their adsorption
on the MF-4SK membranes.
The AFM data for the Pd NPs from the initial solution
before is shown in Figure 6. The corresponding changes
of the nanoparticles in the solution after contact with the
membrane are shown in Figure 7.
Figure 7(b) shows the small fragment of the image of
Figure 7(a). Figure 7(d) represents the corresponding
z-size (relief) recorded along the ticks indicated in Fig-
ure 7(b). Figure 7(c) represents the Pd NPs size distri-
bution (surface topography) from solution obtained by
AFM method.
The comparison of Figures 6 (before adsorption) with
Figures 7 (after adsorption) indicates the size increase
Copyright © 2013 SciRes. ANP
A. REVINA ET AL.
284
(a)
(b)
Figure 6. АFM data for initial Pd NPs solution with ω = 5.0
before adsorption: (a) AFM image and (b) AFM surface
topography of Pd NPs from solution.
and the agglomeration of the Pd NPs after contact of the
solution with the membrane surface. This fact may be
explained by the deformation of the Pd NPs which pro-
motes the Pd NPs agglomeration.
The results obtained by using scanning electron mi-
croscopy (SEM, Figure 8) indicate surface adsorption
and incorporation of the metal Pt NPs and Pd NPs inside
the polymer matrix of the metal-polymer Nf films.
The optical absorption spectra (OAS) of solutions with
the solid membrane Nf in the absence and in the presence
of Pt (and Pd) NPs are shown in Figure 9(a) (and Figure
9(b)) [10].
The Pt NPs have a pronounced plasmon absorption
band in the range 200 - 400 nm with maxima at 230 - 270
nm. Its intensity increases with the increase of Pt content
(Figure 9(a)). The content of the Pt NPs depends on the
solubilization coefficient value (ω).
Figure 9(b) shows the OAS for Pd NPs: 1—initial Pd
solution; 2—in micellar solution; 3—in Nf film; 4—ini-
tial Nf film. The comparison of curves 2 and 3 leads to
the conclusions about the changes in sizes, shape of the
Pd NPs. It follows that the sizes of Pd NPs are smaller in
the Nf film than in the primary solution.
The functional activity of the nanocomposites: Pt
NPs/Nf (a), Pd NPs/Nf (b) was confirmed by the results
of the electro-cathalytical investigations [10].
Figure 10 shows CVA for the metal-polymer nano-
composites: Pt NPs/Nf (a) and Pd NPs/Nf (b). It is seen
that at [Pt]-concentration of ~0.02 mg/sm2 (a), the char-
(a) (b) (c) (d)
Figure 7. АFM data for Pd NPs from solution with ω = 5.0 after adsorption.
(a) (b)
Figure 8. SEM images of the Pt (a) and Pd (b) NPs on the surface of the Nf at ω = 1.5.
Copyright © 2013 SciRes. ANP
A. REVINA ET AL. 285
(a) (b)
Figure 9. (a) OAS for Pt NPs. Nf solutions and films with Pt NPs; 1—Nf film without Pt; 2—Nf with Pt NPs at ω = 1.5; 3—Nf
with Pt NPs at ω = 3.0 and (b) OAS for Pd NPs. Nf solutions and films with: 1—initial Pd solution at ω = 1.5; 2—Nf solution
with Pd NPs; 3—Nf film with Pd NPs; 4—initial Nf film without Pd.
(a) (b)
Figure 10. CVA of metal-polymer nanocomposites: Pt NPs/Nf (a), Pd NPs/Nf (b); (а) Pt, 0.02 mg/sm2 solutions, ω = 1.5
(dashed curve 1); to Pt, 0.19 mg/sm2 with ω = 5.0 (solid curve 2) and (b) Pd, 0.04 mg/sm2 solutions, ω = 1.5 (dashed curve 1) to
Pd 0.19 mg/sm2 with ω = 5.0 (solid curve 2).
acteristic peaks related to adsorption/desorption of hy-
drogen (0 - 0.3 V) and oxygen (>0.6 V) are poorly ex-
pressed (Figure 10). This is probably due to the rela-
tively low [Pt]-concentration in the investigated samples.
At the [Pd]-concentration of 0.19 mg/sm2 (b) the CVA is
typical for Pd peaks of the adsorption/desorption of hy-
drogen and the area of restoration for molecular oxygen
(0.6 - 0.9V). The same dependence was shown for Pt/Nf
(a), i.e. increase of [Pt] NPs concentration leads to the
appearance of the characteristic adsorption/desorption
oxygen peaks.
4. Conclusions
The results of the investigations demonstrate the possi-
bility of modification of the both: Nf polymer film and
MF-4SK membranes by various metal NPs: Pt, Pd and
Ag NPs obtained on the basis of the original author’s
methods produced in the reverse micelles as microreactor
[7].
It was estimated the changes of the NPs size distribu-
tions in the Nf membranes in dependence of the solubili-
zation parameter (ω) of the NPs-micellar solution sys-
tem.
It was found by using the cyclic voltamperometry
(CVA) method that the obtained metal-polymer nano-
composites Pt NPs/Nf and Pd NPs/Nf possess high cata-
lytic activity in the anodic oxidation reaction of hydrogen
and the cathodic reaction of oxygen reduction in the
membrane-electrode blocks of energy sources.
The Pt NPs and Pd NPs with the modified MF-4SK
polymer film appear to be promising electrolytes for Poly-
mer Electrolyte Fuel Cells.
REFERENCES
[1] K. A. Mauritz and R. E. Moore, “State of Understanding
of Nafion,” Chemical Reviews, Vol. 104, No. 10, 2004,
pp. 4535-4586. doi:10.1021/cr0207123
[2] A. K. Sahu, S. Pitchumani, P. Sridhar and A. K. Shukla,
“Nafion and Modified-Nafion Membranes for Polymer
Electrolyte Fuel Cells: An Overview,” Bulletin of Materi-
Copyright © 2013 SciRes. ANP
A. REVINA ET AL.
286
als Science, Vol. 32, No. 3, 2009, pp. 285-294.
doi:10.1007/s12034-009-0042-8
[3] Y. L. Cao, X. L. Ding, H. C. Li, Z. G. Yi, X. F. Wang, J.
J. Zhu and C. X. Kan, “Morphology-Controllable Noble
Metal Nanoparticles: Synthesis, Optical Property and
Growth Mechanism,” Acta Physico-chimica Sinica, Vol.
27, No. 6, 2011, pp. 1273-1286.
[4] Yu. A. Dobrovolskii, A. V. Pisareva, L. S. Leonova and
A. I. Karelin, “New Proton-Conducting Membrane for
Fuel Cell and Gas Sensors,” Alternative Energy and Ecol-
ogy, Vol. 12, No. 20, 2004, pp. 36-38.
[5] T. K. Jain, M. Varshney and A. Maitra, “Structural Stud-
ies of Aerosol OT Reverse Micellar Agregates by FT-IR
Spectroscopy,” Journal of Physical Chemistry, Vol. 93,
No. 21, 1989, pp. 7409-7416. doi:10.1021/j100358a032
[6] A. G. Dokuchaev, T. G. Myasoedova and A. A. Revina,
“The Studying of Different Factors Effect on the Silver
Aggregation Under γ-Radiation in the Reverse Micelle,”
Chim. Vysokich Energii, Vol. 31, No. 5, 1997, pp. 353-
357.
[7] A. A. Revina, “Specimen of the nanostructural Metal
Particles and the Method for Its Preparation,” RF Patent
No 2322327, 2008.
[8] T. K. Jain, M. Varshney and A. Maitra, “Determination of
Size Parameters of Water-Aerosol OT-Oil Reverse Mi-
celles from their Nuclear Magnetic Resonance Data,”
Journal of Physical Chemistry, Vol. 88, No. 21, 1984, pp.
5122-5125. doi:10.1021/j150665a064
[9] D. A. Tanasjuk, V. V. Zeitlin, A. A. Revina and V. I. Er-
makov, “Electroconductivity and Electrolysis in Reverse
Micelles,” 2012.
[10] N. A. Yashtulov, A. N. Bolshakova, A. A. Revina and V.
R. Flid, “Metall-Polymer Nanocomposites Based on
Platinum Nanoparticles for Chemical Fuel Cells,” Rus-
sian Chemical Bulletin, Vol. 60, No. 8, 2011, pp. 1-5.
doi:10.1007/s11172-011-0235-3
Copyright © 2013 SciRes. ANP