Engineering, 2013, 5, 1-5
doi:10.4236/eng.2013.55B001 Published Online May 2013 (http://www.scirp.org/journal/eng)
Comparison of ANN and SVM to Identify Children
Handwriting Difficulties
Anith Adibah Hasseim, Rubita Sudirman, Puspa Inayat Khalid, Narges Tabatabaey-Mashadi
Faculty of Electrical Engineering, Universiti Teknologi Malaysia, Johor Bahru, Johor, Malaysia
Email: rubita@fke.utm.my
Received 2013
ABSTRACT
This paper compares two classification methods to determine pupils who have difficulties in writing. Classification ex-
periments are made with neural network and support vector machine method separately. The samples are divided into
two groups of writers, below average printers (test group) and above average printers (control group) are applied. The
aim of this paper is to demonstrate that neural network and support vector machine can be successfully used in classi-
fying pupils with or without handwriting difficulties. Our results showed that support vector machine classifier yield
slightly better percentage than neural network classifier and it has a much stable result.
Keywords: Neural Network; Support Vector Machine; Handwriting Difficulties
1. Introduction
Handwriting is the primary form of written expression
for young elementary school students. Handwriting has
long been an effective means to record information,
transmit message and project feelings [1] for communi-
cation among people. There is evidence to indicate that at
least 10% - 30% of children who have difficulty with
handwriting and need to be resolved with the right inter-
vention [2]. Most of the studies that involve in handwrit-
ing movement only focused on children with known psy-
chological or physical problem. Yet, not all problems can
be categorized as clear cut disease and condition [3].
Various softwares have been presented for handwriting
recognition and movement analysis, but softwares di-
rectly related to child handwriting analysis with the pro-
spective of screening children in general, and addressing
difficulties are rare and the research is in its early stage.
The development of children’s writing ability is im-
portant in building self-esteem among children. For ex-
ample, in 1998 Graham and Weintraub reported that stu-
dents with poor handwriting needed twice as much time
to copy a written passage as those with good handwriting
[4]. Hence, difficulty in writing for young student can
lead to a dislike of writing, frustration with writing, and
development of a negative mind-set about writing ability.
As a result, this will truly limit their further writing de-
velopment and subsequently retarded to academic suc-
cess. Therefore, early analysis of those children will
benefit the educational system in order to provide an in-
structional handwriting program suited to their strengths
and weaknesses. It is evident that educators and mental
health experts are in need of empirically-based assess-
ment and intervention procedures to help identify and
treat children with writing disorders.
1.1. Evaluation of Handwriting Difficulties
Several studies have been done to evaluate early writing
skill in primary grade. These research findings were in-
vestigated and describes in term of legibility and speed,
see [4,5]. However, the scarcity of valid and reliable
handwriting evaluation tools, the complexity in the scor-
ing tools and the long processing time by the evaluator
who needs to judge the writing product for each of the
legibility criteria, limit the application of standardized
assessments in the evaluation of handwriting difficulties
in clinical and classroom setting [2]. In addition, in most
of the mild cases, the symptoms of handwriting difficulty
are present but normally are not recognised by the teach-
ers or certified evaluators.
In this paper we describe experiments carried out us-
ing two classification methods in classifying children
with and without handwriting problem based on drawing
tasks. In contrast with similar method known by Khalid
in [6] and other related studies [7,8] we tested each dif-
ferent feature individually and describe experiments car-
ried out using Support Vector Machine (SVM) in addi-
tion to those classification methods used in previous re-
searches. SVM is a supervised learning method that has
proven it’s efficiently over classic Neural Networks and
its subset [9]. The advantages of SVM are good gener-
Copyright © 2013 SciRes. ENG
A. A. HASSEIM ET AL.
2
alization performance, able to handle high dimensional
data and able to map the data into new high dimensional
feature space for better classification using kernel func-
tions. The aim of this paper is to present that SVM and
ANN can be effectively used as an automated system in
seeking out pupils with handwriting problem.
1.2. Artificial Neural Network (ANN)
Probably neural network methods are most widely known.
An ANN can be define as information processing con-
cept that is inspired by the way biological nervous sys-
tems, such as the brain, process information. This system
can be seen in an architecture inspired by the structure of
the cerebral cortex of the brain [10]. These processing
elements are usually organized into a sequence of layers
with entire or random connections between the layers.
Basically, ANN is divided to three layers which are an
input layer, at least one hidden layer and an output layer.
Multilayer feedforward network is the simplest of ANN
devise. It can be used to model some mapping between
sets of input and output variable with appropriate pattern
of weights. Figure 1 shows a basic diagram of feedfor-
ward neural network which can be trained using back
propagation method, supervised learning network.
Back propagation learning uses the gradient descent
procedure to modify the connection weights which is
derived from the consideration of minimizing some error
function. This error function is needed to change the
network parameter, which is advantage in improving the
network performance.
1.3. Support Vector Machine(SVM)
We now describe the basic idea of Support Vector Ma-
chine, more explanation can be found in [9,11,12]. SVMs
are new technique suitable for binary classification tasks.
In addition, SVM is one of the excellent tools for classi-
fication and regression problems with a good generaliza-
tion performance.
SVM constructs a hyperplain or a set of hyperplains to
separate the two sets of data in a feature space. The key
approach of SVM is to try finding the best hyperplain by
maximizing the minimum margin between the two sets.
An optimal separating hyperplane is shown in Figure 2.
In SVM, training vectors are mapped into higher dimen-
sional space by the function of φ which given a training
set of instance-label pairs (x i, yi); i = 1,…, l where x i є Rn
and y є {1, -1}l. All operations in learning and testing
modes are done using an appropriate kernel functions
which is define as K (x i, x) = φT(x i) φ(x) [12]. For exam-
ple, polynomial kernel with 2 orders K(x, x) = (x. xT +1)2
map the 2-dimensional space {(x1, x2) | x1, x2 R} into
6-dimensional space {(x1, x2, 2x1x2, 2x1, 2x2, 1) |
x1, x2 R} Furthermore, kernel function has an
important effect on the functional efficiency of SVM.
The popular kernel functions include Gaussian radial
basis function, polynomial and sigmoidal functions.
2. Method
2.1. Datasets
Our sample target populations are general students who
are beginning to write. The data for this research was
obtained from Khalid et al in [13]. This sample consisted
of 120 first grade children who assigned to two groups of
writers, below average printers (test group) and above
average printers (control group). There were 60 pupils
in the control group and 60 pupils in the test group. Each
participants were required to complete 8 drawing task;
vertical downward (VD), vertical upward (VU), horizon-
tal rightward (HR), horizontal leftward (HL), right
oblique downward (RD), right oblique upward (RU), left
oblique downward (LD), and left oblique upward (LU) as
shown in Figure 3. These drawings are the most basic
drawing and the most common and effective means of
communication that have been applied in various appli-
cation for more than a decade. In a simple sense, these
line drawings are a picture that convey to their viewer
information through the shape, size and manner
HIDDEN LAYER
(there may be several
hidden
layer
INPUT
LAYER
OUTPUT
LAYER
Figure 1. A simple neural network diagram.
Figure 2. Optimal separating hyperplain.
Copyright © 2013 SciRes. ENG
A. A. HASSEIM ET AL. 3
VU
RU
HR
VD
LD
LU
HL
RD
Figure 3. A notion of eight directions.
of interconnection of thin lines on a contrasting back-
ground [14].
Dynamic data (such as velocity and pressure values) of
drawing performance have been rigorously studied in
recent researches e.g., [15,16]. Those studies have shown
that dynamic data also affect the performance character-
istic of drawing tasks besides the used of static data. For
our experiments, 2 features were selected to be used in
the classification process:
1) Feature 1: The standard deviation of pen pressure
when drawing RU, p-value < 0.0001 and z-value = minus
4.319 and,
2) Feature 2: Ratio of time taken to draw HR and HL,
p-value < 0.0001 and z-value = minus 5.205.
2.2. Architecture
2.2.1. Artificial Neural Network Classification
Artificial Neural Network training was developed using
MATLAB 7.6 software. The network chosen for the pre-
diction neural network had one input layer, 2 hidden lay-
ers and one output. For the hidden layers, the number of
neurons is obtained by trial and error. The most compact
network is chosen and presented. The network training
parameters are:
Training algorithm : Gradient descent with mo-
mentum training
Perform function : Mean Square Error
Training goal achieved : 0.04
Training epochs : 10000
Training momentum constant : 0.95
Learning rate: 0.2
Ratio to increase learning rate: 1.05
Ratio to decrease learning rate: 0.7
The hidden layers and the output layer used log sig-
moid activation function which it calculate a layer's out-
put from its net input. This function generates outputs
between 0 and 1 as the neuron's net input could be any
values from negative to positive infinity. The threshold,
for the output was set to 0.5. Therefore if the final testing
value exceeds the threshold value, the function will takes
the value 1 and 0 otherwise. The flow chart of training
network using BP algorithm is shown in Figure 4.
Since this dataset is large, we used cross validation
method to test our classifiers. The data is randomly por-
tioned into 10 equally size folds. In each folds, we se-
lected 6 samples from the control group and 6 samples
from the test group. Next, one fold is used for testing
while the remaining 9 folds are used for validation. This
process is continued 10 times such that within each iter-
tion a different fold of the data is held-out for validation
and the rest folds are used for learning.
As the initial weight of the each training process is not
fixed, the network could give slightly different results.
Hence, we trained each algorithm with 10 trials and get
the average performance of the model.
2.2.2. Support Vector Machine Classification
The SVM was also run by using program MATLAB 7.6.
Total 120 samples are used as input signals. Linear SVM
is used as kernel function for training SVM. Usually
among popular kernels, the linear kernel is much faster in
training and testing speed. An important advantage of
linear classification is that training and testing procedures
are much more efficient. Therefore, linear classification
can be very useful for some large-scale applications [17].
No
Yes
Output
Control
group
Start
Identify the parameters
of the network
Splitting the data set
randoml
y
Training data with
b
ack
p
ro
p
a
g
ation Testing data
Compare
Set threshold value
= 0.5
If < 0.5
Target
Test
group
Figure 4. Flowchart for identification of the handwriting
problem using artificial neural network model.
Copyright © 2013 SciRes. ENG
A. A. HASSEIM ET AL.
4
The 12 random signals are selected from the data used
to test SVM and the remaining data used for training.
Just like neural network, the experiment was done with
10 iterations of 10-fold cross validation and the final av-
erage performance of the classifier was taken out.
3. Results and Discussions
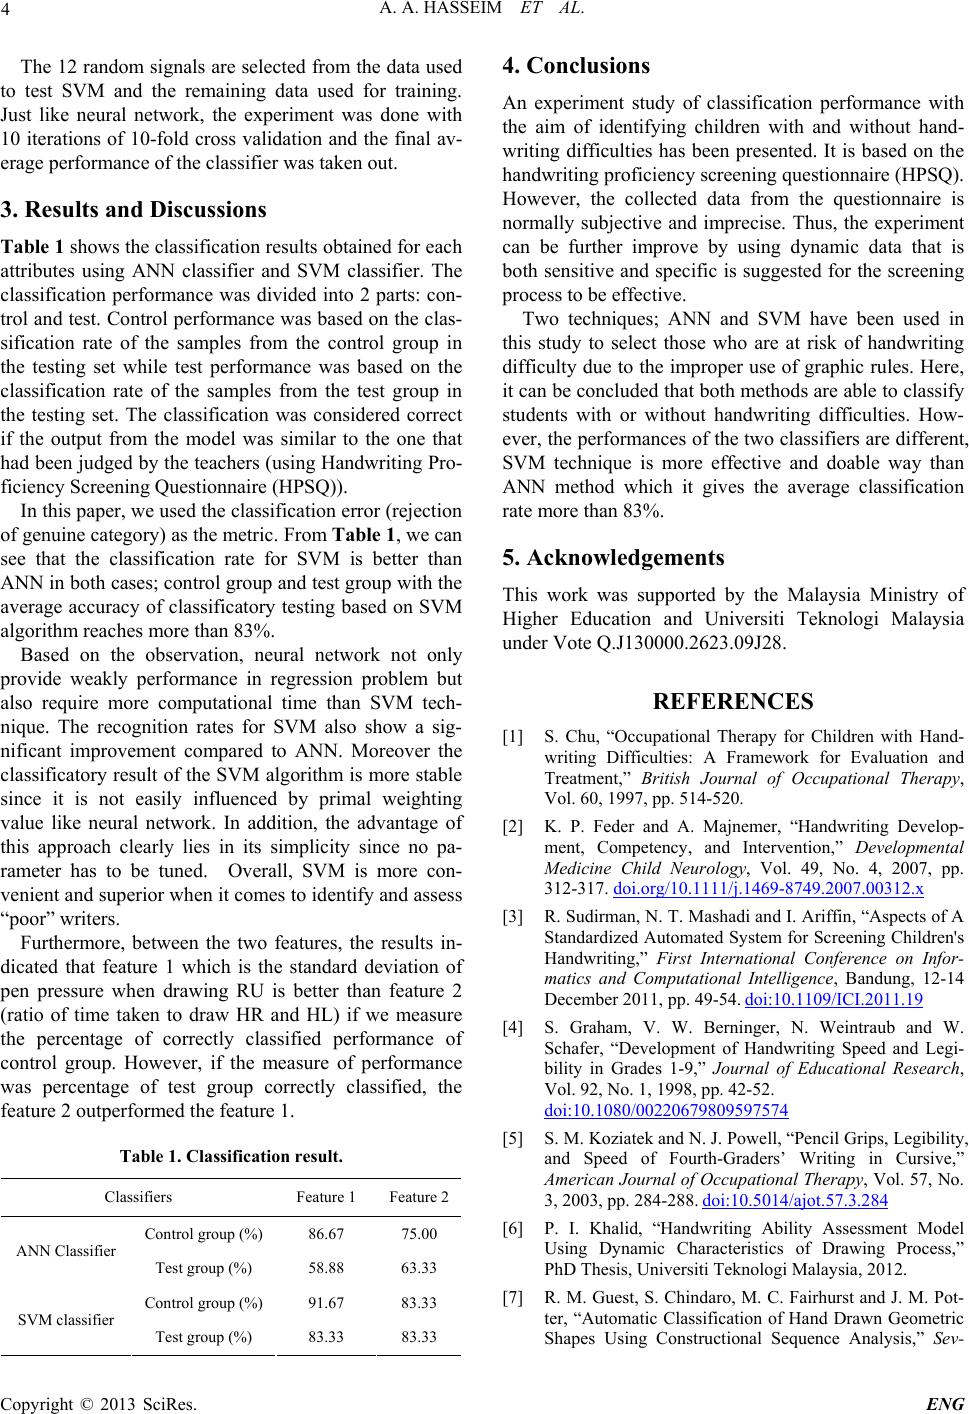
Table 1 shows the classification results obtained for each
attributes using ANN classifier and SVM classifier. The
classification performance was divided into 2 parts: con-
trol and test. Control performance was based on the clas-
sification rate of the samples from the control group in
the testing set while test performance was based on the
classification rate of the samples from the test group in
the testing set. The classification was considered correct
if the output from the model was similar to the one that
had been judged by the teachers (using Handwriting Pro-
ficiency Screening Questionnaire (HPSQ)).
In this paper, we used the classification error (rejection
of genuine category) as the metric. From Table 1, we can
see that the classification rate for SVM is better than
ANN in both cases; control group and test group with the
average accuracy of classificatory testing based on SVM
algorithm reaches more than 83%.
Based on the observation, neural network not only
provide weakly performance in regression problem but
also require more computational time than SVM tech-
nique. The recognition rates for SVM also show a sig-
nificant improvement compared to ANN. Moreover the
classificatory result of the SVM algorithm is more stable
since it is not easily influenced by primal weighting
value like neural network. In addition, the advantage of
this approach clearly lies in its simplicity since no pa-
rameter has to be tuned. Overall, SVM is more con-
venient and superior when it comes to identify and assess
“poor” writers.
Furthermore, between the two features, the results in-
dicated that feature 1 which is the standard deviation of
pen pressure when drawing RU is better than feature 2
(ratio of time taken to draw HR and HL) if we measure
the percentage of correctly classified performance of
control group. However, if the measure of performance
was percentage of test group correctly classified, the
feature 2 outperformed the feature 1.
Table 1. Classification result.
Classifiers Feature 1 Feature 2
Control group (%) 86.67 75.00
ANN Classifier
Test group (%) 58.88 63.33
Control group (%) 91.67 83.33
SVM classifier
Test group (%) 83.33 83.33
4. Conclusions
An experiment study of classification performance with
the aim of identifying children with and without hand-
writing difficulties has been presented. It is based on the
handwriting proficiency screening questionnaire (HPSQ).
However, the collected data from the questionnaire is
normally subjective and imprecise. Thus, the experiment
can be further improve by using dynamic data that is
both sensitive and specific is suggested for the screening
process to be effective.
Two techniques; ANN and SVM have been used in
this study to select those who are at risk of handwriting
difficulty due to the improper use of graphic rules. Here,
it can be concluded that both methods are able to classify
students with or without handwriting difficulties. How-
ever, the performances of the two classifiers are different,
SVM technique is more effective and doable way than
ANN method which it gives the average classification
rate more than 83%.
5. Acknowledgements
This work was supported by the Malaysia Ministry of
Higher Education and Universiti Teknologi Malaysia
under Vote Q.J130000.2623.09J28.
REFERENCES
[1] S. Chu, “Occupational Therapy for Children with Hand-
writing Difficulties: A Framework for Evaluation and
Treatment,” British Journal of Occupational Therapy,
Vol. 60, 1997, pp. 514-520.
[2] K. P. Feder and A. Majnemer, “Handwriting Develop-
ment, Competency, and Intervention,” Developmental
Medicine Child Neurology, Vol. 49, No. 4, 2007, pp.
312-317. doi.org/10.1111/j.1469-8749.2007.00312.x
[3] R. Sudirman, N. T. Mashadi and I. Ariffin, “Aspects of A
Standardized Automated System for Screening Children's
Handwriting,” First International Conference on Infor-
matics and Computational Intelligence, Bandung, 12-14
December 2011, pp. 49-54. doi:10.1109/ICI.2011.19
[4] S. Graham, V. W. Berninger, N. Weintraub and W.
Schafer, “Development of Handwriting Speed and Legi-
bility in Grades 1-9,” Journal of Educational Research,
Vol. 92, No. 1, 1998, pp. 42-52.
doi:10.1080/00220679809597574
[5] S. M. Koziatek and N. J. Powell, “Pencil Grips, Legibility,
and Speed of Fourth-Graders’ Writing in Cursive,”
American Journal of Occupational Therapy, Vol. 57, No.
3, 2003, pp. 284-288. doi:10.5014/ajot.57.3.284
[6] P. I. Khalid, “Handwriting Ability Assessment Model
Using Dynamic Characteristics of Drawing Process,”
PhD Thesis, Universiti Teknologi Malaysia, 2012.
[7] R. M. Guest, S. Chindaro, M. C. Fairhurst and J. M. Pot-
ter, “Automatic Classification of Hand Drawn Geometric
Shapes Using Constructional Sequence Analysis,” Sev-
Copyright © 2013 SciRes. ENG
A. A. HASSEIM ET AL.
Copyright © 2013 SciRes. ENG
5
enth International Conference on Document Analysis and
Recognition (ICDAR'03) icdar, Vol. 2, 2003, p. 990.
[8] S. Chindaro, R. M. Guest, M. C. Fairhurst and J. M. Pot-
ter, “Assessing Visuo-Spatial Neglect Through Feature
Selection and Combination from Geometric Shape
Drawing Performance and Sequence Analysis,” Interna-
tional Journal of Pattern Recognition & Artificial Intelli-
gence, Vol. 18, 2004, pp. 1253-1266.
doi:10.1142/S0218001404003757
[9] C. J. C. Burges, “A Tutorial on Support Vector Machines
for Pattern Recognition,” Data Mining and Knowledge
Discovery, Vol. 2, 1998, pp. 121-167.
doi:10.1023/A:1009715923555
[10] L. H. Tsoukalas and R. E. Uhrig, “Fuzzy and Neural Ap-
proaches in Engineering,” John Wiley and Sons, 1997.
[11] V. N. Vapnik, “The Nature of Statistical Learning The-
ory,” Springer, New York, 1995.
doi:10.1007/978-1-4757-2440-0
[12] C. W. Hsu, C. C. Chang and C. J. Lin, “A Practical
Guide to Support Vector Classification,” Technical Re-
port, Department of Computer Science and Information
Engineering, National Taiwan University, 2003.
[13] P. I. Khalid, J. Yunus, R. Adnan, M. Harun, R. Sudirman
and N. H. Mahmood, “The Use of Graphic Rules in
Grade One to Help Identify Children At Risk of Hand-
writing Difficulties,” Research in Developmental Dis-
abilities, Vol. 31, 2010, pp. 1685-1693.
doi:10.1016/j.ridd.2010.04.005
[14] H. Freeman, “Computer Processing of Line-Drawing
Images,” ACM Computing Surveys, Vol. 6, 1974, pp.
57-97. doi:10.1145/356625.356627
[15] R. M. Guest, M. C. Fairhust and J. M. Potter, “Diagnosis
of Visuo-Spatial Neglect Using Dynamic Sequence Fea-
tures from A Cancellation Task,” Pattern Recognition
Analysis & Applications, Vol. 5, 2012, pp. 261-270.
doi:10.1007/s100440200023
[16] P. I. Khalid, J. Yunus and R. Adnan, “Extraction of Dy-
namic Features from Hand Drawn Data for the Identifica-
tion of Children with Handwriting Difficulty,” Research
in Developmental Disabilities, Vol. 31, 2010, pp. 256-262.
doi:10.1016/j.ridd.2009.09.009
[17] G. X. Yuan, C. H. Ho and C. J. Lin, “Recent Advances of
Large-Scale Linear Classification,” Proceedings of the
IEEE, Vol. 100, No. 9, 2012, pp. 2584-2603.
doi:10.1109/JPROC.2012.2188013