 International Journal of Clinical Medicine, 2013, 4, 331-342 http://dx.doi.org/10.4236/ijcm.2013.48059 Published Online August 2013 (http://www.scirp.org/journal/ijcm) Copyright © 2013 SciRes. IJCM 331 Therapeutic Drug Monitoring of Chelating Agent Deferoxamine for β-Thalassemia Major Patients Rawa Ratha1, Tagreed Altaei2* 1Department of Clinical Pharmacy, College of Pharmacy, Sulaimany University, Sulaimany, Iraq; 2Department of Pharmacology and Toxicology, College of Pharmacy, Hawler Medical University, Erbil, Iraq. Email: *tagreedaltaei@yahoo.com Received May 24th, 2013; revised June 25th, 2013; accepted July 9th, 2013 Copyright © 2013 Rawa Ratha, Tagreed Altaei. This is an open access article distributed under the Creative Commons Attribution License, which permits unrestricted use, distribution, and reproduction in any medium, provided the original work is properly cited. ABSTRACT Purpose: Therapeutic drug monitoring is used to prevent or decrease the risk associated with the toxic effects of medi- cation. This study aims to evaluate the potential advantages of Therapeutic Drug Monitoring (TDM) of subcutaneous Deferoxamine injection and prevention of clinical problems in β-thalassaemia major patients. Patients & Methods: Fifty-four thalassemia patients were allocated into two groups; missing, and not missing deferoxamine dose. TDM of Deferoxamine injection and its clinical outcomes were critically studied under the following subheadings: assessment of the adequacy of Deferoxamine usage, serum peak and trough concentrations of Deferoxamine and ferroxamine with needed pharmacokinetics, cardiac parameters and biomarkers, biochemical and hematological indices, adverse effects/ toxicity, urinary assessment of Fe, Zn, selenium, and copper levels, compliance to treatment, dose adjustment in corre- lation to therapeutic index and life style. Results: Demographic data showed no significant difference. Peak plasma concentrations were 144.83 ± 69 and 43.54 ± 39.16 µg/L, while trough concentrations were 33 ± 26.32 and 31.13 ± 21.58 µg/L of Deferoxamine and ferroxamine, respectively. The elimination rate constant was 0.0237 ± 0.00029 min−1, half-life was 34 min, and distribution volume was 0.93 ± 0.078. Although cardiac parameters showed no significant differences, there were significant differences in CK-MB, and hsCRP levels; troponin I value could not be detected. Biochemical and hematological studies showed significant differences in Ferritin B, urea, SGPT, SGOT, alkaline phos- phatase, serum albumin and serum calcium. Assessment of adverse effects/toxicity showed significant differences. The correlation of serum ferritin to therapeutic index, and the life style including Vitamin C and/or E administration were assessed for the compliance to treatment. Conclusion: Therapeutic monitoring of chelation therapy by Deferoxamine in β-thalassemia patients is necessary to ensure effective treatment, compliance, and to avoid adverse side effects and tox- icity. Keywords: Therapeutic Drug Monitoring; Deferoxamine; β-Thalassemia Major 1. Introduction Therapeutic drug monitoring involves not only measur- ing drug concentrations, but also the clinical interpreta- tion of the result. This requires knowledge of the phar- macokinetics, sampling time, drug history and the pa- tient’s clinical condition [1]. Homozygotes for beta-thalassemia may develop either thalassemia major or thalassemia intermedia. Thalasse- mia major patients come to medical attention within the first 2 years and require regular blood transfusion to sur- vive. Differentiation of thalassemia major from thalas- semia intermedia at presentation is a difficult and critical issue that should be strongly pursued [2]. Iron overload occurs when the intake of iron is in- creased over a prolonged period of time and is commonly seen in patients with beta-thalassaemia major, who re- ceive frequent blood transfusions. The iron excess is ini- tially stored in thereticuloendothelial system (which has a capacity of about 10 - 15 g), and then in all parenchymas [3], resulting in life-threatening complications, namely cardiopathy, liver and endocrine dysfunction and reduced patient’s survival. The damage is characterized by exces- sive iron deposition. Without adequate iron chelation therapy, almost all patients with beta-thalassemia will accumulate potentially fatal iron levels [4]. Particular attention has been directed to the early di- *Corresponding author. 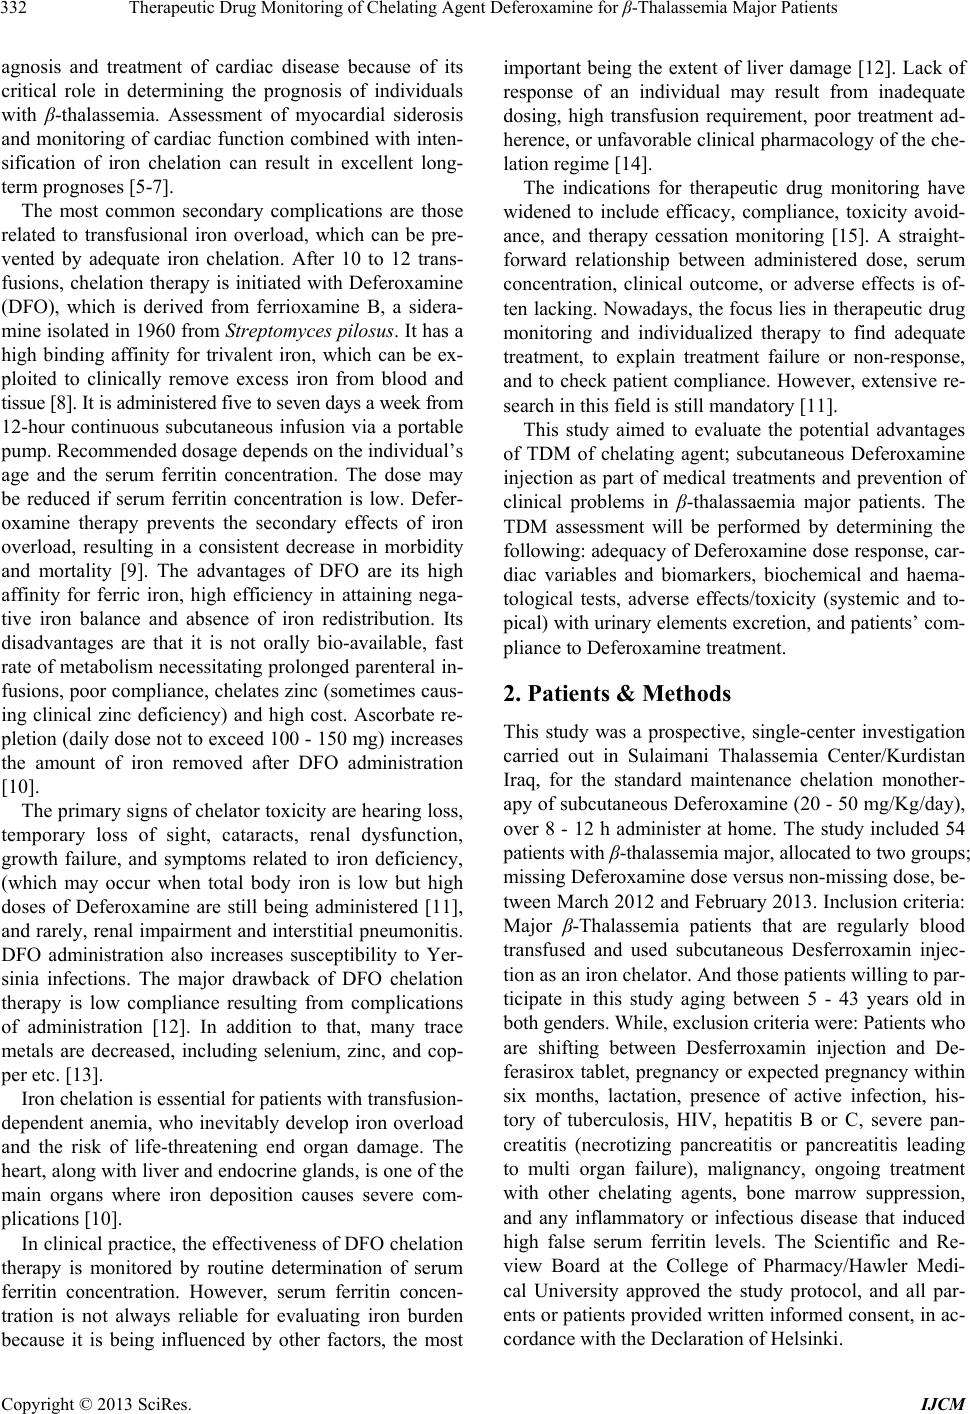 Therapeutic Drug Monitoring of Chelating Agent Deferoxamine for β-Thalassemia Major Patients Copyright © 2013 SciRes. IJCM 332 agnosis and treatment of cardiac disease because of its critical role in determining the prognosis of individuals with β-thalassemia. Assessment of myocardial siderosis and monitoring of cardiac function combined with inten- sification of iron chelation can result in excellent long- term prognoses [5-7]. The most common secondary complications are those related to transfusional iron overload, which can be pre- vented by adequate iron chelation. After 10 to 12 trans- fusions, chelation therapy is initiated with Deferoxamine (DFO), which is derived from ferrioxamine B, a sidera- mine isolated in 1960 from Streptomyces pilosus. It has a high binding affinity for trivalent iron, which can be ex- ploited to clinically remove excess iron from blood and tissue [8]. It is administered five to seven days a week from 12-hour continuous subcutaneous infusion via a portable pump. Recommended dosage depends on the individual’s age and the serum ferritin concentration. The dose may be reduced if serum ferritin concentration is low. Defer- oxamine therapy prevents the secondary effects of iron overload, resulting in a consistent decrease in morbidity and mortality [9]. The advantages of DFO are its high affinity for ferric iron, high efficiency in attaining nega- tive iron balance and absence of iron redistribution. Its disadvantages are that it is not orally bio-available, fast rate of metabolism necessitating prolonged parenteral in- fusions, poor compliance, chelates zinc (sometimes caus- ing clinical zinc deficiency) and high cost. Ascorbate re- pletion (daily dose not to exceed 100 - 150 mg) increases the amount of iron removed after DFO administration [10]. The primary signs of chelator toxicity are hearing loss, temporary loss of sight, cataracts, renal dysfunction, growth failure, and symptoms related to iron deficiency, (which may occur when total body iron is low but high doses of Deferoxamine are still being administered [11], and rarely, renal impairment and interstitial pneumonitis. DFO administration also increases susceptibility to Yer- sinia infections. The major drawback of DFO chelation therapy is low compliance resulting from complications of administration [12]. In addition to that, many trace metals are decreased, including selenium, zinc, and cop- per etc. [13]. Iron chelation is essential for patients with transfusion- dependent anemia, who inevitably develop iron overload and the risk of life-threatening end organ damage. The heart, along with liver and endocrine glands, is one of the main organs where iron deposition causes severe com- plications [10]. In clinical practice, the effectiveness of DFO chelation therapy is monitored by routine determination of serum ferritin concentration. However, serum ferritin concen- tration is not always reliable for evaluating iron burden because it is being influenced by other factors, the most important being the extent of liver damage [12]. Lack of response of an individual may result from inadequate dosing, high transfusion requirement, poor treatment ad- herence, or unfavorable clinical pharmacology of the che- lation regime [14]. The indications for therapeutic drug monitoring have widened to include efficacy, compliance, toxicity avoid- ance, and therapy cessation monitoring [15]. A straight- forward relationship between administered dose, serum concentration, clinical outcome, or adverse effects is of- ten lacking. Nowadays, the focus lies in therapeutic drug monitoring and individualized therapy to find adequate treatment, to explain treatment failure or non-response, and to check patient compliance. However, extensive re- search in this field is still mandatory [11]. This study aimed to evaluate the potential advantages of TDM of chelating agent; subcutaneous Deferoxamine injection as part of medical treatments and prevention of clinical problems in β-thalassaemia major patients. The TDM assessment will be performed by determining the following: adequacy of Deferoxamine dose response, car- diac variables and biomarkers, biochemical and haema- tological tests, adverse effects/toxicity (systemic and to- pical) with urinary elements excretion, and patients’ com- pliance to Deferoxamine treatment. 2. Patients & Methods This study was a prospective, single-center investigation carried out in Sulaimani Thalassemia Center/Kurdistan Iraq, for the standard maintenance chelation monother- apy of subcutaneous Deferoxamine (20 - 50 mg/Kg/day), over 8 - 12 h administer at home. The study included 54 patients with β-thalassemia major, allocated to two groups; missing Deferoxamine dose versus non-missing dose, be- tween March 2012 and February 2013. Inclusion criteria: Major β-Thalassemia patients that are regularly blood transfused and used subcutaneous Desferroxamin injec- tion as an iron chelator. And those patients willing to par- ticipate in this study aging between 5 - 43 years old in both genders. While, exclusion criteria were: Patients who are shifting between Desferroxamin injection and De- ferasirox tablet, pregnancy or expected pregnancy within six months, lactation, presence of active infection, his- tory of tuberculosis, HIV, hepatitis B or C, severe pan- creatitis (necrotizing pancreatitis or pancreatitis leading to multi organ failure), malignancy, ongoing treatment with other chelating agents, bone marrow suppression, and any inflammatory or infectious disease that induced high false serum ferritin levels. The Scientific and Re- view Board at the College of Pharmacy/Hawler Medi- cal University approved the study protocol, and all par- ents or patients provided written informed consent, in ac- cordance with the Declaration of Helsinki. 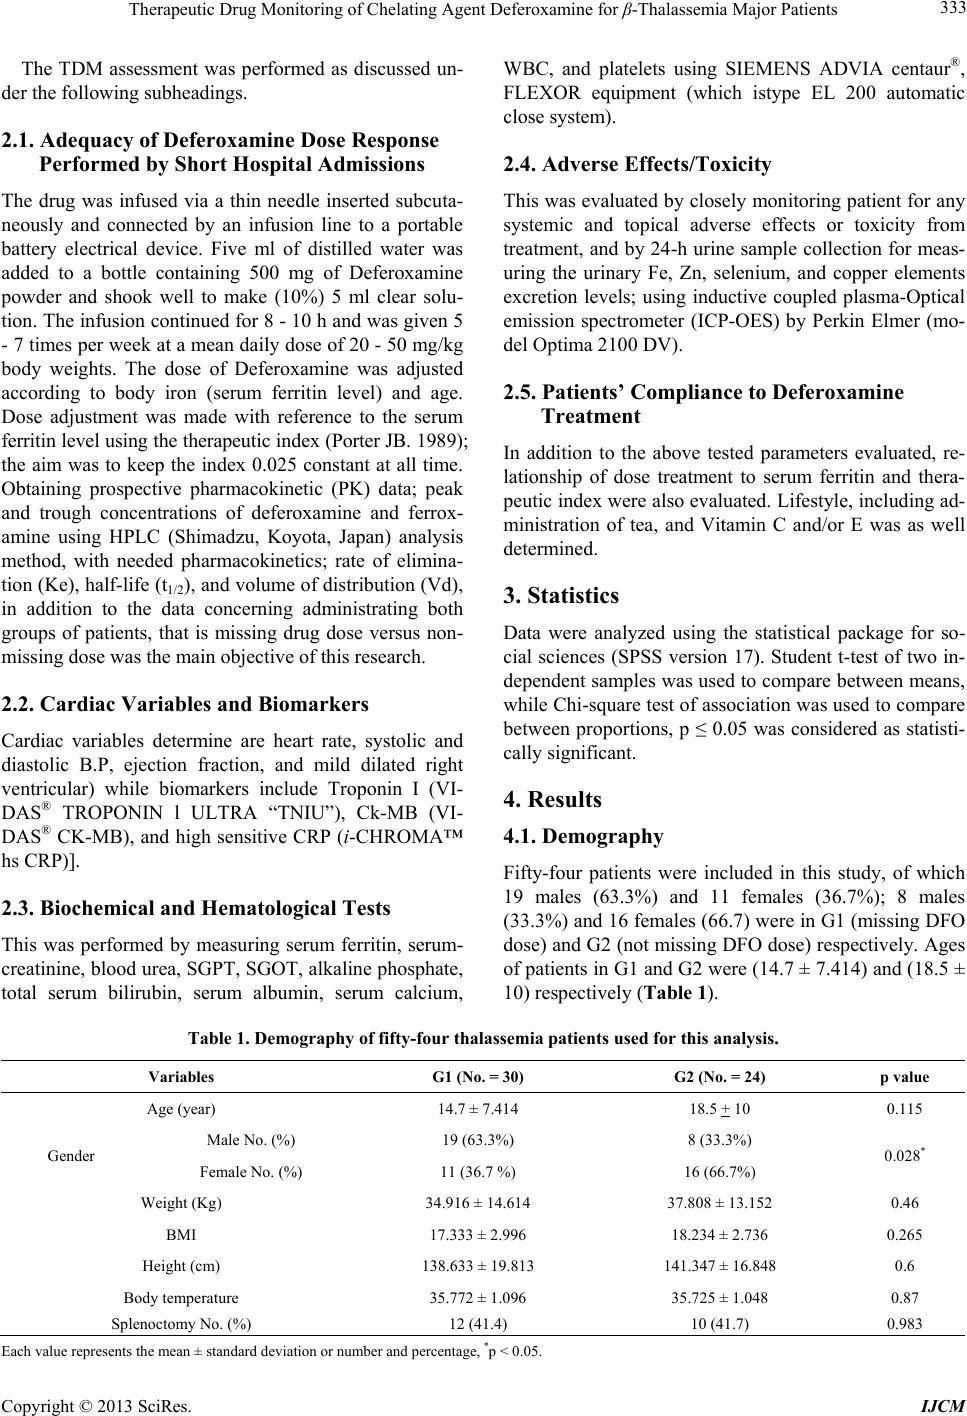 Therapeutic Drug Monitoring of Chelating Agent Deferoxamine for β-Thalassemia Major Patients Copyright © 2013 SciRes. IJCM 333 The TDM assessment was performed as discussed un- der the following subheadings. 2.1. Adequacy of Deferoxamine Dose Response Performed by Short Hospital Admissions The drug was infused via a thin needle inserted subcuta- neously and connected by an infusion line to a portable battery electrical device. Five ml of distilled water was added to a bottle containing 500 mg of Deferoxamine powder and shook well to make (10%) 5 ml clear solu- tion. The infusion continued for 8 - 10 h and was given 5 - 7 times per week at a mean daily dose of 20 - 50 mg/kg body weights. The dose of Deferoxamine was adjusted according to body iron (serum ferritin level) and age. Dose adjustment was made with reference to the serum ferritin level using the therapeutic index (Porter JB. 1989); the aim was to keep the index 0.025 constant at all time. Obtaining prospective pharmacokinetic (PK) data; peak and trough concentrations of deferoxamine and ferrox- amine using HPLC (Shimadzu, Koyota, Japan) analysis method, with needed pharmacokinetics; rate of elimina- tion (Ke), half-life (t1/2), and volume of distribution (Vd), in addition to the data concerning administrating both groups of patients, that is missing drug dose versus non- missing dose was the main objective of this research. 2.2. Cardiac Variables and Biomarkers Cardiac variables determine are heart rate, systolic and diastolic B.P, ejection fraction, and mild dilated right ventricular) while biomarkers include Troponin I (VI- DAS® TROPONIN l ULTRA “TNIU”), Ck-MB (VI- DAS® CK-MB), and high sensitive CRP (i-CHROMA™ hs CRP)]. 2.3. Biochemical and Hematological Tests This was performed by measuring serum ferritin, serum- creatinine, blood urea, SGPT, SGOT, alkaline phosphate, total serum bilirubin, serum albumin, serum calcium, WBC, and platelets using SIEMENS ADVIA centaur®, FLEXOR equipment (which istype EL 200 automatic close system). 2.4. Adverse Effects/Toxicity This was evaluated by closely monitoring patient for any systemic and topical adverse effects or toxicity from treatment, and by 24-h urine sample collection for meas- uring the urinary Fe, Zn, selenium, and copper elements excretion levels; using inductive coupled plasma-Optical emission spectrometer (ICP-OES) by Perkin Elmer (mo- del Optima 2100 DV). 2.5. Patients’ Compliance to Deferoxamine Treatment In addition to the above tested parameters evaluated, re- lationship of dose treatment to serum ferritin and thera- peutic index were also evaluated. Lifestyle, including ad- ministration of tea, and Vitamin C and/or E was as well determined. 3. Statistics Data were analyzed using the statistical package for so- cial sciences (SPSS version 17). Student t-test of two in- dependent samples was used to compare between means, while Chi-square test of association was used to compare between proportions, p ≤ 0.05 was considered as statisti- cally significant. 4. Results 4.1. Demography Fifty-four patients were included in this study, of which 19 males (63.3%) and 11 females (36.7%); 8 males (33.3%) and 16 females (66.7) were in G1 (missing DFO dose) and G2 (not missing DFO dose) respectively. Ages of patients in G1 and G2 were (14.7 ± 7.414) and (18.5 ± 10) respectively (Table 1). Table 1. Demography of fifty-four thalassemia patients used for this analysis. Variables G1 (No. = 30) G2 (No. = 24) p value Age (year) 14.7 ± 7.414 18.5 + 10 0.115 Male No. (%) 19 (63.3%) 8 (33.3%) Gender Female No. (%) 11 (36.7 %) 16 (66.7%) 0.028* Weight (Kg) 34.916 ± 14.614 37.808 ± 13.152 0.46 BMI 17.333 ± 2.996 18.234 ± 2.736 0.265 Height (cm) 138.633 ± 19.813 141.347 ± 16.848 0.6 Body temperature 35.772 ± 1.096 35.725 ± 1.048 0.87 Splenoctomy No. (%) 12 (41.4) 10 (41.7) 0.983 Each value represents the mean ± standard deviation or number and percentage, *p ˂ 0.05. 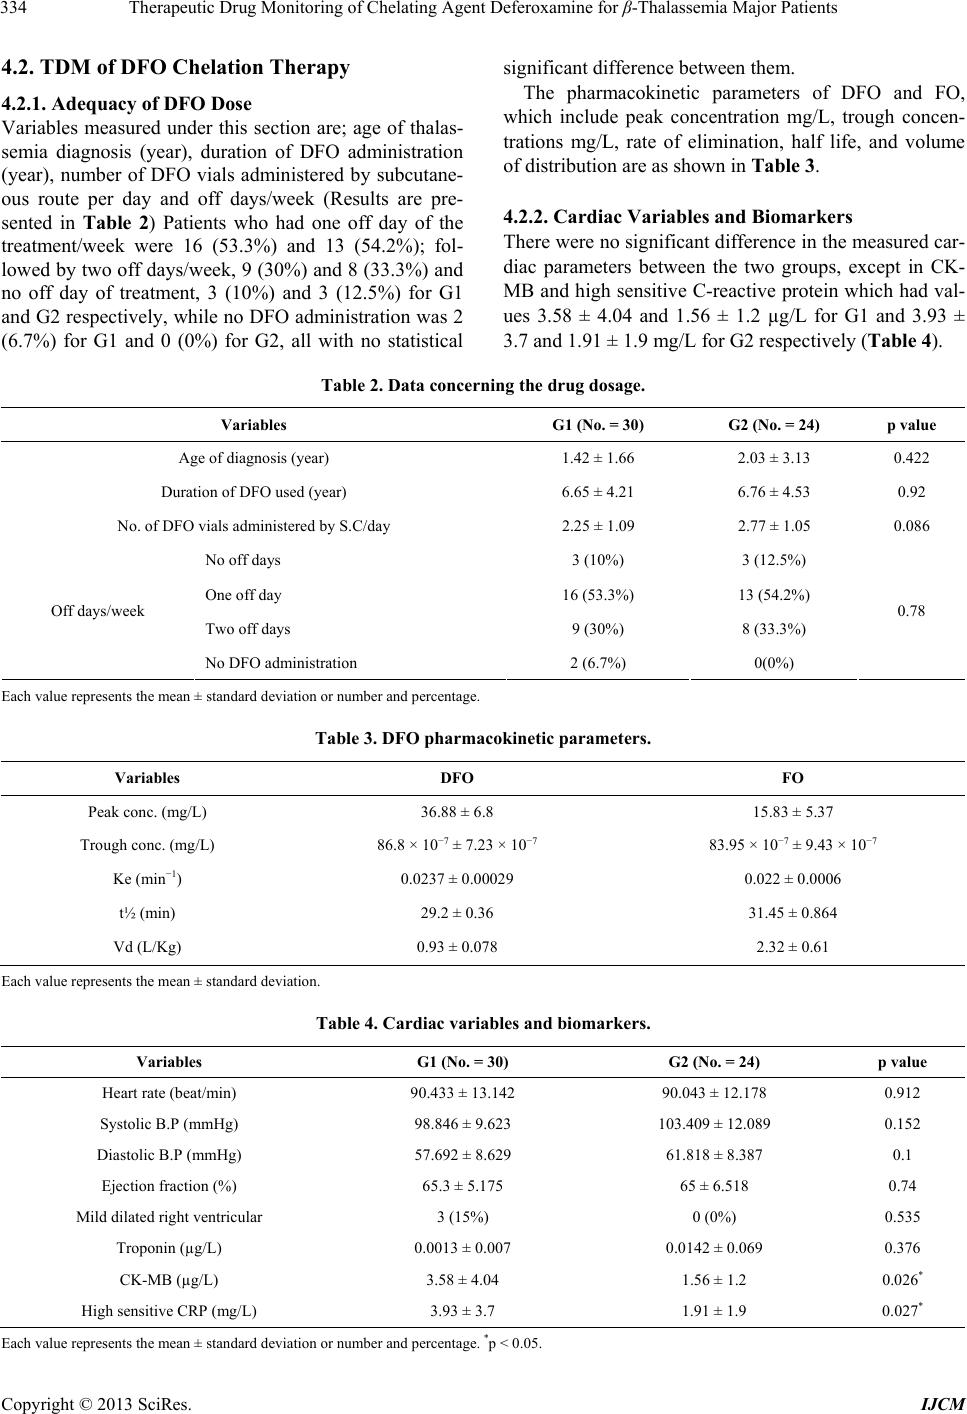 Therapeutic Drug Monitoring of Chelating Agent Deferoxamine for β-Thalassemia Major Patients Copyright © 2013 SciRes. IJCM 334 4.2. TDM of DFO Chelation Therapy 4.2.1. Adequacy of DFO Dose Variables measured under this section are; age of thalas- semia diagnosis (year), duration of DFO administration (year), number of DFO vials administered by subcutane- ous route per day and off days/week (Results are pre- sented in Table 2) Patients who had one off day of the treatment/week were 16 (53.3%) and 13 (54.2%); fol- lowed by two off days/week, 9 (30%) and 8 (33.3%) and no off day of treatment, 3 (10%) and 3 (12.5%) for G1 and G2 respectively, while no DFO administration was 2 (6.7%) for G1 and 0 (0%) for G2, all with no statistical significant difference between them. The pharmacokinetic parameters of DFO and FO, which include peak concentration mg/L, trough concen- trations mg/L, rate of elimination, half life, and volume of distribution are as shown in Table 3. 4.2.2. Cardiac Variables and Biomarkers There were no significant difference in the measured car- diac parameters between the two groups, except in CK- MB and high sensitive C-reactive protein which had val- ues 3.58 ± 4.04 and 1.56 ± 1.2 µg/L for G1 and 3.93 ± 3.7 and 1.91 ± 1.9 mg/L for G2 respectively (Table 4). Table 2. Data concerning the drug dosage. Variables G1 (No. = 30) G2 (No. = 24) p value Age of diagnosis (year) 1.42 ± 1.66 2.03 ± 3.13 0.422 Duration of DFO used (year) 6.65 ± 4.21 6.76 ± 4.53 0.92 No. of DFO vials administered by S.C/day 2.25 ± 1.09 2.77 ± 1.05 0.086 No off days 3 (10%) 3 (12.5%) One off day 16 (53.3%) 13 (54.2%) Two off days 9 (30%) 8 (33.3%) Off days/week No DFO administration 2 (6.7%) 0(0%) 0.78 Each value represents the mean ± standard deviation or number and percentage. Table 3. DFO pharmacokinetic parameters. Variables DFO FO Peak conc. (mg/L) 36.88 ± 6.8 15.83 ± 5.37 Trough conc. (mg/L) 86.8 × 10⁻⁷ ± 7.23 × 10⁻⁷ 83.95 × 10⁻⁷ ± 9.43 × 10⁻⁷ Ke (min−1) 0.0237 ± 0.00029 0.022 ± 0.0006 t½ (min) 29.2 ± 0.36 31.45 ± 0.864 Vd (L/Kg) 0.93 ± 0.078 2.32 ± 0.61 Each value represents the mean ± standard deviation. Table 4. Cardiac variables and biomarkers. Variables G1 (No. = 30) G2 (No. = 24) p value Heart rate (beat/min) 90.433 ± 13.142 90.043 ± 12.178 0.912 Systolic B.P (mmHg) 98.846 ± 9.623 103.409 ± 12.089 0.152 Diastolic B.P (mmHg) 57.692 ± 8.629 61.818 ± 8.387 0.1 Ejection fraction (%) 65.3 ± 5.175 65 ± 6.518 0.74 Mild dilated right ventricular 3 (15%) 0 (0%) 0.535 Troponin (µg/L) 0.0013 ± 0.007 0.0142 ± 0.069 0.376 CK-MB (µg/L) 3.58 ± 4.04 1.56 ± 1.2 0.026* High sensitive CRP (mg/L) 3.93 ± 3.7 1.91 ± 1.9 0.027* Each value represents the mean ± standard deviation or number and percentage. *p ˂ 0.05.  Therapeutic Drug Monitoring of Chelating Agent Deferoxamine for β-Thalassemia Major Patients Copyright © 2013 SciRes. IJCM 335 4.2.3. Biochemical and Hematological Assessment The highest significant differences were seen in serum ferritin with value (6937.96 ± 2748.2) µg/L, and 3890.25 ± 2770.98) µg/L for G1 and G2 groups respectively. Blood urea (mg/dl) in patients ≤ 12 years old was 26.39 ± 5.69 and 20.74 ± 4.31, while for patients ˃12 years old it was (29.76 ± 7.21) and (23.16 ± 6.4), SGPT was (68.93 ± 31.61), and (46.35 ± 23.9) units/L, SGOT was (64.39 ± 30.7) and (47.78 ± 19.26) units/L, alkaline phosphatase (units/L) in patients ≤ 12 year olds was (526.84 ± 230.02) and (300.41 ± 148.17) while in patients ˃12 years old it was (365.05 ± 141.36) and (235.14 ± 97.85) in G1 and G2 respectively. Serum albumin also showed highest sig- nificant difference of 4.29 ± 0.3 and 4.7 ± 0.4) similar to serum calcium which gave 8.22 ± 0.9) mg/dl and 9.28 ± 0.88) mg/dl for G1 and G2 respectively, as showed in Table 5. 4.2.4. Monitoring of Adverse and Toxic Effect of DFO in Enrolled Major β-Thalassemia Patients 1) Urinary elements excretion There were significant differences in urinary elements excreted. The value of Fe was (814.74 ± 654.49) and (3166.07 ± 2761.44) with (p = 0.018); Zn (384.66 ± 195.79) and (585.58 ± 361.84) with (p = 0.038) and Cu (62.63 ± 19.52) and (90.92 ± 57.34) with (p = 0.044), measured in µg/day in G1 and G2 respectively (Figures 1-4). Moreover the color of urine was reddish brown. Each value represents the mean ± standard deviation. 2) DFO adverse effects Figure 5 showed that highest incidence of DFO ad- verse effects were arthralgia-myalgia, bone pain, growth retard, headache, dizziness, stomach pain, visual distur- bance and hearing problem. There was significant dif- ferent showed in diarrhea and fever between the two Table 5. Biochemical and hematological assessment. Variables G1 (No. = 30) G2 (No. = 24) p value Serum ferritin (ng/ml or µg/L) 6937.96 ± 2748.2 3890.25 ± 2770.98 0.001* ≤12 year 0.36 ± 0.095 0.35 ± 0.107 0.79 Serum creatinine (mg/dl) ˃12 year 0.48 ± 0.154 0.48 ± 0.144 0.939 ≤12 year 26.39 ± 5.69 20.74 ± 4.31 0.023* Blood urea (mg/dl) ˃12 year 29.76 ± 7.21 23.16 ± 6.4 0.03* SGPT (units/L) 68.93 ± 31.61 46.35 ± 23.9 0.014* SGOT (units/L) 64.39 ± 30.7 47.78 ± 19.26 0.045* ≤12 year 526.84 ± 230.02 300.41 ± 148.17 0.043* Alkaline phosphate (units/L) ˃12 year 365.05 ± 141.36 235.14 ± 97.85 0.026* Total serum bilirubin (mg/dl) 1.82 ± 1.14 2.11 ± 1.32 0.407 WBC (WBC/cmm) 12.45 ± 8.3 10.13 ± 8.28 0.344 ≤12 year 244459.72 ± 110964.93 315214.28 ± 113739.78 0.201 Platelet in cells/µL ˃12 year 432030.3 ± 218042.79 456916.66 ± 274220.79 0.808 Serum albumin (g/dl) 4.29 ± 0.3 4.7 ± 0.4 0.001* Serum calcium (mg/dl) 8.22 ± 0.9 9.28 ± 0.88 0.003* Each value represents the mean ± standard deviation. *p ˂ 0.05. 0 5000 [Fe] in urin G 1 (No.=30)G 2 (No.=24) Figure 1. Urinary excretion of iron, *p ˂ 0.05. 0 1000 [Zn] in urine G 1 (No.=30)G 2 (No.=24) Figure 2. Urinary excretion of zinc, *p ˂ 0.05.  Therapeutic Drug Monitoring of Chelating Agent Deferoxamine for β-Thalassemia Major Patients Copyright © 2013 SciRes. IJCM 336 0 100 [Cu] in urine G 1 (No.=30)G 2 (No.=24) Figure 3 .Urinary excretion of copper, *p ˂ 0.05. 0 200 400 [Se] in urine G 1 (No.=30)G 2 (No.=24) Figure 4. Urinary excretion of selenium, *p ˂ 0.05. Figure 5. The percentage of DFO adverse effects, *p ˂ 0.05. groups. 3) Distribution of the site of subcutaneous DFO injec- tion and related adverse effects Figure 6 showed the percentage distribution of the dif- ference site of DFO subcutaneous injection. Patients that were administered via abdomen were 6 (21.4%) and 6 (25%); patients that used upper arm were 15 (53.6%) and 16 (66.7%) and patients that used both sites were 7 (25%) and 2 (8.3%) in G1 (missing DFO dose) and G2 (not missing DFO dose) respectively. There were no statisti- cal significant differences between these two groups. Adverse effects of S.C injection were swelling seen in 26 (92.9%) and 23 (95.8%) patients followed by infiltra- tion in 26 (92.9%) and 20 (83.3%) patients; pain in 23 (82.1%) and 18 (75%) patients; pruritus in 24 (85.7%) and 19 (79.2%) patients and erythema in 20 (71.4%) and19 (79.2%) patients in both G1 and G2 respectively Figure 6. The distribution of the site of S.C DFO injection. (Figure 7). There was no statistical correlation between site of S.C DFO injection (abdomen, upper arm and both sites) and the injection site adverse effects (erythema, pruritus, pain,  Therapeutic Drug Monitoring of Chelating Agent Deferoxamine for β-Thalassemia Major Patients Copyright © 2013 SciRes. IJCM 337 swelling and infiltration) in both groups as showed in Figure 8. 4) Compliance to treatment Figure 7. The percentage of S.C. injection adverse effects in both groups. Relations of DFO dose to serum ferritin and DFO ther- apeutic index, explain the compliance to treatment, which presented in Table 6. Figure 8. The site of S.C DFO injection (abdomen, upper arm and both sites) and side effects (erythema,pruritus, pain, swelling and infiltration) for enrolled patients. Table 6. Relations of DFO dose to serum ferritin and DFO therapeutic index. G1 (missing DFO Dose) G2 (not missing DFO Dose) Dose of DFO mg/kg/day Serum ferritin µg/L Therapeutic index Dose study Dose of DFO mg/kg/day Serum ferritin µg/L Therapeutic index Dose study 33.33 5257.8 0.0063 (1) 23.51 2991.77 0.0078 (1) 38.79 7328 0.0052 (1) 25.92 3970 0.0065 (1) 34 6748 0.005 (1) 30.3 4000.5 0.0075 (1) 35.21 1481 0.023 (2) 32.89 4115 0.0079 (1) 31.25 8965.25 0.0034 (1) 31.77 2857 0.011 (1) 35.71 6490 0.0055 (1) 66.66 2500 0.026 (2) 27.77 8518.75 0.0032 (1) 26.51 3817 0.0069 (1) 35.21 7578.25 0.0046 (1) 26.73 3189.25 0.0083 (1) 34.48 1954.75 0.017 (3) 34.6 1307.5 0.026 (2) 36.49 6315.4 0.0057 (1) 32.25 569.33 0.056 (2) 37.73 1244.25 0.03 (2) 28.84 3161 0.009 (1) 31.25 1488 0.021 (2) 29.41 3202.33 0.009 (1) 37.03 9265.25 0.0039 (1) 28.26 2667 0.01 (1) 20.92 3827.375 0.0054 (1) 43.19 1062.5 0.04 (2) 32.05 2545 0.012 (3) 48.78 1214.2 0.04 (2) 34.88 5818.33 0.0059 (1) 23.47 3599 0.0065 (1) G1 (missing DFO Dose) G2 (not missing DFO Dose) Dose of DFO mg/kg/day Serum ferritin µg/L Therapeutic index Dose study Dose of DFO mg/kg/day Serum ferritin µg/L Therapeutic index Dose study 28.84 914 0.031 (2) 29.85 4010.9 0.0074 (1) 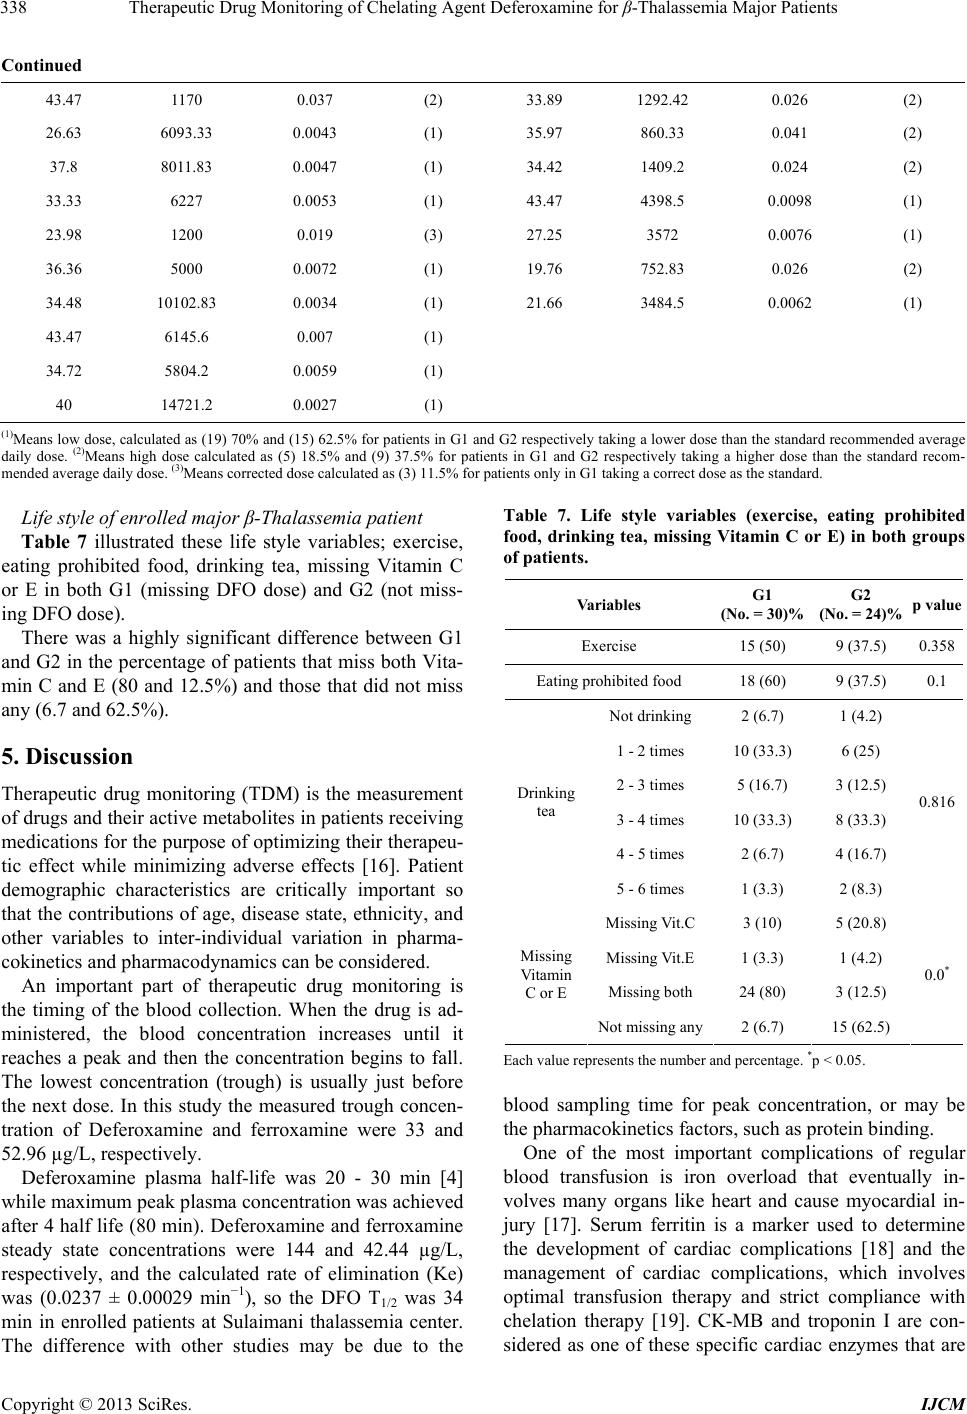 Therapeutic Drug Monitoring of Chelating Agent Deferoxamine for β-Thalassemia Major Patients Copyright © 2013 SciRes. IJCM 338 Continued 43.47 1170 0.037 (2) 33.89 1292.42 0.026 (2) 26.63 6093.33 0.0043 (1) 35.97 860.33 0.041 (2) 37.8 8011.83 0.0047 (1) 34.42 1409.2 0.024 (2) 33.33 6227 0.0053 (1) 43.47 4398.5 0.0098 (1) 23.98 1200 0.019 (3) 27.25 3572 0.0076 (1) 36.36 5000 0.0072 (1) 19.76 752.83 0.026 (2) 34.48 10102.83 0.0034 (1) 21.66 3484.5 0.0062 (1) 43.47 6145.6 0.007 (1) 34.72 5804.2 0.0059 (1) 40 14721.2 0.0027 (1) (1)Means low dose, calculated as (19) 70% and (15) 62.5% for patients in G1 and G2 respectively taking a lower dose than the standard recommended average daily dose. (2)Means high dose calculated as (5) 18.5% and (9) 37.5% for patients in G1 and G2 respectively taking a higher dose than the standard recom- mended average daily dose. (3)Means corrected dose calculated as (3) 11.5% for patients only in G1 taking a correct dose as the standard. Life style of enrolled major β-Thalassemia patient Table 7 illustrated these life style variables; exercise, eating prohibited food, drinking tea, missing Vitamin C or E in both G1 (missing DFO dose) and G2 (not miss- ing DFO dose). There was a highly significant difference between G1 and G2 in the percentage of patients that miss both Vita- min C and E (80 and 12.5%) and those that did not miss any (6.7 and 62.5%). 5. Discussion Therapeutic drug monitoring (TDM) is the measurement of drugs and their active metabolites in patients receiving medications for the purpose of optimizing their therapeu- tic effect while minimizing adverse effects [16]. Patient demographic characteristics are critically important so that the contributions of age, disease state, ethnicity, and other variables to inter-individual variation in pharma- cokinetics and pharmacodynamics can be considered. An important part of therapeutic drug monitoring is the timing of the blood collection. When the drug is ad- ministered, the blood concentration increases until it reaches a peak and then the concentration begins to fall. The lowest concentration (trough) is usually just before the next dose. In this study the measured trough concen- tration of Deferoxamine and ferroxamine were 33 and 52.96 µg/L, respectively. Deferoxamine plasma half-life was 20 - 30 min [4] while maximum peak plasma concentration was achieved after 4 half life (80 min). Deferoxamine and ferroxamine steady state concentrations were 144 and 42.44 µg/L, respectively, and the calculated rate of elimination (Ke) was (0.0237 ± 0.00029 min−1), so the DFO T1/2 was 34 min in enrolled patients at Sulaimani thalassemia center. The difference with other studies may be due to the Table 7. Life style variables (exercise, eating prohibited food, drinking tea, missing Vitamin C or E) in both groups of patients. Variables G1 (No. = 30)% G2 (No. = 24)%p value Exercise 15 (50) 9 (37.5) 0.358 Eating prohibited food 18 (60) 9 (37.5) 0.1 Not drinking 2 (6.7) 1 (4.2) 1 - 2 times 10 (33.3) 6 (25) 2 - 3 times 5 (16.7) 3 (12.5) 3 - 4 times 10 (33.3) 8 (33.3) 4 - 5 times 2 (6.7) 4 (16.7) Drinking tea 5 - 6 times 1 (3.3) 2 (8.3) 0.816 Missing Vit.C 3 (10) 5 (20.8) Missing Vit.E 1 (3.3) 1 (4.2) Missing both 24 (80) 3 (12.5) Missing Vitamin C or E Not missing any2 (6.7) 15 (62.5) 0.0* Each value represents the number and percentage. *p ˂ 0.05. blood sampling time for peak concentration, or may be the pharmacokinetics factors, such as protein binding. One of the most important complications of regular blood transfusion is iron overload that eventually in- volves many organs like heart and cause myocardial in- jury [17]. Serum ferritin is a marker used to determine the development of cardiac complications [18] and the management of cardiac complications, which involves optimal transfusion therapy and strict compliance with chelation therapy [19]. CK-MB and troponin I are con- sidered as one of these specific cardiac enzymes that are  Therapeutic Drug Monitoring of Chelating Agent Deferoxamine for β-Thalassemia Major Patients Copyright © 2013 SciRes. IJCM 339 used for evaluation of heart involvement [20,21]. The present study showed a highly statistically significant dif- ference in serum ferritin level in the two groups studied (non compliant, and compliant), (p ˂ 0.01). According to Sakha et al. (2008) [17], studying LVEF for major thalassemia patients treated with Deferoxamine injection showed that some patients had normal left ven- tricular ejection fraction (LVEF = 50% - 70%), while others had reduced LVEF (20% - 45%). Cardiac markers (Troponin and CK-MB) are not helpful for the recogni- tion of cardiac involvement in major thalassemia, and also do not predict cardiac damage of thalassemia patients, but may be helpful in serial measurement. Echocardiography was performed in this study for en- rolled patients in both groups, all had a normal left ven- tricular ejection fraction (LVEF = 50% - 70%), and there was no statistical difference between the two groups (p = 0.74). Those, who are adequately transfused but who are poorly chelated, may present with dominant right-sided heart involvement [22]. This study confirms that, only 3 patients (15%) from non-compliant group had mild di- lated right ventricular, while there was no complain from the G2 (non missing dose) group. The statistical analysis between the two studied groups showed no significant difference in troponin I level, which was within normal range; this result agrees with the results of Sakha et al. (2008) [17], but disagrees in re- gards to CK-MB. This study showed a statistical signifi- cant difference in CK-MB level, higher than normal level in non-compliant (missing dose) more than compliant group, which indicate myocardial injury. Numerous prospective studies in healthy volunteers have confirmed that high-sensitivity CRP (hsCRP) pre- dicts cardiovascular events (CVEs), while hsCRP is a strong independent predictor of risk of future MI, stroke, peripheral arterial disease, and vascular death [23]. High-sensitivity C-reactive protein may be clinically useful in identifying individuals who are at higher risk for CAD. A high sensitivity C-reactive protein level of less than 1.0 mg/L indicates low risk for cardiovascular disease, between 1.0 to 3.0 mg/L indicates moderate risk and more than 3.0 mg/L indicates high risk [24]. In this study high sensitive CRP showed a statistical significant difference between the two groups (p = 0.027), the re- sults revealed that non-compliant patients (missing dose) are in high risk of developing atherosclerotic cardiovas- cular disease but compliant patients are in average risk, which is due to their levels of serum ferritin. Iron overload is one of the major causes of morbidity in all patients with severe forms of thalassemia. Excess iron in vital organs, even in mild cases of iron overload, increases the risk of for example liver disease (cirrhosis, cancer). Various studies have found that Deferoxamine arrests progressive liver fibrosis even when taken in in- adequate doses, as judged by reduction in liver iron con- centration and improvement in liver function test [25]. There were significant increases in SGPT and SGOT levels in a group of patients that indicate liver damage because of iron overload in their body [26]. The level of liver enzymes was raised in non-compli- ant group than normal range; the raised mean level of all the studied liver enzymes (SGOT, SGPT, serum alkaline phosphatase) showed a statistically significant difference (p > 0.05), in non-compliant group compared to the com- pliant one. There was a significant difference in blood urea be- tween the studied groups, higher than normal range [27]. The results of this study agree with it, since there was a significant increase in serum urea in transfusion depend- ent β-thalassemia patients using Deferoxamine. Compli- cations from continuous therapy may arise due to iron overload and toxicity of iron chelating therapy, which may affect many organs in the body including the renal system. Renal damage can be attributed to chronic ane- mia, iron over load and deferroxamine therapy [28]. The- refore monitoring of renal functions is recommended. Total serum bilirubin was measured in both groups and there was no statistical difference between them, but the value was higher than normal range, which may be ex- plained by the study of Kassab-Chekira et al. (2003) [29], who mentioned that bilirubin increase observed in beta- thalassemia may be related to hemolysis process. There was a significant decrease in serum creatinine in transfusion dependent β-thalassemia patients using De- feroxamine. This result agrees with the findings of You- nus et al. (2012) [27] that determine low-level serum cre- atinine in groups of patients above 12 years old. This sig- nificant decrease in the mean serum creatinine level may be related to the lower body mass index due to growth retardation and lower muscle mass, usually encountered in β-thalassemia patients [30]. Growth retardation occurs in both groups at a rate of 46.7 and 45.8% respectively, but no statistical significant difference was shown between the two groups of patients. This means that growth retardation in these patients is multi factorial, that is, it may have occur due to iron over- load, Deferoxamine use and/or serum zinc level which has adversely affected their growth velocity [31]. According to the study of Aziz et al. 2009 [32], albu- min decreased significantly in patients with iron overload; this was similar to the results obtained by Livreaet al. (1996) [33] which shows that serum albumin was in the normal range in all thalassemia patients. This study agrees with the above-mentioned studies, in which measured serum albumin for all enrolled patients, were signifi- cantly lower in non-adherent patients more than those ad- herents to treatment, but both were within normal range. Comparing the two studied groups, there was no sta-  Therapeutic Drug Monitoring of Chelating Agent Deferoxamine for β-Thalassemia Major Patients Copyright © 2013 SciRes. IJCM 340 tistical significant difference in WBCs and platelet count, but the WBCs in both groups were slightly higher. High platelet in both groups of patients may be due to the number of patients having splenoctomy. This result agrees with the study of Wirawan et al. (2004) [34], which observed that leukocytosis and thrombocytosis in post splenoctomy groups is due to no more pooling and phagocytosis of WBCs and platelets after splenoctomy [35]. Calcium level will be low in iron overload β-thalas- semia patients due to hypoparathyroidism [36], because iron precipitation in tissues of parathyroid gland causes insufficient production of parathyroid and calcitonin hor- mones that regulate normal level of calcium in the blood [37]. This study showed that calcium level was signifi- cantly different in both groups. According to the data published by Novartis pharma- ceutical manufacturing factory in 2011 [38], Deferoxami- nemesylate adequate average daily doses are 20- to 60- mg/kg-body weight. Patients with a serum ferritin level of less than 2000 μg/L require about 25 mg/kg/day; pa- tients with a serum ferritin level between 2000 and 3000 μg/L require about 35 mg/kg/day and patients with higher serum ferritin levels may require up to 55 mg/kg/day. It is inadvisable to regularly exceed an average daily dose of 50 mg/kg/day except when very intensive chelation is needed in patients who are no longer growing. If ferritin values fall below 1000 μg/L, the risk of Desferal toxicity increases. Therefore, it is important to monitor these pa- tients carefully and to consider lowering the total weekly dose. Alternatively, the mean daily dose may be adjusted ac- cording to the ferritin value to keep the therapeutic index less than 0.025 (that is, mean daily dose of Desferal in mg/kg divided by the serum ferritin level in μg/L is be- low 0.025). The therapeutic index is a valuable tool in protecting the patient from excess chelation, but it is not a substitute for careful clinical monitoring. According to the above dosage information, dose of Deferoxamine in these patients were studied and it showed that 66.66% of patients taking a lower dose than the standard recommended average daily dose required (un- related to their serum ferritin levels) showed a high level of serum ferritin that eventually resulted in iron over load complications. Also, 27.45% of the patients who were administered a higher dose than the standard recom- mended average daily dose required, unrelated to their serum ferritin levels, showed Deferoxamine toxicity, while 5.88% of these patients were administered the ex- act right recommended dose of Deferoxamine The study of urinary iron excretion was recommended for subcutaneous DFO infusion, the results from this study showed that the urinary iron excretion in both groups of patients was low compared to the study of Dubey et al. (1992) [39] (p ≤ 0.05), because after infu- sion of Deferoxamine there was a significant increase of mean urinary and faecal iron excretion (p < 0001). On average, 45% of iron was eliminated through urine while 55% was through stool [40]. The data suggests that the amount of iron chelated in vivo is related to an increase in the size of an intermediate chelatable pool rather than the total amount of the iron load. The well-recognized delay in urinary iron excretion appears to be related to active tuular reabsorption of ferrioxamine [41]. Desferal has affinity for Cu2± and Zn2±, and has some neurotoxic effects, which may be due to its ability to chelate copper or zinc. After the infusion of DFO, faecal and urinary zinc and copper excretion were significantly increased; the depletion of these elements may be re- sponsible for the neurotoxic effect of the drug [40]. This study confirms that, there was a statistical significant dif- ference between the two groups of patients; (p ≤ 0.05) as regards urinary Zn and Cu excretion. Also the depletion of iron, zinc, and copper may be related to the retinal abnormalities [42,43]. More severe retinal or optic nerve toxicity, or both, that consisted of night blindness, field defects, visual loss, loss of color vision, and delayed vis- ual evoked potential has been detected after intravenous or subcutaneous infusion of similar large doses of De- feroxamine for a prolonged period [40,44]. The most frequent adverse effects of DFO are local reactions at the site of infusion, such as pain, swelling, induration, erythema, burning, pruritus, wheals and rash, occasionally accompanied by fever, chills and malaise. Other complications mainly associated with high doses of DFO in young patients are low ferritin values [45]. This monitoring study found that there was no statistical significant difference between the two studied groups as regards the site of DFO S.C. injection; abdomen, upper arm or both abdomen and upper arm. Follow up of the enrolled patients, revealed the common side effects of DFO injection site to include pain, swelling, infiltration, erythema, and pruritus. There was no statistical correla- tion between sites used for injection and the side effects at the site of the injection; this indicates that Deferoxam- ine dose injection was not the cause of the side effects experience by patients. It was also discovered from this study that the adverse effects of Deferoxamine include headache, dizziness, vis- ual disturbance, hearing problem, nausea, vomiting, sto- mach pain, urticarial, arthralgia-myalgia, and bone pain (˃10%), with no statistical significant difference between the studied groups. Hypotension was common (˃1%), in both groups with no statistical significant difference be- tween the two groups. Diarrhea (G1, 25% and G2, 4.2%), and Pyrexia (G1, 63.3%; G2, 37.5%), which was very common in both groups of patients showed significant differences. 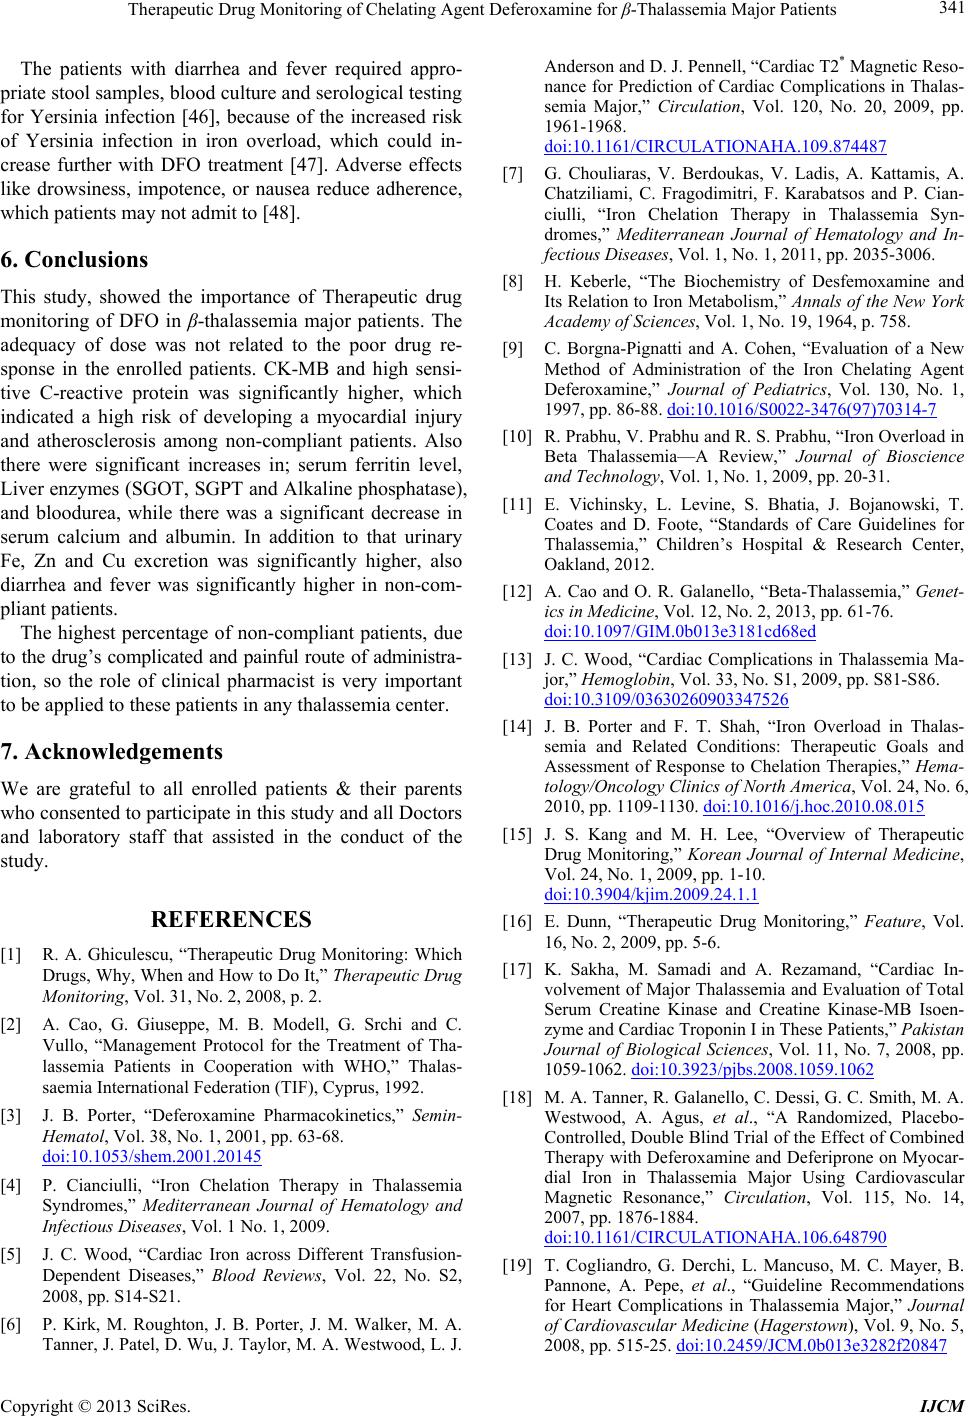 Therapeutic Drug Monitoring of Chelating Agent Deferoxamine for β-Thalassemia Major Patients Copyright © 2013 SciRes. IJCM 341 The patients with diarrhea and fever required appro- priate stool samples, blood culture and serological testing for Yersinia infection [46], because of the increased risk of Yersinia infection in iron overload, which could in- crease further with DFO treatment [47]. Adverse effects like drowsiness, impotence, or nausea reduce adherence, which patients may not admit to [48]. 6. Conclusions This study, showed the importance of Therapeutic drug monitoring of DFO in β-thalassemia major patients. The adequacy of dose was not related to the poor drug re- sponse in the enrolled patients. CK-MB and high sensi- tive C-reactive protein was significantly higher, which indicated a high risk of developing a myocardial injury and atherosclerosis among non-compliant patients. Also there were significant increases in; serum ferritin level, Liver enzymes (SGOT, SGPT and Alkaline phosphatase), and bloodurea, while there was a significant decrease in serum calcium and albumin. In addition to that urinary Fe, Zn and Cu excretion was significantly higher, also diarrhea and fever was significantly higher in non-com- pliant patients. The highest percentage of non-compliant patients, due to the drug’s complicated and painful route of administra- tion, so the role of clinical pharmacist is very important to be applied to these patients in any thalassemia center. 7. Acknowledgements We are grateful to all enrolled patients & their parents who consented to participate in this study and all Doctors and laboratory staff that assisted in the conduct of the study. REFERENCES [1] R. A. Ghiculescu, “Therapeutic Drug Monitoring: Which Drugs, Why, When and How to Do It,” Therapeutic Drug Monitoring, Vol. 31, No. 2, 2008, p. 2. [2] A. Cao, G. Giuseppe, M. B. Modell, G. Srchi and C. Vullo, “Management Protocol for the Treatment of Tha- lassemia Patients in Cooperation with WHO,” Thalas- saemia International Federation (TIF), Cyprus, 1992. [3] J. B. Porter, “Deferoxamine Pharmacokinetics,” Semin- Hematol, Vol. 38, No. 1, 2001, pp. 63-68. doi:10.1053/shem.2001.20145 [4] P. Cianciulli, “Iron Chelation Therapy in Thalassemia Syndromes,” Mediterranean Journal of Hematology and Infectious Diseases, Vol. 1 No. 1, 2009. [5] J. C. Wood, “Cardiac Iron across Different Transfusion- Dependent Diseases,” Blood Reviews, Vol. 22, No. S2, 2008, pp. S14-S21. [6] P. Kirk, M. Roughton, J. B. Porter, J. M. Walker, M. A. Tanner, J. Patel, D. Wu, J. Taylor, M. A. Westwood, L. J. Anderson and D. J. Pennell, “Cardiac T2* Magnetic Reso- nance for Prediction of Cardiac Complications in Thalas- semia Major,” Circulation, Vol. 120, No. 20, 2009, pp. 1961-1968. doi:10.1161/CIRCULATIONAHA.109.874487 [7] G. Chouliaras, V. Berdoukas, V. Ladis, A. Kattamis, A. Chatziliami, C. Fragodimitri, F. Karabatsos and P. Cian- ciulli, “Iron Chelation Therapy in Thalassemia Syn- dromes,” Mediterranean Journal of Hematology and In- fectious Diseases, Vol. 1, No. 1, 2011, pp. 2035-3006. [8] H. Keberle, “The Biochemistry of Desfemoxamine and Its Relation to Iron Metabolism,” Annals of the New York Academy of Sciences, Vol. 1, No. 19, 1964, p. 758. [9] C. Borgna-Pignatti and A. Cohen, “Evaluation of a New Method of Administration of the Iron Chelating Agent Deferoxamine,” Journal of Pediatrics, Vol. 130, No. 1, 1997, pp. 86-88. doi:10.1016/S0022-3476(97)70314-7 [10] R. Prabhu, V. Prabhu and R. S. Prabhu, “Iron Overload in Beta Thalassemia—A Review,” Journal of Bioscience and Technology, Vol. 1, No. 1, 2009, pp. 20-31. [11] E. Vichinsky, L. Levine, S. Bhatia, J. Bojanowski, T. Coates and D. Foote, “Standards of Care Guidelines for Thalassemia,” Children’s Hospital & Research Center, Oakland, 2012. [12] A. Cao and O. R. Galanello, “Beta-Thalassemia,” Genet- ics in Medicine, Vol. 12, No. 2, 2013, pp. 61-76. doi:10.1097/GIM.0b013e3181cd68ed [13] J. C. Wood, “Cardiac Complications in Thalassemia Ma- jor,” Hemoglobin, Vol. 33, No. S1, 2009, pp. S81-S86. doi:10.3109/03630260903347526 [14] J. B. Porter and F. T. Shah, “Iron Overload in Thalas- semia and Related Conditions: Therapeutic Goals and Assessment of Response to Chelation Therapies,” Hema- tology/Oncology Clinics of North America, Vol. 24, No. 6, 2010, pp. 1109-1130. doi:10.1016/j.hoc.2010.08.015 [15] J. S. Kang and M. H. Lee, “Overview of Therapeutic Drug Monitoring,” Korean Journal of Internal Medicine, Vol. 24, No. 1, 2009, pp. 1-10. doi:10.3904/kjim.2009.24.1.1 [16] E. Dunn, “Therapeutic Drug Monitoring,” Feature, Vol. 16, No. 2, 2009, pp. 5-6. [17] K. Sakha, M. Samadi and A. Rezamand, “Cardiac In- volvement of Major Thalassemia and Evaluation of Total Serum Creatine Kinase and Creatine Kinase-MB Isoen- zyme and Cardiac Troponin I in These Patients,” Pakistan Journal of Biological Sciences, Vol. 11, No. 7, 2008, pp. 1059-1062. doi:10.3923/pjbs.2008.1059.1062 [18] M. A. Tanner, R. Galanello, C. Dessi, G. C. Smith, M. A. Westwood, A. Agus, et al., “A Randomized, Placebo- Controlled, Double Blind Trial of the Effect of Combined Therapy with Deferoxamine and Deferiprone on Myocar- dial Iron in Thalassemia Major Using Cardiovascular Magnetic Resonance,” Circulation, Vol. 115, No. 14, 2007, pp. 1876-1884. doi:10.1161/CIRCULATIONAHA.106.648790 [19] T. Cogliandro, G. Derchi, L. Mancuso, M. C. Mayer, B. Pannone, A. Pepe, et al., “Guideline Recommendations for Heart Complications in Thalassemia Major,” Journal of Cardiovascular Medicine (Hagerstown), Vol. 9, No. 5, 2008, pp. 515-25. doi:10.2459/JCM.0b013e3282f20847  Therapeutic Drug Monitoring of Chelating Agent Deferoxamine for β-Thalassemia Major Patients Copyright © 2013 SciRes. IJCM 342 [20] J. Caddel, “Metabolic and Nutritional Disease and Dis- ease in Tropics. Moss and Adams Heart Disease in In- fants, Children and Adolescents,” 6th Edition, Lippincott, Williams and Wilkins, Philadelphia, 2000, pp. 1266-1267. [21] D. Defour, J. Lott and J. Henry, “Clinical Enzymology. Clinical Diagnosis and Management by Laboratory Me- thods,” 20th Edition, Saunders, Philadelphia, 2001, pp. 296-303. [22] A. Aessopos, V. Berdoukas and M. Tsironi, “The Heart in Transfusion Dependent Homozygous Thalassemia Today Prediction, Prevention and Management,” European Jour- nal of Haematology, Vol. 80, No. 2, 2008, pp. 93-106. [23] N. Rifai and P. Ridker, “High-Sensitivity C-Reactive Protein: A Novel and Promising Marker of Coronary Heart Disease,” Clinical Chemistry, Vol. 47, No. 3, 2001, pp. 403-411. [24] R. McPherson, J. Frohlich, G. Fodor and J. Genest, “Ca- nadian Cardiovascular Society Position Statement—Re- commendations for the Diagnosis and Treatment of Dy- slipidemia and Prevention of Cardiovascular Disease,” Canadian Journal of Cardiology, Vol. 22, No. 11, 2006, pp. 913-927. doi:10.1016/S0828-282X(06)70310-5 [25] A. Sachdeva, R. Misra and S. Yadav, “Desferal in Thalas- semia,” In: A. Sachdeva, M. R. Lokeshwar and N. Shah, Eds., Hemoglobinopathies, Jaypee Publications, New Delhi, 2006, pp. 148-156. [26] P. Tirgar and T. Desai, “Investigation into Beneficial Ef- fects of Triticum aestivum (Wheat Grass) in Iron Over- loads Complications,” Pharmacologyonline, Vol. 2, 2011, pp. 900-920. [27] Z. Younus, Y. Alhially and A. DallalBashi, “Evaluation of Conventional Renal Function Tests in β-Thalassemia Major Patients in Nineveh Province,” Tikrit Journal of Pharmaceutical Sciences, Vol. 8, No. 1, 2012, pp. 6-14. [28] M. Mohkam, B. S. Shamsian, A. Gharib, S. Nariman and M. T. Arzanian, “Early Markers of Renal Dysfunction in Patients with Beta-Thalassemia Major,” Pediatric Neph- rology, Vol. 23, No. 6, 2008, pp. 971-976. doi:10.1007/s00467-008-0753-x [29] A. Kassab-Chekira, S. Laradia, S. Ferchichia, A. Haj Khelila, M. Fekib, F. Amric, H. Selmid, M. Bejaouie and A. di Mileda, “Oxidant, Antioxidant Status and Metabolic Data in Patients with Beta-Thalassemia,” Clinica Chimica Acta, Vol. 338, No. 1-2, 2003, pp. 79-86. doi:10.1016/j.cccn.2003.07.010 [30] C. B. Modell, “The Pathophysiology of Beta-Thalassae- mia Major,” Journal of Clinical Pathology. Supplement (Royal College of Pathologists), Vol. 8, 1974, pp. 12-18. [31] A. Mahyar, “The Preventive Role of Zinc from Commu- nicable and Non-Communicable Diseases in Children,” NCD Malaysia, Vol. 4, No. 2, 2005, pp. 21-26. [32] B. Aziz, M. Al-Kataan and W. Ali, “Lipid Peroxidation and Antioxidant Status in β-Thalassemic Patients: Effect of Iron Overload,” Iraqi Journal of Pharmaceutical Sci- ences, Vol. 18, No. 2, 2009, pp. 25-32. [33] M. A. Livrea, L. Tesoriere, A. M. Pintaudi, A. Calabrese, A. Maggio, H. J. Freisleben, D. D’Arpa, R. D’Anna and A. Bongiorno, “Oxidative Stress and Antioxidant Status in Beta-Thalassemia Major: Iron Overload and Depletion of Lipid Soluble Antioxidants,” Blood, Vol. 88, No. 9, 1996, pp. 3608-3614. [34] R. Wirawan, S. Setiawan and D. Gatot, “Peripheral Blood and Hemoglobin Electrophoresis Pattern in Beta Thalas- semia Major Patients Receiving Repeated Blood Transfu- sion,” Medical Journal of Indonesia, Vol. 13, 2004, pp. 8-16. [35] S. B. McKenzie, “Nonmalignant Granulocyte and Mono- cyte Disorders,” In: S. B. McKenzie, Ed., Textbook of He- matology, 2nd Edition, Williams & Wilkins, Baltimore, 1996, pp. 275-280. [36] A. Tantway, M. El Kholy, T. Moustafa and H. Elsedfy, “Bone Mineral Density and Calcium Metabolism in Ado- lescent with Beta Thalassemia Major,” Pediatric Endo- crinology Reviews, Vol. 6, Suppl. 1, 2008, pp. 132-135. [37] J. C. Barton, “Chelation Therapy for Iron Overloads,” Current Gastroenterology Reports, Vol. 9, 2007, pp. 74- 82. doi:10.1007/s11894-008-0024-9 [38] Pharmaceutical Manufacturing Factory of Desferrioxa- mine (DESFERAL)® Novartis, “Australia Prescribing In- formation,” 2011. www.novartis.com.au [39] A. Dubey, S. Kumar, P. Choudhury, B. Talukdar and R. Puri, “Desferrioxamine Induced Urinary Iron Excretion in Thalassemia,” Indian Pediatrics, Vol. 30, No. 6, 1993, pp. 775-778. [40] S. De Virgilis, F. Frau and G. Sanna, “Iron Elimination Following Intravenous Desferrioxamine Infusion in Pa- tients with Thalassemia Major,” Pediatric Hematology- Oncology, Vol. 2, No. 1, 1985, pp. 47-48. [41] M. R. Summers, A. Jacobs, D. Tudway, P. Perera and C. Ricketts, “Studies in Desferrioxamine and Ferrioxamine Metabolism in Normal and Iron-Loaded Subjects,” Brit- ish Journal of Haematology, Vol. 42, No. 4, 1979, pp. 547-555. doi:10.1111/j.1365-2141.1979.tb01167.x [42] A. Prasad, “Clinical, Biochemical and Nutritional Spec- trum of Zinc Deficiency in Human Subjects: An Update,” Nutrition Reviews, Vol. 41, No. 7, 1983, pp. 197-208. doi:10.1111/j.1753-4887.1983.tb07155.x [43] Z. A. Karciogluo, “Zinc in the Eye,” Survey of Ophthal- mology, Vol. 27, No. 2, 1982, pp. 114-122. doi:10.1016/0039-6257(82)90195-3 [44] S. C. Davies, R. E. Marcus, J. L. Hungerford, M. H. Miller, G. B. Arden and E. R. Huehns, “Ocular Toxicity of High Dose Intravenous Desferrioxamine,” The Lancet, Vol. 322, No. 8343, 1983, pp. 181-184. doi:10.1016/S0140-6736(83)90170-8 [45] R. Galanello and R. O. Galanello, “Beta-Thalassemia,” Orphanet Journal of Rare Diseases, Vol. 5, 2010, p. 11. doi:10.1186/1750-1172-5-11 [46] J. Kushner, J. Porter and N. Olivieri, “Secondary Iron Overload,” American society for Hematology, 2011, pp. 47-61. [47] R. Robins-Browne and J. Prpic, “Effects of Iron and Des- ferrioxamine on Infections with Yersinia Enterocolitica,” Infection and Immunity, Vol. 47, No. 3, 1985, pp. 774- 779. [48] M. C. Stuart, M. Kouimtzi and S. R. Hill, “WHO Model Formulary,” World Health Organization, Geneva, 2009. http://www.who.int/emlib/
|