 International Journal of Clean Coal and Energy, 2013, 2, 27-34 doi:10.4236/ijcce.2013.22B007 Published Online May 2013 (http://www.scirp.org/journal/ijcce) Prospects for Coalbed Methane and Shale Gas in a Carbon-Constrained World: A Preliminary Analysis Takayuki Takeshita Transdisciplinary Initiative for Global Sustainability, The University o f Tokyo, T okyo, Japan Email: takeshita@ir3s.u-tokyo.ac.jp Received April 16, 2013; revised June 2, 2013; accepted April 24, 2013 ABSTRACT Using a regionally disaggregated global energy system model with a detailed treatment of the natural gas resource base, this paper analyzes the competitiveness of coalbed methane and shale gas in the global primary energy mix and the cost-optimal pattern of their production in regional detail over the period 2010-2050 under a constraint of halving global energy-related CO2 emissions in 2050 compared to the 2000 level. It is first shown that neither coalbed methane nor shale gas could become an important fuel in the global primary energy mix throughout the time horizon, although each of them could become an important source of world natural gas production from around 2030 onwards. It is then shown that unlike findings of previous studies, coalbed methane would be more attractive than shale gas as a primary energy source globally under the CO2 constraint used h ere. The results ind icate that North America continues to be th e world’s largest coalbed methane producer until 2030, after which China overtakes North America and retains this position until 2050. Also, India, Russia, South Africa, and Australia contribute noticeably to world coalbed methane production. The results also indicate that North America continues to dominate world shale gas production until 2040, after which a number of world regions, notably India, Europe, and China, begin to participate visibly in world shale gas production. Keywords: Coalbed Methane; Shale Gas; CO2 Mitigation; Regionally Detailed Analysis; Global Energy System Model 1. Introduction Driven by the unconventional gas revolution that has taken hold in North America in recent years, world un- convention al gas produ ctio n ha s been in creasing stead ily. Already, the rapidly expanding development of uncon- ventional gas has reshaped the US gas market and sub- stantially affected the global gas market. Given the large resource base of unconventional gas and the growing demand for affordable, clean natural gas worldwide, this trend is likely to continu e in the fu ture. As a consequence, it is well possible that unconventional gas will become one of the most important fuels in the future global pri- mary energy mix, and that unconventional gas produc- tion will have a huge impact on the future global energy landscape. Under these circumstances, unconventional gas and its prospects are receiving significant attention globally. Thus, several studies hav e so far constructed quantitative scenarios of future unconventional gas production. Among all previous related studies, the special report in the International Energy Agency’s (IEA) World Energy Outlook 2011 [1] seems to be the most elaborate one. It presented projections of world natural gas production by region and world natural gas production by type through to 2035. It obtained two important findings relating to unconventional gas production. First, the share of un- conventional gas in total global gas supplies will rise continuously, reaching 24% in 2035. Second, most of the increase in unconventional gas production comes from shale gas and coalbed methane. However, there are some drawbacks in this IEA study. First, projections were performed without the interna- tional target to avoid dangerous climate change. The re- sults of the projections suggest the long-term global av- erage temperature rise of over 3.5 degrees Celsius above pre-industrial levels. Second, it does not provide a re- gional split of the production of each type of unconven- tional gas over the projection period. Third, projections were performed over the period to 2035 , so it is unable to assess the long-term prospects for unconventional gas. In this context, this paper explores the prospects for coalbed methane and shale gas in regional detail over the period to 2050 under a stringent climate stabilization constraint (i.e., a halving of global energy-related CO2 emissions in 2050 compared to the 2000 level). In the first step, the competitiveness of coalbed methane and shale gas in the global primary energy mix under this constraint is assessed over the long term. In the second step, the cost-optimal global pattern of their production under this constraint is derived in regional detail over the Copyright © 2013 SciRes. IJCCE  T. TAKESHITA 28 long term. Due to space limitations, the focus of this pa- per is confined to the competitiveness of coalbed meth- ane and shale gas and their production pattern only. These analyses are done by using a regionally disaggre- gated global energy system model with 70 regions (REDGEM70) [2 ,3], which is characterized by a detailed technological representation. 2. Methodology 2.1. Overview of the REDGEM70 Model REDGEM70 is a technology-rich, bottom-up global en- ergy systems optimization model formulated as an in- tertemporal linear programming problem (see [3] for a schematic representation of the structure of the model). With a 5% discount rate, the model is designed to deter- mine the cost-optimal energy strategy (e.g., the cost-op- timal choice of technologies and fuels) from 2010 to 2050 at 10-year intervals for each of 70 world regions so that total discounted global energy system costs are minimized under constraints on the satisfaction of exo- genously given energy end-use demands, the availability of primary energy resources, material and energy bal- ances, the maximum market growth rates of new tech- nologies and fuels, etc. In the model, price-induced en- ergy demand reductions and energy efficiency improve- ments, fuel switching to less carbon-intensive fuels, and CO2 capture and storage in geologic formations are the three options for CO2 emissions reduction. Furthermore, in the current version of the model used in this study, there is also a constraint that global en- ergy-related CO2 emissions in 2050 are to be halved compared to the 2000 level. This constraint is imposed because the Intergovernmental Panel on Climate Change (IPCC) has concluded that a 50% to 80% reduction of global CO2 emissions by 2050 compared to the 2000 level can limit the long-term global mean temperature rise to 2.0 degrees Celsius above pre-industrial levels [4], which is now recognized as the ultimate goal by most world leaders and experts. The model has a full flexibil- ity in where and how CO2 emissions reduction is achieved to meet this constraint. As described above, REDGEM70 uses 70 world re- gions. Figure 1 shows how the 70 world regions are de- fined in the model. These 70 regions are categorized into “energy production and consumption regions” and “en- ergy production regions”. The whole world was first di- vided into the 48 energy production and consumption regions to which future energy end-use demands are al- located. The 22 energy production regions, which are defined as geographical points, were then distinguished from the energy production and consumption regions to represent the geographical characteristics of the areas endowed with large amounts of fossil energy resources. While the 48 energy production and consumption regions cover the global final energy consumption, all the en- ergy-related activities except final energy consumption are conducted in each of the two region types in the model. Such a detailed regional disaggregation enables the explicit consideration of regional characteristics in terms of energy resource supply, energy demands, geog- raphy, and climate. Representative cities in energy production and consumption regions Representative s ites in energy production regions Figure 1. Regional disaggregation of REDGEM70. Copyright © 2013 SciRes. IJCCE  T. TAKESHITA 29 Future trajectories for energy end-use demands were estimated as a function of those for socio-economic driving forces such as population and income in the in- termediate B2 scenario developed by [5]. Allocation of the energy end-use demand estimates to the 48 energy production and consumption regions was done by using country- and state-level statistics/estimates (and projec- tions if available) on population, income, geography, energy use by type, and transport activity by mode, and by taking into account the underlying storyline of the B2 scenario that regional diversity might be somewhat pre- served throughout the 21st century. Assumptions on the availability and extraction cost of fossil energy resources and uranium resources were de- rived from [6] and [7], respectively. A detailed descrip- tion of the modeling of the natural gas resource base is given in Section 2.2. There is one important note regard- ing the treatment of exhaustible resources in this model- ing analysis. To avoid excessive exploitation of ex- haustible primary energy resources in the first h alf of the century, the model was actually run over the period 2010-2100, and then the results of this simulation are shown for the period 2010-2050. For non-biomass renewable resources, electricity sup- ply potentials and electricity generation costs by world region are exogenous inputs to the model, which were obtained from [8,9]. For biomass resources, the model considers not only terrestrial biomass, but also waste biomass. Data for these biomass resources are provided in [10]. These resource availability estimates were then allocated to the 70 model regions by using country-, state-, and site-level statistics/estimates. REDGEM70 considers the entire supply chain of natural gas, which includes natural gas production, inter- regional natural gas transportation by pipeline or lique- fied natural gas tanker ship, natural gas storage, its con- version into secondary energy, intraregional natural gas distribution, and its final supply at retail sites. In the model, natural gas can be converted into high- and low- temperature heat, electricity, hydrogen, methanol, di- methyl ether, and Fischer-Tropsch synfuels. It can also be used as a fuel for road vehicles (excluding motorized two-wheelers), large ships, and aircraft and feedstock for industrial use. 2.2. Modeling of the Natural Gas Resource Base In addition to conventional gas, REDGEM70 considers three types of unconventional gas, including coalbed methane, shale gas, and other unconventional gas such as tight gas and deep gas. Gas hydrates are not included because it is presently unclear if and when their potential can ever be used [11]. The resource base estimates of conventional gas and these three types of unconventional gas by each of 18 world regions are taken from [6]. Fur- thermore, the estimates of the potential for enhanced coalbed methane (ECBM) recovery from CO2 injection by each of seven world regions are taken from [12,13]. The global resource base of conventional gas, coalbed methane, shale gas, and other unconventional gas amounts to 12,213 exajoules, 7,520 exajoules, 9,281 exajoules, and 13,016 exajoules, respectively. The conventional gas resource base estimates by each of 18 world regions were allocated to the 70 model re- gions by using data from [11,14,15]. The stepwise supply cost curves of conventional gas (consisting of three steps) were then developed for each of the 70 model regions from global and regional data on the range of conven- tional gas productio n costs, which do not includ e taxes or royalties [1,6,16-18]. Figure 2 illustrates the resulting aggregate global conventional gas supply cost curve. Following the approach taken by [16], the coalbed methane resource base estimates (including those of the potential for ECBM recovery from CO2 injection) by each world region were allocated to the 70 model regions by linking its regional distribution to that of the anthra- cite and bituminous coal resource base, which was esti- mated from [12,19,20]. Similar to the development of the conventional gas supply cost curves above, the stepwise supply cost curves of coalbed methane (consisting of three steps) were then developed for each of the 70 mod- el regions from global and regional data on the range of coalbed methane production costs, which do not include taxes or royalties [1,6,12,13,16-18]. Regional variation in production costs of coalbed methane (excluding ECBM) was estimated using regional data on them [1,16,18] and assuming that they are lower for regions with rich coal- bed methane production experience (implying the exis- tence of production skills and supply infrastructure) and the large coalbed methane resource base. Figure 2 illus- trates the resulting aggregate global coalbed methane supply cost curve. 0 5 10 15 20 03000 6000 90001200015000 Pr oductioncost(US$ 2000 /GJ) EJ 0 5 10 15 20 03000 6000 90001200015000 Pr oductioncost(US$ 2000 /GJ) EJ 0 5 10 15 20 03000 6000 90001200015000 Pr oductioncost(US$ 2000 /GJ) EJ 0 5 10 15 20 03000 6000 90001200015000 Pr oductioncost(US$ 2000 /GJ) EJ Coalbed methane Conventionalgas Other unconventionalgas Shalegas Figure 2. Aggregate world supply cost curves for conven- tional and unconventional natural gas. Copyright © 2013 SciRes. IJCCE  T. TAKESHITA 30 For shale gas, a lack of comprehensive world-wide resource potential data makes it difficult to derive accu- rate estimates of the regional distribution of its resource base by the 70 model regions. Specifically, there seem not to be reliable shale gas resource potential data for regions except the US and the 32 countries examined by [21]. Accordingly, the estimates of the shale gas resource base in the US taken from [6] were allocated to the six US regions of the model by using data from [18,22,23]. On the other hand, the estimates of the shale gas resource base in the other world regions taken from [6] were allo- cated to the 64 model regions by using data from [21,22] and by following the assumption made by [16] that its regional distribution is linked to that of the in-place shale volume given by [16]. The stepwise supply cost curves of shale gas (consisting of three steps) were then devel- oped for each of the 70 model regions from global and regional data on the range of shale gas production costs, which do not include taxes or royalties [1,6,16-18,23]. Regional variation in shale gas production costs was es- timated using regional data on them [16,18,23] and as- suming that they are lower for regions with rich shale gas production experience. Figure 2 illustrates the resulting aggregate global shale gas supply cost curve. Following the approach taken by [16], th e estimates of the other unconventional gas resource base by each of 18 world regions were allocated to the 70 model regions by linking its regional distribution to that of the conven- tional gas resource base. The stepwise supply cost curves of other unconventional gas (consisting of three steps) were then developed for each of the 70 model regions from global and regional data on the range of its produc- tion costs, which do not include taxes or royalties [1,6,16-18]. Regional variation in its production costs was estimated using regional data on them [1,16,18] and assuming that they are lower for regions with rich pro- duction experience of other unconventional gas and its large resource bases. Figure 2 illustrates the resulting aggregate global supply cost curve of other unconven- tional gas. In the last step, royalties are added to gas production costs described above. Royalties from gas production were estimated at US$2000 0.59 per gigajoule of gas, compared to US$2000 1.77 per gigajoule of crude oil and US$2000 0.44 per gigajoule of coal [19]. This sum is re- garded as actual gas production costs and is used as an exogenous inpu t to the model. In the model, taxes are no t included as part of energy system costs. 3. Results and Discussion 3.1. Competitiveness of Coalbed Methane and Shale Gas Figure 3 shows the evolution of the world total primary 0 100 200 300 400 500 600 700 800 20102020203020402050 Worldtotalprimaryenergysupply(EJ/year) Solar Wind Geo thermal Hydro Biomass Nu clear Otherunconv.gas Shalegas Coalbedme th a n e Conv.naturalgas Crudeoil Coal Figure 3. World total primary energy supply. energy supply (TPES). The substitution accounting method is used for reporting TPES. It can be seen that natural gas continues to be an important primary energy source throughout the time horizon. The share of natural gas in the world TPES overtakes that of coal by 2020 to become the second-most important fuel in the global primary energy mix from 2020 onwards. The share of natural gas in the world TPES increases until 2030 but begins to decrease thereafter, reaching 18.4% in 2050. Also, in absolute terms, world natural gas production reaches its peak in 2030 with a slightly declining trend thereafter. Under the stringent CO2 emissions reduction constraint, non-fossil fuels (such as nuclear and renew- ables) account for an increasing share in the world TPES at the expense of fossil fuels. Although the share of unconventional gas in world natural gas production is small in the early time periods, unconventional gas becomes increasingly competitive over time. Its share of world natural gas production in- creases from 15.1% in 2010 to 44.6% in 2050, implying that about half of world natural gas production comes from unconventional sources in 2050. Such an increased participation of unconventional gas leads to an increase in its share of the global primary energy mix: the share of unconventional gas in the world TPES increases from 3.3% in 2010 to 9.8% in 2040 and then decreases to 8.2% in 2050. This decline in the share of unconven- tional gas in 2050 is due to the declining share of natural gas in the world TPES in the second half of the time ho- rizon. It can therefore be argued that unconventional gas could constitute one of the pillars of the global primary energy mix from around 2030 onwards. Among all types of unconventional gas sources, other unconventional gas (mainly tight gas) has the largest share of world un convention al gas pro duction un til 2020 . After that, coalbed methane continues to be the most important unconventional gas source worldwide: its share of world natural gas production increases from 2.7% in 2010 to 19.4% in 2050. Over the period 2040- Copyright © 2013 SciRes. IJCCE 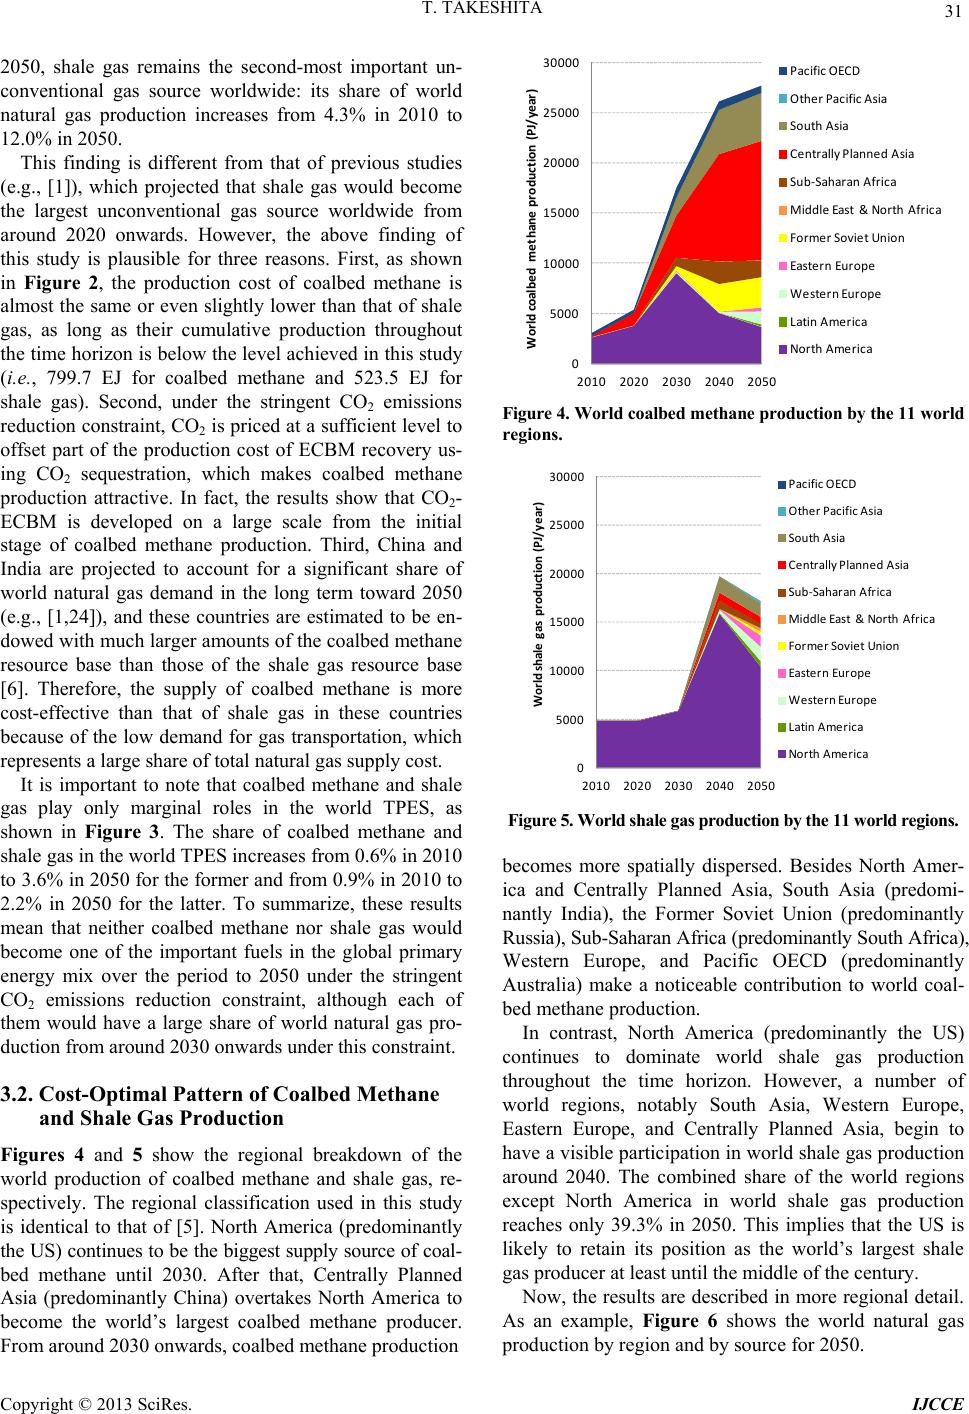 T. TAKESHITA 31 2050, shale gas remains the second-most important un- conventional gas source worldwide: its share of world natural gas production increases from 4.3% in 2010 to 12.0% in 2050. This finding is different from that of previous studies (e.g., [1]), which projected that shale gas would become the largest unconventional gas source worldwide from around 2020 onwards. However, the above finding of this study is plausible for three reasons. First, as shown in Figure 2, the production cost of coalbed methane is almost the same or even slightly lower than that of shale gas, as long as their cumulative production throughout the time horizon is b elow the level achieved in this study (i.e., 799.7 EJ for coalbed methane and 523.5 EJ for shale gas). Second, under the stringent CO2 emissions reduction constraint, CO2 is priced at a sufficient level to offset part of the production cost of ECBM recovery us- ing CO2 sequestration, which makes coalbed methane production attractive. In fact, the results show that CO2- ECBM is developed on a large scale from the initial stage of coalbed methane production. Third, China and India are projected to account for a significant share of world natural gas demand in the long term toward 2050 (e.g., [1,24]), and these countries are estimated to be en- dowed with much larger amounts of the coalbed methane resource base than those of the shale gas resource base [6]. Therefore, the supply of coalbed methane is more cost-effective than that of shale gas in these countries because of the low demand for gas transportation, which represents a large share of total natural gas supply cost. It is important to note that coalbed methane and shale gas play only marginal roles in the world TPES, as shown in Figure 3. The share of coalbed methane and shale gas in the world TPES increases from 0.6% in 2010 to 3.6% in 2050 for the former and from 0.9% in 2010 to 2.2% in 2050 for the latter. To summarize, these results mean that neither coalbed methane nor shale gas would become one of the important fuels in the global primary energy mix over the period to 2050 under the stringent CO2 emissions reduction constraint, although each of them would have a large share of world natural gas pro- duction from around 2030 onwards under this constraint. 3.2. Cost-Optimal Pattern of Coalbed Methane and Shale Gas Production Figures 4 and 5 show the regional breakdown of the world production of coalbed methane and shale gas, re- spectively. The regional classification used in this study is identical to that of [5]. North America (predominantly the US) continues to be the biggest supply source of coal- bed methane until 2030. After that, Centrally Planned Asia (predominantly China) overtakes North America to become the world’s largest coalbed methane producer. From around 2030 onwards, coalbed methane production 0 5000 10000 15000 20000 25000 30000 2010 2020 2030 2040 2050 Worldcoalbedmet haneproduction(PJ/year) PacificOECD OtherPacificAsia SouthAsia CentrallyPlannedAsia Sub‐SaharanAfrica Midd leEast&NorthAfrica FormerSovietUnion East ern Eu ro pe WesternEuro pe LatinAmerica NorthAmerica Figure 4. World coalbed methane production by the 11 world regions. 0 5000 10000 15000 20000 25000 30000 2010 2020 2030 2040 2050 Worldshale gasproduction(PJ/year) PacificOECD OtherPacificAsia SouthAsia CentrallyPlannedAsia Sub‐Sah aranAfrica MiddleEast &No rth Africa FormerSovietUni on Eas ternEuro pe WesternEurope LatinAmerica No rth America Figure 5. World shale gas p roduction b y the 11 world reg ions. becomes more spatially dispersed. Besides North Amer- ica and Centrally Planned Asia, South Asia (predomi- nantly India), the Former Soviet Union (predominantly Russia), Sub-Saharan Africa (predominantly South Africa), Western Europe, and Pacific OECD (predominantly Australia) make a noticeable contribution to world coal- bed methane production. In contrast, North America (predominantly the US) continues to dominate world shale gas production throughout the time horizon. However, a number of world regions, notably South Asia, Western Europe, Eastern Europe, and Centrally Planned Asia, begin to have a visible participation in world shale gas production around 2040. The combined share of the world regions except North America in world shale gas production reaches only 39.3% in 2050. This implies that the US is likely to retain its position as the world’s largest shale gas producer at least until the middle of th e century. Now, the results are described in more regional detail. As an example, Figure 6 shows the world natural gas producti o n by region and by s ource for 205 0. Copyright © 2013 SciRes. IJCCE 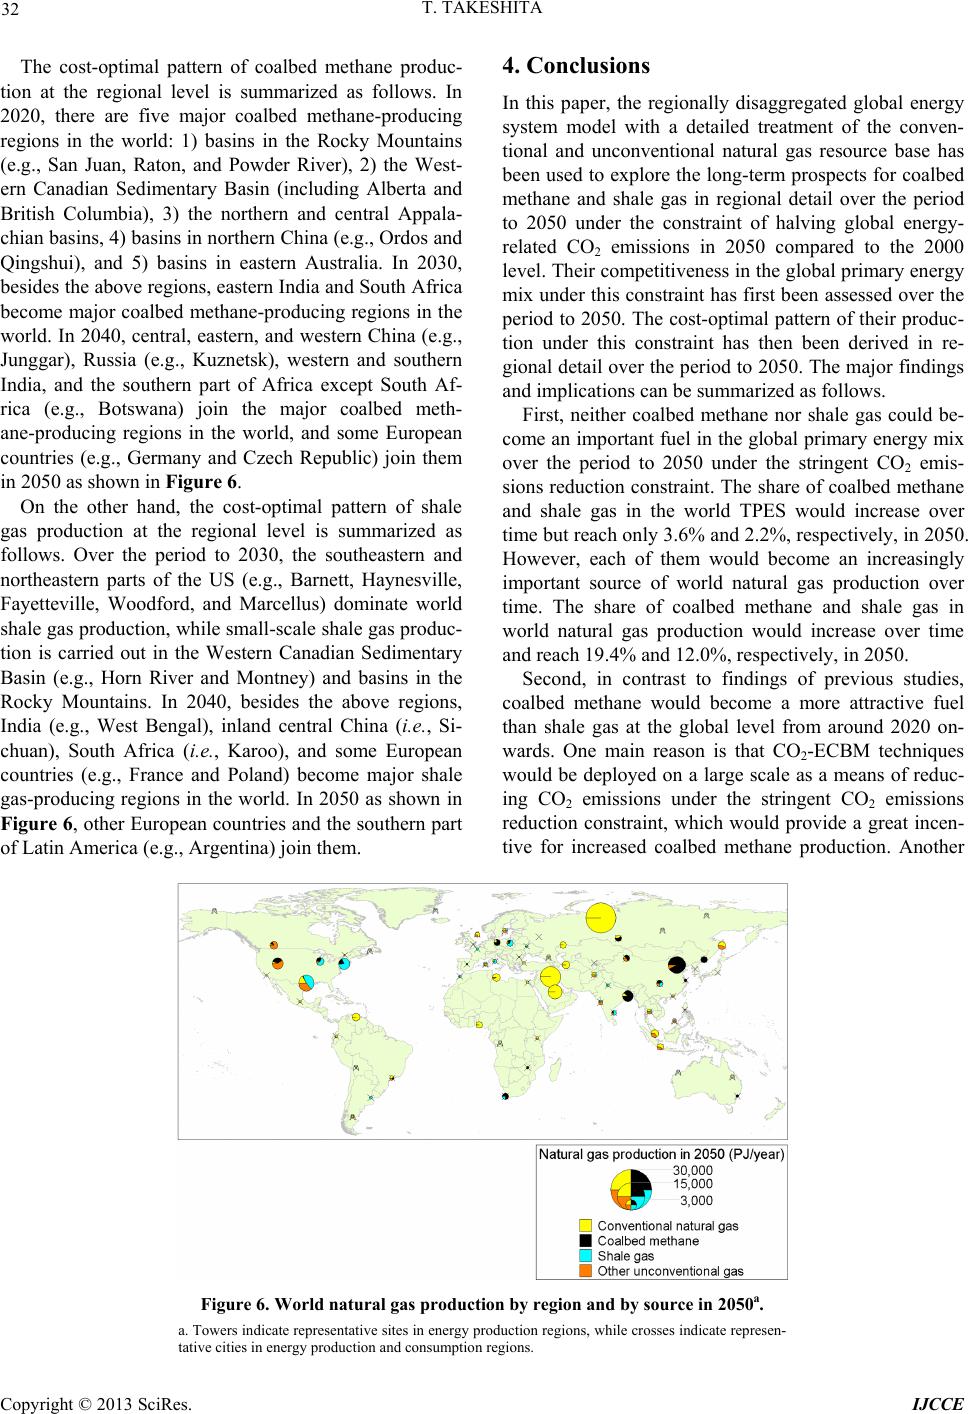 T. TAKESHITA Copyright © 2013 SciRes. IJCCE 32 4. Conclusions The cost-optimal pattern of coalbed methane produc- tion at the regional level is summarized as follows. In 2020, there are five major coalbed methane-producing regions in the world: 1) basins in the Rocky Mountains (e.g., San Juan, Raton, and Powder River), 2) the West- ern Canadian Sedimentary Basin (including Alberta and British Columbia), 3) the northern and central Appala- chian basins, 4) basins in northern China (e.g., Ordos and Qingshui), and 5) basins in eastern Australia. In 2030, besides the above regions, eastern India and South Africa become major coalbed methane-producing regions in the world. In 2040, central, eastern, and western China (e.g., Junggar), Russia (e.g., Kuznetsk), western and southern India, and the southern part of Africa except South Af- rica (e.g., Botswana) join the major coalbed meth- ane-producing regions in the world, and some European countries (e.g., Germany and Czech Republic) join them in 2050 as shown in Figure 6. In this paper, the regionally disaggregated global energy system model with a detailed treatment of the conven- tional and unconventional natural gas resource base has been used to explore the long-term prospects for coalbed methane and shale gas in regional detail over the period to 2050 under the constraint of halving global energy- related CO2 emissions in 2050 compared to the 2000 level. Their competitiveness in the global primary energy mix under this constraint has first been assessed over the period to 2050. The cost-optimal pattern of their produc- tion under this constraint has then been derived in re- gional detail over the per iod to 2050. The major findings and implications can be summarized as follows. First, neither coalbed methane nor shale gas could be- come an important fuel in the global primary energy mix over the period to 2050 under the stringent CO2 emis- sions reduction constraint. The share of coalbed methane and shale gas in the world TPES would increase over time but reach only 3.6% and 2.2%, respectively, in 2050. However, each of them would become an increasingly important source of world natural gas production over time. The share of coalbed methane and shale gas in world natural gas production would increase over time and reach 19.4% and 12.0%, respectively, in 2050 . On the other hand, the cost-optimal pattern of shale gas production at the regional level is summarized as follows. Over the period to 2030, the southeastern and northeastern parts of the US (e.g., Barnett, Haynesville, Fayetteville, Woodford, and Marcellus) dominate world shale gas produ ction, while small-scale shale gas produc- tion is carried out in the Western Canadian Sedimentary Basin (e.g., Horn River and Montney) and basins in the Rocky Mountains. In 2040, besides the above regions, India (e.g., West Bengal), inland central China (i.e., Si- chuan), South Africa (i.e., Karoo), and some European countries (e.g., France and Poland) become major shale gas-producing regions in the world. In 2050 as shown in Figure 6, other European countries and the southern part of Latin America (e.g., Argentina) join them. Second, in contrast to findings of previous studies, coalbed methane would become a more attractive fuel than shale gas at the global level from around 2020 on- wards. One main reason is that CO2-ECBM techniques would be deployed on a large scale as a means of reduc- ing CO2 emissions under the stringent CO2 emissions reduction constraint, which would provide a great incen- tive for increased coalbed methane production. Another Figure 6. World natural gas production by region and by source in 2050a. a. Towers in dicat e repr esentat ive s ites in energ y produ ction r egion s, whil e cross es indi cate rep resen - tative citie s in energy production and consumpti on regions.  T. TAKESHITA 33 main reason is that the world’s major coalbed meth- ane-rich regions are located geographically close to the world’s major natural gas consumption regions (i.e., China and India). This helps to reduce natural gas trans- portation cost and to improve the overall economics of natural gas supply. Third, in the cost-optimal coalbed methane production pattern derived from the model, North America (mainly the Rocky Mountain and Appalachian regions of the US) remains the world’s largest coalbed methane producer until 2030, after which Centrally Planned Asia (mainly northern China) overtakes North America and continues to be the world’s largest coalbed methane producer. From around 2030 onwards, South Asia (mainly eastern India), the Former Soviet Union (mainly Kuznetsk), Sub-Saharan Africa (mainly South Africa), and Pacific OECD (mainly eastern Australia) also contribute no- ticeably to world coalbed methane production. On the other hand, in the cost-optimal shale gas production pat- tern derived from the model, North America (mainly the southeastern and northeastern parts of the US) continues to dominate world shale gas production until 2040. After that, South Asia (mainly India), Western and Eastern Europe (mainly Poland and France), and Centrally Planned Asia (mainly Sichuan) also participate visibly in world shale gas production. It must be emphasized that coalbed methane and shale gas could play a substantial role in diversifying natural gas supply sources, and thus in improving energy secu- rity. The widespread market penetration of coalbed meth- ane and shale gas could make a large contribution to re- ducing the world’s dependence on conventional gas in the Middle East and Russia. They have a potential for representing the most part of natural gas supply in coun- tries such as the US, China, and India in the long term. It should be noted, however, that not only the realization of the potential for coalbed methane and shale gas outside North America, but also their ever increasing production in North America remains actually highly uncertain. To receive the full benefits of coalbed methane and shale gas, numerous obstacles (such as large volumes of water use, negative environmental impacts, and safety risks) must be overcome. REFERENCES [1] IEA, “World Energy Outlook 2011 Special Report: Are We Entering A Golden Age of Gas?” IEA, Paris, 2011. [2] T. Takeshita and K. Yamaji, “Important Roles of Fisch- er-Tropsch Synfuels in the Global Energy Future,” En- ergy Policy, Vol. 36, No. 8, 2008, pp. 2791-2802. doi:10.1016/j.enpol.2008.02.044 [3] T. Takeshita, “Assessing the Co-Benefits of CO2 Mitiga- tion on Air Pollutants Emissions from Road Vehicles,” Applied Energy, Vol. 97, 2012, pp. 225-237. doi:10.1016/j.apenergy.2011.12.029 [4] B. Metz, O. Davidson, P. Bosch, R. Dave and L. Meyer, Eds., “Climate Change 2007: Mitigation,” Contribution of Working Group III to the 4th Assessment Report of the IPCC, Cambridge University Press, New York, 2007. [5] International Institute for Applied Systems Analysis, “GGI Scenario Database,” 2007. http://www.iiasa.ac.at/Research/GGI/DB/ [6] H.-H. Rogner, “Energy Resources and Potentials,” In: T. B. Johansson, A. Patwardhan, N. Nakicenovic and L. G. Echeverri, Eds., Global Energy Assessment, Cambridge University Press, New York, 2012, pp. 425-512. [7] Organization for Economic Co-Operation and Develop- ment (OECD) Nuclear Energy Agency and International Atomic Energy Agency, “Uranium 2001: Resources, Production and Demand,” OECD, Paris, 2002. [8] M. Hoogwijk and W. Graus, “Global Potential of Re- newable Energy Sources: A Literature Assessment,” ECOFYS, Utrecht, The Netherlands, 2008. [9] W. Turkenburg, “Renewable Energy,” In: T. B. Johans- son, A. Patwardhan, N. Nakicenovic and L. G. Echeverri, Eds., Global Energy Assessment, Cambridge University Press, New York, 2012, pp. 761-900. [10] T. Takeshita, “A Strategy for Introducing Modern Bio- energy into Developing Asia to Avoid Dangerous Climate Change,” Applied Energy, Vol. 86, 2009, pp. S222-S232. doi:10.1016/j.apenergy.2009.04.023 [11] BGR, “Reserves, Resources and Availability of Energy Resources 2010,” BGR, Hannover, Germany, 2010. [12] Research Institute of Innovative Technology for the Earth, “Study Project for Implementation Planning of the New Earth Program,” New Energy and Industrial Technology Development Organization, Tokyo, 2002. [13] IPCC, “Special Report on Carbon Dioxide Capture and Storage,” Cambridge University Press, Cambridge, 2005. [14] US Geological Survey (USGS), “USGS World Petroleum Assessment 2000: Description and Results,” USGS, Washington DC, 2000. [15] USGS, “Circum-Arctic Resource Appraisal: Fact Sheet 2008-3049,” USGS, Washington DC, 2008. [16] H.-H. Rogner, “An Assessment of World Hydrocarbon Resources,” Annual Review of Energy and the Environ- ment, Vol. 22, 1997, pp. 217-262. doi:10.1146/annurev.energy.22.1.217 [17] IEA, “World Energy Outlook 2009,” IEA, Paris, 2009. [18] MIT Energy Initiative, “The Future of Natural Gas: An Interdisciplinary MIT Study,” Massachusetts Institute of Technology, Cambridge, MA, 2011. [19] Y. Masuoka, “Possibility Evaluation of the Fluid Fuel Use with Regionally Disaggregated Global Energy Mod- el,” Master Thesis, The University of Tokyo, Tokyo, 2003. Copyright © 2013 SciRes. IJCCE  T. TAKESHITA 34 [20] World Energy Council (WEC), “2010 Survey of Energy Resources,” WEC, London, 2010. [21] US Energy Information Administration, “World Shale Gas Resources: An Initial Assessment of 14 Regions Outside the United States,” US Department of Energy, Washington DC, 2011. [22] C. Boyer, B. Clark, V. Jochen, R. Lewis and C. K. Miller, “Shale Gas: A Global Resource,” Oilfield Review, Vol. 23, No. 3, 2011, pp. 28-39. [23] K. B. Medlock, A. M. Jaffe and P. R. Hartley, “Shale Gas and U.S. National Security,” James A. Baker III Institute for Public Policy, Rice University, Houston, TX, 2011. [24] IEA, “Energy Technology Perspectives 2010,” IEA, Paris, 2010. Copyright © 2013 SciRes. IJCCE
|