Paper Menu >>
Journal Menu >>
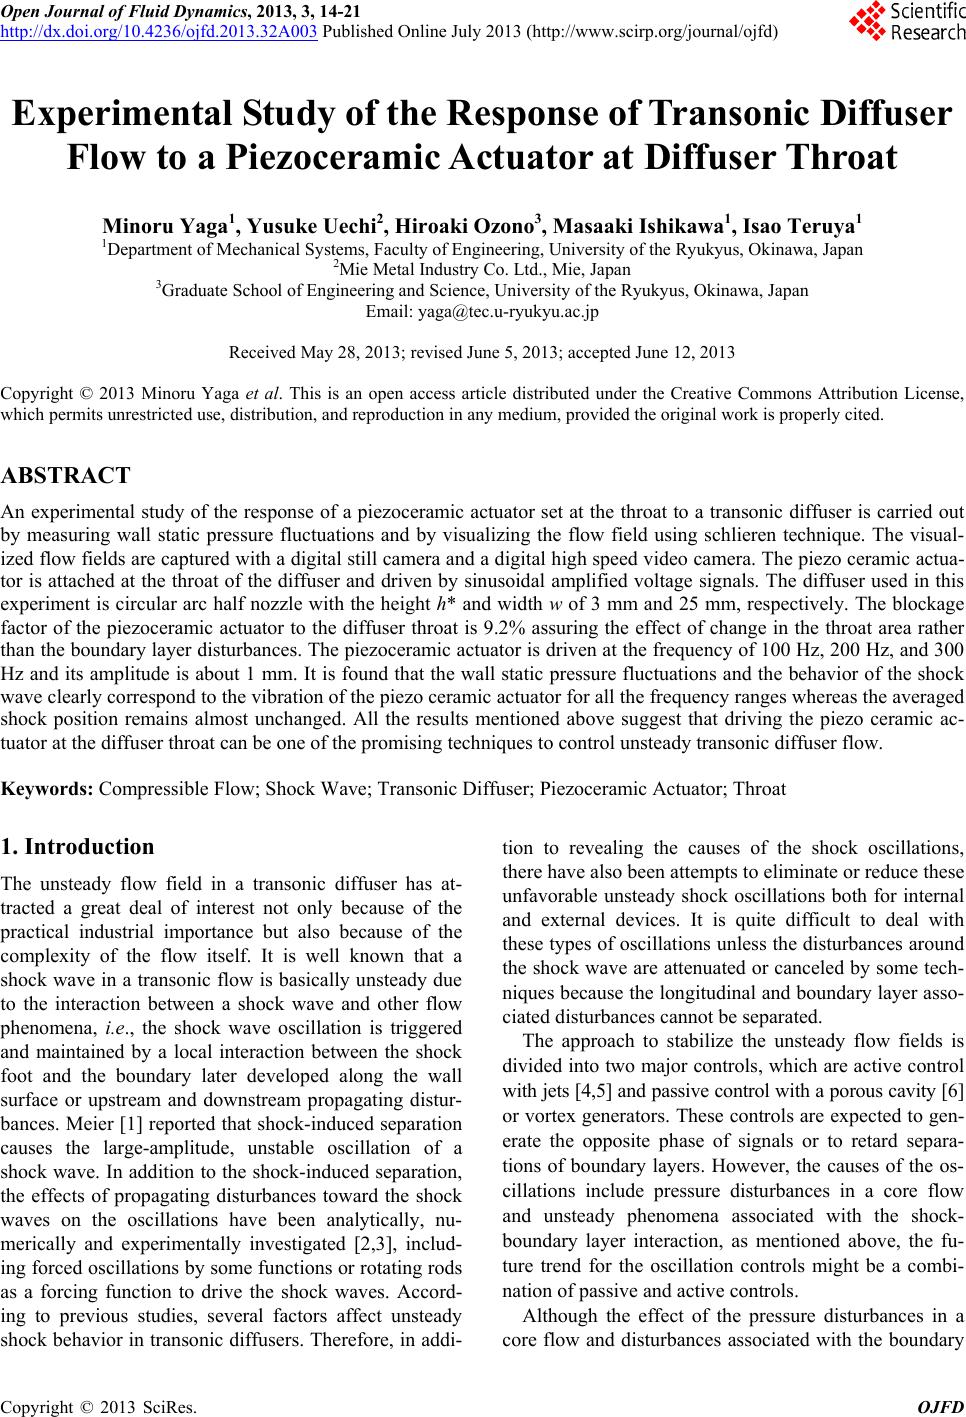 Open Journal of Fluid Dynamics, 2013, 3, 14-21 http://dx.doi.org/10.4236/ojfd.2013.32A003 Published Online July 2013 (http://www.scirp.org/journal/ojfd) Experimental Study of the Response of Transonic Diffuser Flow to a Piezoceramic Actuator at Diffus e r Throat Minoru Yaga1, Yusuke Uechi2, Hiroaki Ozono3, Masaaki Ishikawa1, Isao Teruya1 1Department of Mechanical Systems, Faculty of Engineering, University of the Ryukyus, Okinawa, Japan 2Mie Metal Industry Co. Ltd., Mie , Japan 3Graduate School of Engineering and Science, University of the Ryukyus, Okinawa, Japan Email: yaga@tec.u-ryukyu.ac.jp Received May 28, 2013; revised June 5, 2013; accepted June 12, 2013 Copyright © 2013 Minoru Yaga et al. This is an open access article distributed under the Creative Commons Attribution License, which permits unrestricted use, distribution, and reproduction in any medium, provided the original work is properly cited. ABSTRACT An experimental study of the response of a piezoceramic actuator set at the throat to a transonic diffuser is carried out by measuring wall static pressure fluctuations and by visualizing the flow field using schlieren technique. The visual- ized flow fields are captured with a digital still camera and a digital high speed video camera. The piezo ceramic actua- tor is attached at the throat of the diffuser and driven by sinusoidal amplified voltage signals. The diffuser used in this experiment is circular arc half nozzle with the height h* and width w of 3 mm and 25 mm, respectively. The blockage factor of the piezoceramic actuator to the diffuser throat is 9.2% assuring the effect of change in the throat area rather than the boundary layer d isturbances. The piezoceramic actuator is driven at the frequency of 100 Hz, 200 Hz, and 300 Hz and its amplitude is about 1 mm. It is found that the wall static pressure fluctuations and the behavior of the shock wave clearly correspond to the vibration of the piezo ceramic actuator for all the frequency ranges whereas the averaged shock position remains almost unchanged. All the results mentioned above suggest that driving the piezo ceramic ac- tuator at the diffuser throat can be one of the promising techniques to control unsteady transonic diffuser flow. Keywords: Compressible Flow; Shock Wave; Transonic Diffuser; Piezoceramic Actuator; Throat 1. Introduction The unsteady flow field in a transonic diffuser has at- tracted a great deal of interest not only because of the practical industrial importance but also because of the complexity of the flow itself. It is well known that a shock wave in a transonic flow is basically unsteady due to the interaction between a shock wave and other flow phenomena, i.e., the shock wave oscillation is triggered and maintained by a local interaction between the shock foot and the boundary later developed along the wall surface or upstream and downstream propagating distur- bances. Meier [1] reported that shock-induced separation causes the large-amplitude, unstable oscillation of a shock wave. In addition to the sh ock-induced separation, the effects of propagating disturbances toward the shock waves on the oscillations have been analytically, nu- merically and experimentally investigated [2,3], includ- ing forced oscillations by some functions or rotating rods as a forcing function to drive the shock waves. Accord- ing to previous studies, several factors affect unsteady shock behavior in transonic diffusers. Therefore, in addi- tion to revealing the causes of the shock oscillations, there have also been attempts to eliminate or reduce these unfavorable unsteady shock oscillations both for internal and external devices. It is quite difficult to deal with these types of oscillation s unless the disturbances around the shock wave are attenuated or canceled by some tech- niques because th e longitudinal and boundary layer asso - ciated disturbances cannot be separated. The approach to stabilize the unsteady flow fields is divided into two major controls, which are active control with jets [4,5] and passive control with a porous cavity [6] or vortex generators. These controls are expected to gen- erate the opposite phase of signals or to retard separa- tions of boundary layers. However, the causes of the os- cillations include pressure disturbances in a core flow and unsteady phenomena associated with the shock- boundary layer interaction, as mentioned above, the fu- ture trend for the oscillation controls might be a combi- nation of passive and active controls. Although the effect of the pressure disturbances in a core flow and disturbances associated with the boundary C opyright © 2013 SciRes. OJFD 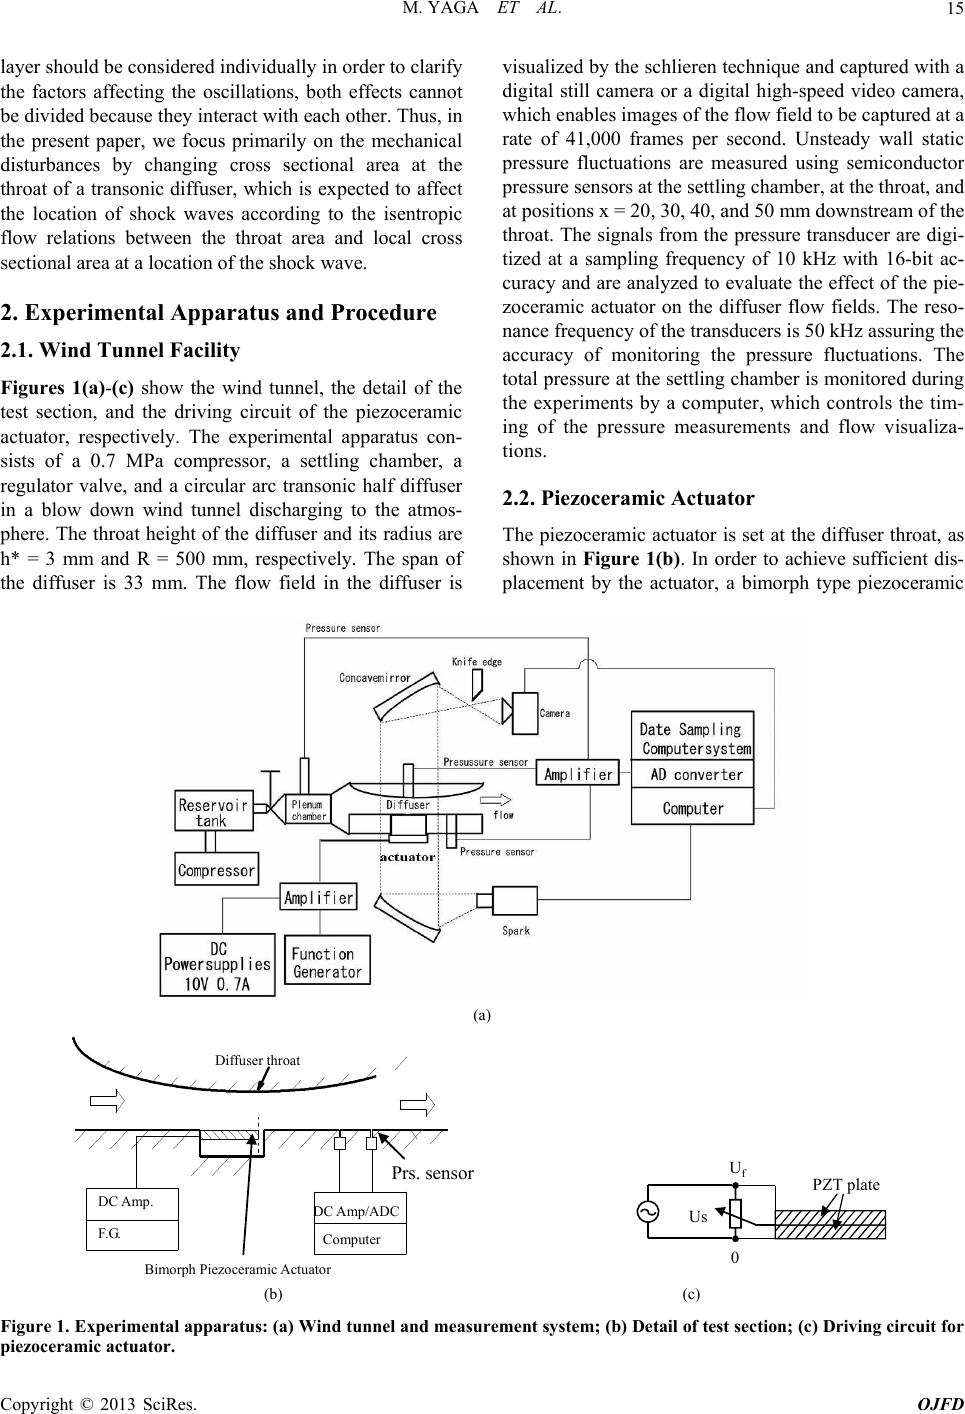 M. YAGA ET AL. 15 layer should be considered individually in order to clarify the factors affecting the oscillations, both effects cannot be divided because they interact with each other. Thus, in the present paper, we focus primarily on the mechanical disturbances by changing cross sectional area at the throat of a transonic diffuser, which is expected to affect the location of shock waves according to the isentropic flow relations between the throat area and local cross sectional area at a location of the shock wave. 2. Experimental Apparatus and Procedure 2.1. Wind Tunnel Facility Figures 1(a)-(c) show the wind tunnel, the detail of the test section, and the driving circuit of the piezoceramic actuator, respectively. The experimental apparatus con- sists of a 0.7 MPa compressor, a settling chamber, a regulator valve, and a circular arc transonic half diffuser in a blow down wind tunnel discharging to the atmos- phere. The throat height of the diffuser and its radius are h* = 3 mm and R = 500 mm, respectively. The span of the diffuser is 33 mm. The flow field in the diffuser is visualized by the schlieren technique and captured with a digital still camera or a digital high-speed video camera, which enables images of the flow field to be captured at a rate of 41,000 frames per second. Unsteady wall static pressure fluctuations are measured using semiconductor pressure sensors at the settling ch amber, at the throat, and at positions x = 20, 30, 40, and 50 mm downstream of the throat. The signals from the pressure transducer are digi- tized at a sampling frequency of 10 kHz with 16-bit ac- curacy and are analyzed to evaluate the effect of the pie- zoceramic actuator on the diffuser flow fields. The reso- nance frequency of the transducers is 50 kHz assuring the accuracy of monitoring the pressure fluctuations. The total pressure at the settling ch amber is monitored during the experiments by a computer, which controls the tim- ing of the pressure measurements and flow visualiza- tions. 2.2. Piezoceramic Actuator The piezoceramic actuator is set at the diffuser throat, as shown in Figure 1(b). In order to achieve sufficient dis- placement by the actuator, a bimorph type piezoceramic (a) Bimorph Piezoceramic Actuato r DC Amp. F.G. DC Amp/ADC Computer Diffuser throat Prs. sensor U f 0 Us PZT pl ate (b) (c) Figure 1. Experimental apparatus: (a) Wind tunnel and measure ment system; (b) Detail of test section; (c) Driving circuit for iezoceramic actuator. p Copyright © 2013 SciRes. OJFD 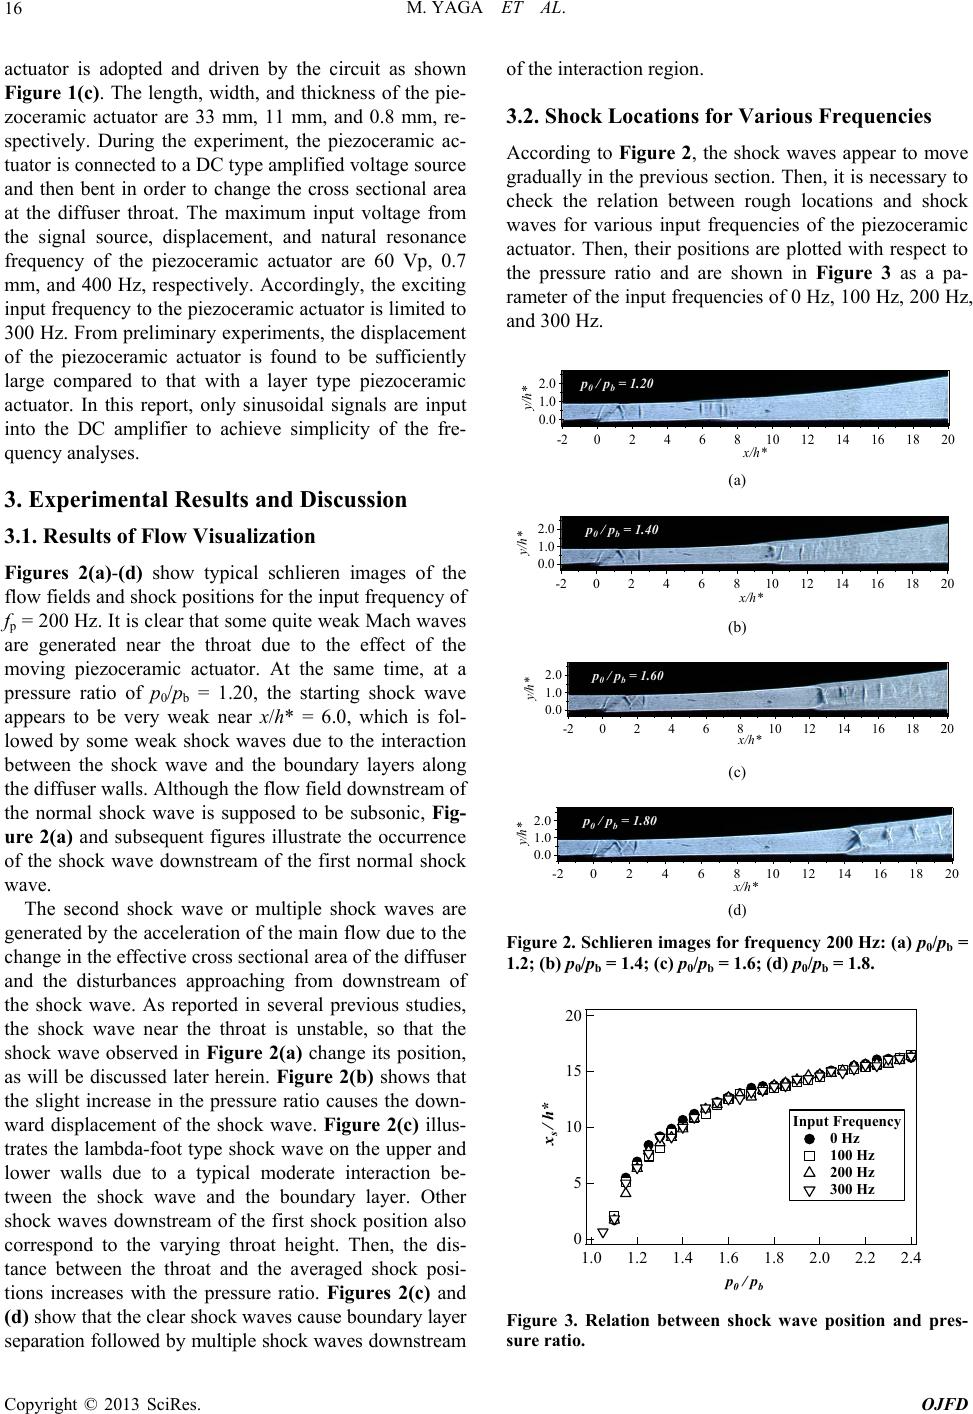 M. YAGA ET AL. 16 actuator is adopted and driven by the circuit as shown n images of the of the interaction region. e shock waves appear to move ck Figure 1(c). The length, width, and thickness of the pie- zoceramic actuator are 33 mm, 11 mm, and 0.8 mm, re- spectively. During the experiment, the piezoceramic ac- tuator is conn ected to a DC typ e amplified vo ltage source and then bent in order to change the cross sectional area at the diffuser throat. The maximum input voltage from the signal source, displacement, and natural resonance frequency of the piezoceramic actuator are 60 Vp, 0.7 mm, and 400 Hz, respectively. Accordingly, the exciting input frequency to the piezoceramic actuator is li mited to 300 Hz. From preliminary experiments, the displacement of the piezoceramic actuator is found to be sufficiently large compared to that with a layer type piezoceramic actuator. In this report, only sinusoidal signals are input into the DC amplifier to achieve simplicity of the fre- quency analyses. 3. Experimental Results and Discussion 3.1. Results of Flow Visualization Figures 2(a)-(d) show typical schliere flow fields and shock positions for th e input frequ ency of fp = 200 Hz. It is clear that some quite weak Mach waves are generated near the throat due to the effect of the moving piezoceramic actuator. At the same time, at a pressure ratio of p0/pb = 1.20, the starting shock wave appears to be very weak near x/h* = 6.0, which is fol- lowed by some weak shock waves due to the interaction between the shock wave and the boundary layers along the diffuser walls. Although the flow field downstream of the normal shock wave is supposed to be subsonic, Fig- ure 2(a) and subsequent figures illustrate the occurrence of the shock wave downstream of the first normal shock wave. The second shock wave or multiple shock waves are generated by the acceleration of the main flow due to the change in the effective cross sectional area of the diffuser and the disturbances approaching from downstream of the shock wave. As reported in several previous studies, the shock wave near the throat is unstable, so that the shock wave observed in Figure 2(a) change its position, as will be discussed later herein. Figure 2(b) shows that the slight increase in the pressure ratio causes the down- ward displacement of the shock wave. Figure 2(c) illus- trates the lambda-foot type shock wave on the upper and lower walls due to a typical moderate interaction be- tween the shock wave and the boundary layer. Other shock waves downstream of the first shock position also correspond to the varying throat height. Then, the dis- tance between the throat and the averaged shock posi- tions increases with the pressure ratio. Figures 2(c) and (d) show that the clear shock waves cause boundary layer separation followed by multiple shock waves down stre am 3.2. Shock Locations for Various Frequencies According to Figure 2, th gradually in th e previous section. Then , it is necessary to check the relation between rough locations and sho waves for various input frequencies of the piezoceramic actuator. Then, their positions are plotted with respect to the pressure ratio and are shown in Figure 3 as a pa- rameter of the input frequencies of 0 Hz, 100 Hz, 200 Hz, and 300 Hz. 2.0 1.0 y/h* p0 / pb = 1.20 0.0 0246810 12 14 16 18 20-2 x/h* (a) 2.0 1.0 0.0 y/h* 20181614121086420-2 x/h* p 0 / p b = 1.40 (b) 2.0 1.0 0.0 y/h* 20181614121086420-2 x/h* p 0 / p b = 1.60 (c) 2.0 1.0 0.0 y/h* 20181614121086420-2 x /h* p 0 / p b = 1.80 (d) Figure 2. Schlieren images for frequency 200 Hz: (a) p0/pb = 1.2; (b) p0/pb = 1.4; (c) p0/pb = 1.6; (d) p0/pb = 1.8. 20 15 10 5 0 x s / h* 2.42.22.01.81.61.4 Input Frequency 0 Hz 100 Hz 200 Hz 1.21.0 p 0 / p b 300 Hz Figure 3. Relation between shock wave position and pres- sure ratio. Copyright © 2013 SciRes. OJFD 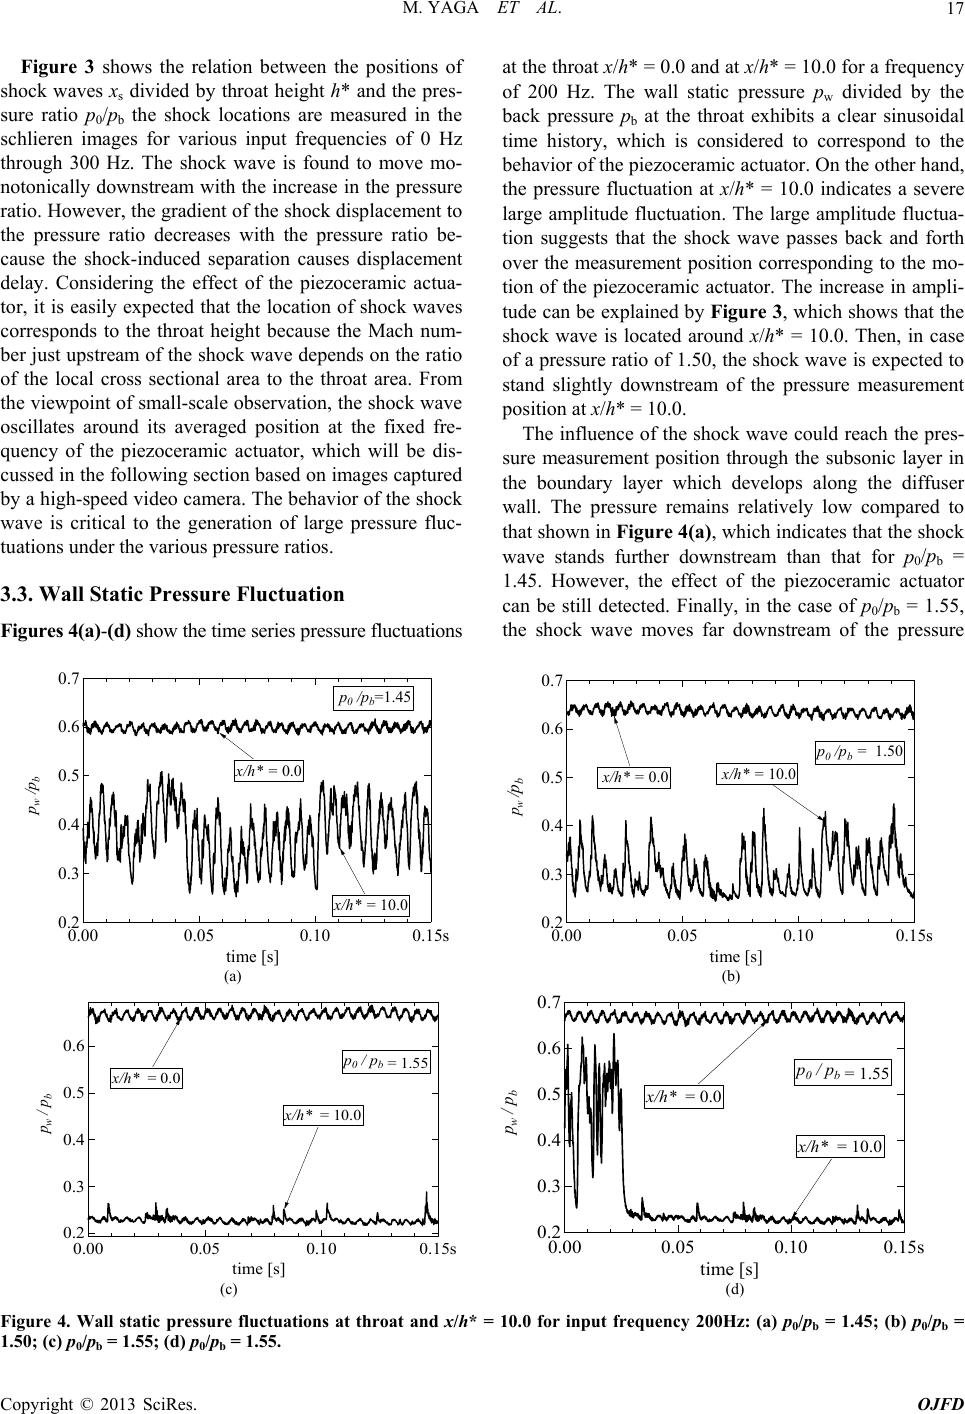 M. YAGA ET AL. 17 Figure 3 shows the relation between the positions of shock waves xs divided by throat height h* and the pres- sure ratio p0/pb the shock locations are measured in the schlieren images for various input frequencies of 0 Hz through 300 Hz. The shock wave is found to move mo- notonically downstream with the increase in the pressure ratio. However, the gradient of the shock displacement to the pressure ratio decreases with the pressure ratio be- cause the shock-induced separation causes displacement delay. Considering the effect of the piezoceramic actua- tor, it is easily expected that the location of shock waves corresponds to the throat height because the Mach num- ber just upstream of the shock wave depends on the ratio of the local cross sectional area to the throat area. From the viewpoint of small-scale observatio n, the shock wave oscillates around its averaged position at the fixed fre- quency of the piezoceramic actuator, which will be dis- cussed in the following section based on images captured by a high-speed video camera. The behavior of the shock wave is critical to the generation of large pressure fluc- tuations under the various pressure ratios. 3.3. Wall Static Pressure Fluctuation Figures 4(a)-(d) show the time series pressure fluct uat i ons at the throat x/h* = 0.0 and at x/h* = 10.0 for a frequency of 200 Hz. The wall static pressure pw divided by the back pressure pb at the throat exhibits a clear sinusoidal time history, which is considered to correspond to the behavior of the piezoceramic actuator. On the other hand, the pressure fluctuation at x/h* = 10.0 indicates a severe large amplitude fluctuation. The large amplitude fluctua- tion suggests that the shock wave passes back and forth over the measurement position corresponding to the mo- tion of the piezoceramic actuator. The increase in ampli- tude can be explained by Figure 3, which shows that the shock wave is located around x/h* = 10.0. Then, in case of a pressure ratio of 1.50, the shock wave is expected to stand slightly downstream of the pressure measurement position at x/h* = 10.0. The influence of the shock wave could reach the pres- sure measurement position through the subsonic layer in the boundary layer which develops along the diffuser wall. The pressure remains relatively low compared to that shown in Figure 4(a), which indicates that the shock wave stands further downstream than that for p0/pb = 1.45. However, the effect of the piezoceramic actuator can be still detected. Finally, in the case of p0/pb = 1.55, the shock wave moves far downstream of the pressure 0.7 0.6 0.5 0.4 0.3 0.2 p w /p b 0.15s0.100.050.00 time [s] p 0 /p b =1.45 x/h* = 0.0 x/h* = 10.0 0.7 0.6 0.5 0.4 0.3 0.2 p w /p b 0.15s0.100.050.00 time [s] p 0 /p b = 1.50 x/h* = 0.0 x/h* = 10.0 (a) (b) 0.7 0.6 0.5 0.4 0.3 0.2 pw / pb 0.15s0.100.050.00 time [s] p0 / pb = 1.55 x/h* = 0.0 x/h* = 10.0 (d) 0.6 0.5 0.4 0.3 0.2 p w / p b 0.15s0.100.050.00 time [s ] p 0 / p b = 1.55 x/h* = 0.0 x/h* = 10.0 ( c) Figure 4. Wall static pressur p0/pb = 1.45; (b) p0/pb 1.50; (c) p0/pb = 1.55; (d) p0/pb e fluctuations at throat and x/h* = 10.0 for input frequency 200Hz: (a) = 1.55. = Copyright © 2013 SciRes. OJFD  M. YAGA ET AL. 18 measurement position. This is also con firmed in Figure 3, which showing xs/h* = 10.0 at a pressure ratio of 1.55. Both the fluctuating and averaged pressure are much lower due to the downstream displacement of the pres- sure measurement position. These figures contain infor- mation about the shock position and the shock wave be- havior. In other words, Figure 4(a) shows the severe pressure fluctuation at x/h* = 10.0, whereas the fluctua- tion at the throat does not. This means that the shock wave stands between the throat and the measurement position at x/h* = 10.0. As the pressure ratio increases, the fluctuation at x/h* = 10.0 gradually decreases the pressure fluctuation, ach s the supersonic state stream of the shock wave. d compared a) shows quency of fp throat shows almost no increase in ieving the smallest pressure fluctuation, as shown in Figure 4(c). The pressure fluc- uation as shown Figure 4(c) denotet at x/h* = 10.0. However, the sudden change in the average pressure was observed as shown in Figure 4(d) under the same condition, which is caused by the flow separation down- stream of the shock wave. The increase in the pressure fluctuation indicates the shock wave displacement up- stream due to the flow separation. However, some time after the increase in pressure, the average value and fluc- tuation decrease, denoting the shock wave located down- stream of the position at x/h* = 10.0. The pressure fluc- tuations at the throat are found to oscillate sinusoidally for all pressure ratios. Figure 4(d) also reveals that the wall pressure fluctuation at a pressure ratio of 1.55 sud- denly chan ges its level at time t = 0.03 s, which suggests that the flow has just recovered from an unexpected separation down 3.4. Root Mean Square of the Pressure Fluctuation It is well known that wall static pressure fluctuations greatly decrease when a flow becomes supersonic. In other words, monitoring the wall static pressure fluctua- tions clarifies whether the flow is supersonic or subsonic. In the previous section, the pressure fluctuations also indicate the rough shock wave positions. Then, for a more quantitative evaluation of the pressure fluctuations, the root mean square of pressure fluctuations is one of the indices of the shock wave position and its behavior. Figures 5(a)-(d) show the root mean squares prms di- vided by the atmospheric pressure pb for three different frequencies 100 Hz, 200 Hz, and 300 Hz an to the case for 0 Hz as a reference. Figure 5( that the root mean square prms/pb for the input fre = 0 Hz at the prms/pb with the increase in the pressure ratio p0/pb. On the other hand, activation occurs at the throat, the rms increases with the pressure ratio. This indicates that the piezoceramic actuator always affects the pressure fluc- 0.10 0.08 0.06 0.04 0.02 0.00 p rms / p b 2.42.22.01.81.61.41.21.0 p 0 / p b 0Hz 100Hz 200Hz 300Hz x/h* = 0 (throat) (a) 0.10 0.08 0.06 0.04 0.02 0.00 p rms / p b 2.42.22.01.81.61.41.21.0 x/h* = 6.67 p 0 / p b 0Hz 100Hz 200Hz 300Hz (b) 0.10 0.08 0.06 0.04 0.02 0.00 prms / pb 2. 4 2.22.01.81.61.41.21.0 p0 / pb x/h* = 10.0 0Hz 100Hz 200Hz 300Hz (c) 0.10 0.08 0.06 0.04 0.02 0.00 p rms / p b 2.42.22.01.81.61.41.21.0 p 0 / p b x / h* = 13.33 0Hz 100Hz 200Hz 300Hz (d) Figure 5. RMS of wall static pressure fluctuations: (a) x/h* = 0.0; (b) x/h* = 6.67; (c) x/h* = 10.0; (d) x/h* = 13.33. tuation at the throat. When the rms reaches approxima- tely zero, the state of the measurement position is con- sidered to be supersonic. This indicates that the hock wave is located downstreaof the measurement posi- tion. s m Copyright © 2013 SciRes. OJFD  M. YAGA ET AL. 19 In Figure 5(b), the clear peaks at a pressure ratio p0/pb of approximately 1.2 show that a single and relatively weak shock wave appears and moves downstream with the increase in the pr essure ratio. The sudden drop in the rms indicates the completion of the process from the subsonic-to-supersonic transition due to the downstream displacement of the shock wave. This process is inde- pendent of the input frequencies of the piezoceramic ac- tuator. Figure 5(c) shows that the rms at a pressure ratio of approximately 1.7 suddencreases, which is caused by the unexpected separation of a boundary layer, as mentioned in the previous section. This also indicate the shock wave existence around the position of x/h* = 10.0. However, for a pressure ratio greater than 1.8, the rms for all input frequen cies becomes approximately zero, which suggests that the flow is completely supersonic. Note th at the source of the signal originates at the throat, and then even if the flow measurement position is supersonic, the signal from the throat can be detected. Figure 5(d) indi- cates the same variations that is all the rms for each input frequency suddenly decrease at the pressure ratio at 2.0 denoting the supersonic sta this postion. on ly in te at 3.5. FFT Analyses of Wall Pressure Fluctuati The rms of the pressure fluctuation usually becomes large when the oscillating shock wave approaches the monitoring position. It is also important to examine the unsteady behavior of the shock wave in detail, especially in this case, in order to confirm the response of the flow field to the piezoceramic actuator. One of the best ways to evaluate the effect of the ac- tuation is to check the contributions of every frequency by means of FFT analysis of the pressure fluctuations at x/h* = 6.67. Figures 6(a)-(d) show the results of the FFT analysis of the pressure fluctuations for each pressure ratio. Figure 6(a) shows no dominant frequency and al- most no frequency output for pressure ratios greater than p0/pb = 1.25, as deduced from the results for the rms shown in Figure 5(b). This indicates that the shock wave oscillates with no dominant frequency for all of the pressure ratios and that the state of the flow at x/h* = 6.67 becomes supersonic at pressure ratios greater than 1.25. Moreover, the levels of each spectrum are not so large because the shock wave at this position is not so strong. On the other hand, Figures 6(b)-(d) clearly show the dominant frequencies for each pressure ratio, which cor- responds to the input frequency to the piezoceramic ac- tuator. Note that even in the supersonic state, the fre- quency of 200 Hz can be observed. These figures indi- cate the effect of the piezoceramic actuator on the flow fields. In addition to the results of the visualization, 100 80 60 40 20 0 Power Spect rum 500Hz4003002001000 Frequency 1.8 1.6 1.4 1.2 1.0 p 0 /p b f p =0Hz (a) 100 80 60 40 20 0 Power Spect rum 500Hz4003002001000 Frequency 1.8 1.6 1.4 1.2 1.0 p 0 /p b f p =100Hz (b) 100 80 60 40 20 0 Power Spectrum 500Hz4003002001000 Frequency 1.8 1.6 1.4 1.2 1.0 p 0 /p b f p =200Hz (c) 100 80 60 40 20 0 Power Spectrum 1.8 1.6 1.4 1.2 1.0 p 0 /p b f p =300Hz 100 200 3000 Frequency 400 500Hz (d) Figure 6. FFT analysis of wall static pressure fluctuations at x/h* = 6.67: (a) fp = 0 Hz; (b) fp = 100 Hz; (c) fp = 200 Hz; (d) fp = 300 Hz. monitoring the wall static pressure fluctuation is a quan- titative way to confirm the effect of the actuator. Figures 7(a)-(d) show the FFT analysis of the pres- sure fluctuation at x/h* = 10.0 for the same input fre- quency as that in Figure 6. Figure 7(a) shows no domi- nant frequency but only a relatively low frequency, which has the same tendency as that in Figure 6(a) Figures 7(b)-(d) show cleominant frequencies. This indicates the possibility of reducing the pressure fluctua- tion by controlling the shock position, which is expected to cancels the pressure fluctuation. In the figures, a wide range of frequencies are observed at a pressure ratio of approximately 1.7 due to the unexpected shock-induced separation of the boundary layer. All of the figures show a sudden decrease in the power spectrum at a pressure ratio of approximately 1.4. This implies that the shoc . ar d k Copyright © 2013 SciRes. OJFD  M. YAGA ET AL. 20 100 80 60 40 20 0 Power Spectrum 500Hz4003002001000 Frequency 1.8 1.6 1.4 1.2 1.0 p 0 /p b f p =0Hz (a) 100 80 60 40 20 0 ower SpectrumP 500Hz4003002001000Frequenc y 1.8 1.6 1.4 1.2 1.0 p 0 /p b f p =100Hz (b) 100 80 60 40 20 0 Power Spectr um 500Hz4003002001000 Frequency 1.8 1.6 1.4 1.2 1.0 p 0 /p b f p =200Hz (c) 100 80 60 40 20 0 Power Spectrum 500Hz4003002001000 Frequency 1.8 1.6 1.4 1.2 1.0 0 b p/p f p =300Hz (d) Figure 7. FFT analysis of wall static pressure fluctuations at x/h* = 10.0: (a) fp = 0 Hz; (b) fp = 100 Hz; (c) fp = 200 Hz; (d) fp = 300 Hz. wave completely passes the measurement position, re- sulting in a chan ge in state from subsonic to supersonic. 3.6. FFT Analysis of Shock Positions The wall static pressure fluctuations prov ide us with only local information on the shock wave behavior around th measurements positions. Ardingly, in order to clarify the entire flow field, the variations in unsteady shock positions are also important because the shock wave al- ways contains all of the information on its upstream and downstream conditions regardless of its position. Figures 8(a)-(d) show the results of the FFT analyses of the shock positions under the influence of the piezo- ceramic actuator as well as with no control. In case of no control, there is no domi frequency, as shown i e cco nantn 500 400 300 200 100 0 Power Spectrum 500Hz4003002001000 Frequency 1.8 1.6 1.4 1.2 p 0 / p b f p = 0 Hz (a) 500 400 300 200 100 0 Power Spectrum 500Hz4003002001000 Frequency 1.8 1.6 1.4 1.2 p 0 / p b f p = 100H z (b) 500 400 300 200 100 0 Power Spectrum 500Hz4003002001000 Frequency 1.8 1.6 1.4 1.2 p 0 / p b f p = 200Hz (c) 500 400 300 200 100 0 Power Spectrum 500Hz4003002001000 Frequency 1.8 1.6 1.4 1.2 p 0 / p b f p = 300Hz Figure 8. FFT analysis of Shock positions: (a) fp = 0 Hz; (b) fp = 100 Hz; (c) fp = 200 Hz; (d) fp = 300 Hz. Figure 8(a). The relatively low-frequency spectrum is observed as long as the pressure ratio is smaller than 1.4. This shows that the shock wave passes the measurement position monotonically as the pressure ratio increases. In contrast, for a shock wave frequency of 100 Hz, a domi nant frequency is observed until a pressure ratio of 1.5. The peak value of the dom frequency decreases as the pressure ratio increases. This decrease in the peak value of the dominant frequency is explained by the be- havior of the shock wave, as shown in Figure 3. That is, the gradient of the shock wave displacement decreases as the pressure ratio increase as shown in Figure 3 due to the expansion rate of the cross sectional area of the diffuser. (d) - inant Copyright © 2013 SciRes. OJFD  M. YAGA ET AL. Copyright © 2013 SciRes. OJFD 21 This implies that shock wave located downstream is in- sensitive to the pressure fluctuation compared with that located upstream position. Then, the oscillation of the shock wave gradually decreases as it moves downstream. The diminishing of the dominant frequency for higher pressure ratios might be due to the relative increase in other frequencies. On the other hand, when the higher frequency is ap plied to the throat, the cleareaky dominant frequency, which is the exact same frequency as that input to the piezoceramic actuator, can be observed. Note also that the applied frequency remains, even for the higher pres- sure ratio, which suggests that the shock wave is always under the influence of the piezoceramic actuator. The tendencies observed in Figure 8(c) also appear in Figure 8(d). In other words, the input frequency of 300 Hz is the dominant frequency for all pressure ratios. Then, actua- tion at the throat is a promising method for controlling shock wave behavior. Transonicum II, Springer, Berlin, 1976, pp. d Oscillations in a Diffuser Flow,” AIAA Journal, - ly p 4. Conclusions A piezoceramic actuator is applied to the throat of a cir- cular arc diffuser with various driving frequencies in order to clarify the response of the flow field and shock wave behaviors to the piezoceramic actuator. The piezo- ceramic actuator, which moves periodically as a refer- ence signal, is considered to be a driving force for oscil- lation phenomena. The conclusions are summarized as follows: 1) The starting shock wave moves downstream mono- tonically with the increase in the wind tunnel pressure ratio, regardless of the input frequencies to the piezoce- ramic actuator. 2) The rms values of the wall pressure fluctuations d e- crease suddenly just after the shock wave completely passes over the measurement position for all driving fre- quencies. 3) The pressure fluctuations at the throat and down- stream of the throat correspond to the exact same fre- quencies of the input frequencies to the piezoceramic actuator in both cases that the position is supersonic and subsonic state. 4) Shock wave behaviors are also confirmed to corre- spond to the piezoceramic actuator behaviors. REFERENCES [1] G. E. A. Meier, “Shock Induced Flow oscillations in a Laval Nozzle,” In: K. Oswatitsch and D. Rues, Eds., Symposium 252-261. [2] T. Hsieh, T. J. Bogar and T. J. Coakley, “Numerical Simulation and Comparison with Experiment for Self- Excite Vol. 25, No. 7, 1987, pp. 936-943. doi:10.2514/3.9725 [3] R. Bur, R. Benay, A. Galli and P. Berthouze, “Experi- mental and Numerical Study of Forced Shock-Wave Os- cillations,” Aerospace Science and Technology, Vol. 10, No. 4, 2006, pp. 265-278. doi:10.1016/j.ast.2005.12.002 [4] E. Benini, R. Biollo and R. Ponza, “Efficiency Enhance- ment in Transonic Compressor Rotor Blades Using Syn- thetic Jets: A numerical Investigation,” Applied Energy Vol. 88, No. 3, 2011, pp. 953-962, doi:10.1016/j.apenergy.2010.08.006 [5] P. B. Salunkhe, J. Joseph and A. M. Pradeep, “Active Feed-Back Control of Stall in a Axial Flow Fan under Dynamic Inflow Distortion,” Experimental Thermal and Fluid Science, Vol. 35, No. 6, 2011, pp. 1135-1142. doi:10.1016/j.expthermflusci.2011.03.008 [6] M. Yaga, T. Haga and K. Oyakawa, “Study on Passive Control in a Transonic Diffuser,” AIAA Paper 2000-0902, 38th Aerospace Sciences Meetings & Exhibit, Reno, Jan- uary 2000, pp. 1-11. |