 Advances in Nanoparticles, 2013, 2, 229-235 http://dx.doi.org/10.4236/anp.2013.23032 Published Online August 2013 (http://www.scirp.org/journal/anp) Chemical Structure of TiO Organometallic Particles Obtained by Plasma Ma. Guadalupe Olayo1, Francisco González-Salgado1,2, Guillermo J. Cruz1*, Lidia Ma. Gómez1,3, Genoveva García-Rosales2, Maribel Gonzalez-Torres1,3, Osvaldo G. Lopez-Gracia1,4 1Departamento de Física, Instituto Nacional de Investigaciones Nucleares, Ocoyoacac, México 2Departamento de Posgrado, Instituto Tecnológico de Toluca, Metepec, México 3Posgrado en Ciencia de Materiales, Facultad de Química, Universidad Autónoma del Estado de México, Toluca, México 4Posgrado en Ciencias Químicas, Facultad de Química, Universidad Autónoma del Estado de México, Toluca, México Email: *guillermoj.cruz@hotmail.com Received April 3, 2013; revised May 3, 2013; accepted May 10, 2013 Copyright © 2013 Ma. Guadalupe Olayo et al. This is an open access article distributed under the Creative Commons Attribution License, which permits unrestricted use, distribution, and reproduction in any medium, provided the original work is properly cited. ABSTRACT This work presents a study about the chemical structure of titanium oxide (TiO) particles synthesized by plasmas using titanium tetrapropoxide, Ti(-O-CH2-CH2-CH3)4. In plasmas, practically all chemical bonds are susceptible to participate in the reactions producing different results than those obtained by the traditional chemical routes. The particles obtained this way are semispheres and fibers grouped in random and layered structures in the 120 - 500 nm interval and mean diameter of 86.4 nm (fibers) and 308.6 nm (semispheres). The analysis of the resulting TiO structure was performed by IR and XPS finding that the main chemical state of Ti in these conditions was O2-Ti-O2 (Ti surrounded by O) which is part of the precursor structure, however, in O, the main chemical state was Ti-O-Ti formed with the rupture of the pre- cursor Ti-O-C bonds. These last bonds reduce the conjugation between the structure of both elements, O2-Ti-O2 and Ti-O-Ti, to produce organometallic compounds. Other chemical states appeared showing consecutive dehydrogenation steps during the synthesis with the formation of multiple bonds as a consequence of the continuous collisions in the plasma. These results allow us to follow the chemical reactions promoted by this kind of plasmas to produce TiO nanoparticles which are essentially conformed of intensive dehydrogenation. Keywords: TiO; Particles; Plasma; Degradation; XPS; TTP 1. Introduction Under plasma conditions, degradation and/or synthesis of materials can be carried out with different results than those obtained by the traditional chemical routes. This is because in plasmas the accelerated electrons can reach kinetic energies beyond the bonding energy of the atoms promoting, by collisions, chemical reactions among radi- cals and/or ions without involving other reagents or sub- stantially increasing the temperature of the synthesis which could damage the reagents [1]. Plasma techniques have already been used to prepare amorphous and/or crystal- line phases of titanium oxides [2]. In these conditions, the TiOx configuration of crystalline phases in which x = 2 can be displaced from 2 to other ratios, obtaining mate- rials generically known as TiO. Some photochemical applications of TiO are based on its capacity to absorb an incident light transferring part of this energy to other materials through its surface. This energy can be applied to oxidize molecules or to create free radicals in other substances to be used in the oxida- tion or in degradation of contaminants [3,4]. In this su- perficial activity, materials with TiO need to have a large superficial area, as in nanoparticles. Spherical TiO nanoparticles produced by chemical tech- niques with titanium tetraisopropoxide (TTIP) have been obtained with diameters below 100 nm with characteris- tics depending on the precursor and on the type of syn- thesis [5-9]. The main precursors of TiO nanoparticles in chemical syntheses up to now have been TTIP [10,11] and TiCl4 [12,13]. In plasma syntheses, commercially pure titanium oxidized in Ar/O mixtures [14] and TTIP de- graded in resistive coupling discharges [15] have been used. Plasma degradation of titanium tetrapropoxide (TTP), Ti(-O-CH2-CH2-CH3)4, to produce organometallic parti- cles has also been focused on the electric properties and on the amorphous structure of the particles [16,17]. Now, *Corresponding author. C opyright © 2013 SciRes. ANP 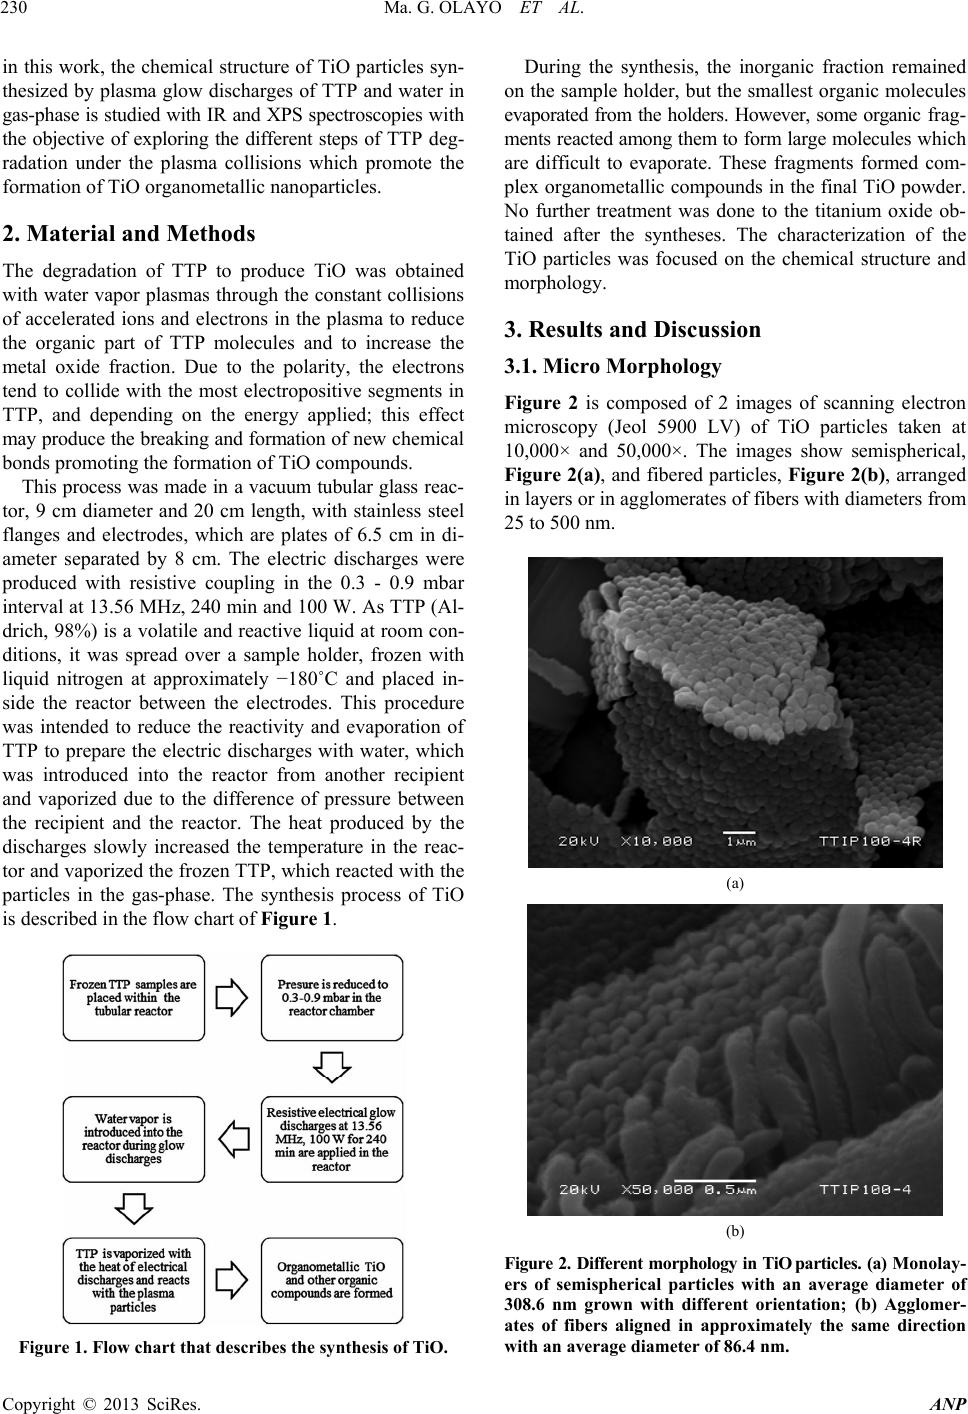 Ma. G. OLAYO ET AL. 230 in this work, the chemical structure of TiO particles syn- thesized by plasma glow discharges of TTP and water in gas-phase is studied with IR and XPS spectroscopies with the objective of exploring the different steps of TTP deg- radation under the plasma collisions which promote the formation of TiO organometallic nanoparticles. 2. Material and Methods The degradation of TTP to produce TiO was obtained with water vapor plasmas through the constant collisions of accelerated ions and electrons in the plasma to reduce the organic part of TTP molecules and to increase the metal oxide fraction. Due to the polarity, the electrons tend to collide with the most electropositive segments in TTP, and depending on the energy applied; this effect may produce the breaking and formation of new chemical bonds promoting the formation of TiO compounds. This process was made in a vacuum tubular glass reac- tor, 9 cm diameter and 20 cm length, with stainless steel flanges and electrodes, which are plates of 6.5 cm in di- ameter separated by 8 cm. The electric discharges were produced with resistive coupling in the 0.3 - 0.9 mbar interval at 13.56 MHz, 240 min and 100 W. As TTP (Al- drich, 98%) is a volatile and reactive liquid at room con- ditions, it was spread over a sample holder, frozen with liquid nitrogen at approximately −180˚C and placed in- side the reactor between the electrodes. This procedure was intended to reduce the reactivity and evaporation of TTP to prepare the electric discharges with water, which was introduced into the reactor from another recipient and vaporized due to the difference of pressure between the recipient and the reactor. The heat produced by the discharges slowly increased the temperature in the reac- tor and vaporized the frozen TTP, which reacted with the particles in the gas-phase. The synthesis process of TiO is described in the flow chart of Figure 1. Figure 1. Flow chart that describes the synthesis of TiO. During the synthesis, the inorganic fraction remained on the sample holder, but the smallest organic molecules evaporated from the holders. However, some organic frag- ments reacted among them to form large molecules which are difficult to evaporate. These fragments formed com- plex organometallic compounds in the final TiO powder. No further treatment was done to the titanium oxide ob- tained after the syntheses. The characterization of the TiO particles was focused on the chemical structure and morphology. 3. Results and Discussion 3.1. Micro Morphology Figure 2 is composed of 2 images of scanning electron microscopy (Jeol 5900 LV) of TiO particles taken at 10,000× and 50,000×. The images show semispherical, Figure 2(a), and fibered particles, Figure 2(b), arranged in layers or in agglomerates of fibers with diameters from 25 to 500 nm. (a) (b) Figure 2. Different morphology in TiO par ticles. (a) M on ol ay - ers of semispherical particles with an average diameter of 308.6 nm grown with different orientation; (b) Agglomer- ates of fibers aligned in approximately the same direction with an average diameter of 86.4 nm. Copyright © 2013 SciRes. ANP 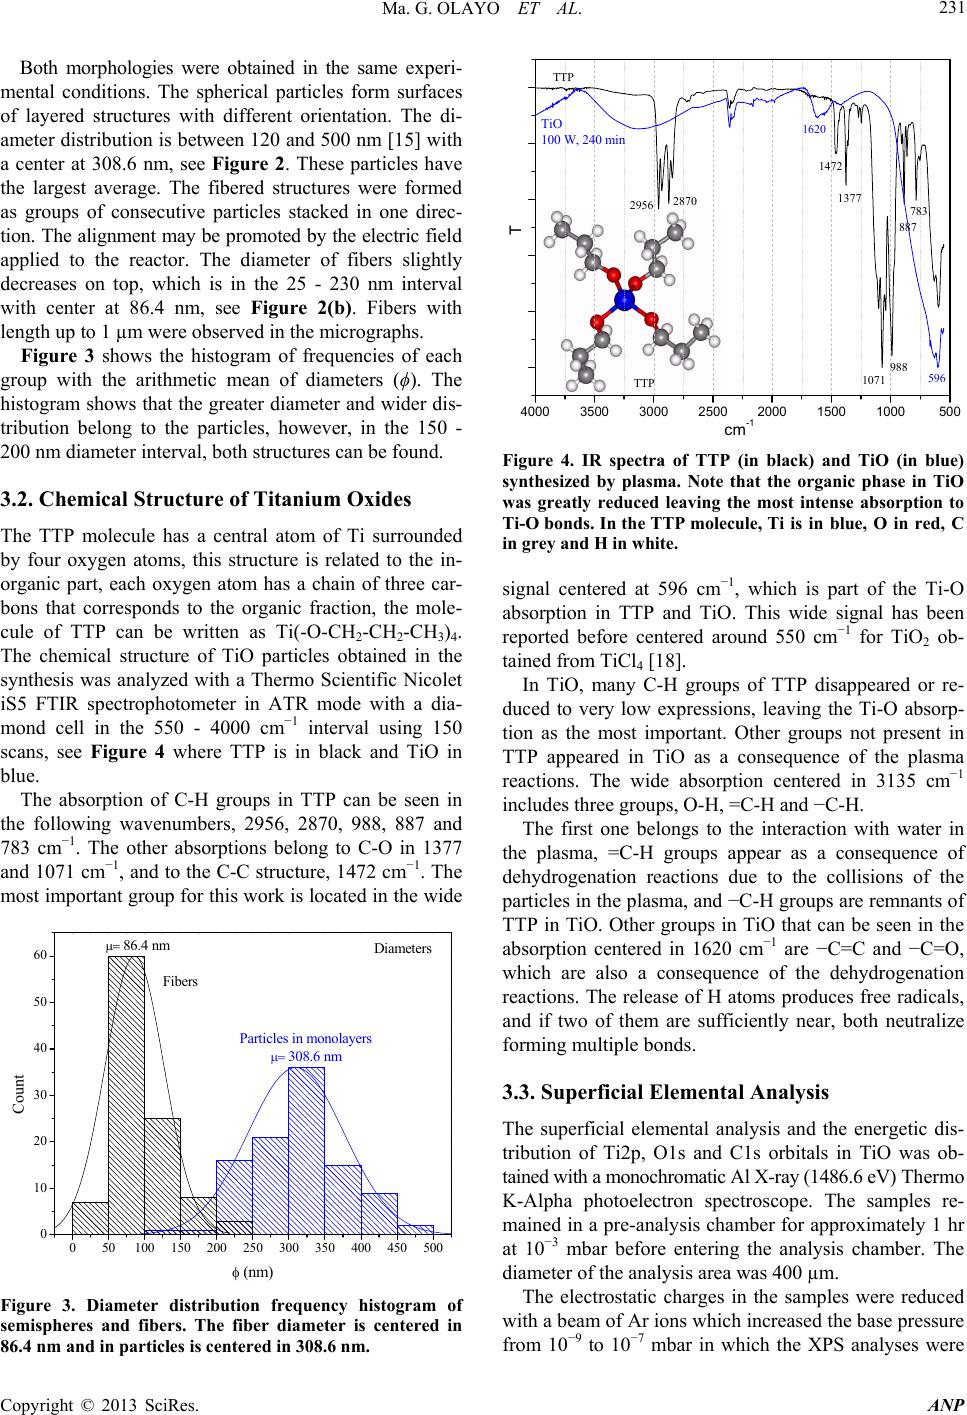 Ma. G. OLAYO ET AL. 231 Both morphologies were obtained in the same experi- mental conditions. The spherical particles form surfaces of layered structures with different orientation. The di- ameter distribution is between 120 and 500 nm [15] with a center at 308.6 nm, see Figure 2. These particles have the largest average. The fibered structures were formed as groups of consecutive particles stacked in one direc- tion. The alignment may be promoted by the electric field applied to the reactor. The diameter of fibers slightly decreases on top, which is in the 25 - 230 nm interval with center at 86.4 nm, see Figure 2(b). Fibers with length up to 1 µm were observed in the micrographs. Figure 3 shows the histogram of frequencies of each group with the arithmetic mean of diameters (ϕ). The histogram shows that the greater diameter and wider dis- tribution belong to the particles, however, in the 150 - 200 nm diameter interval, both structures can be found. 3.2. Chemical Structure of Titanium Oxides The TTP molecule has a central atom of Ti surrounded by four oxygen atoms, this structure is related to the in- organic part, each oxygen atom has a chain of three car- bons that corresponds to the organic fraction, the mole- cule of TTP can be written as Ti(-O-CH2-CH2-CH3)4. The chemical structure of TiO particles obtained in the synthesis was analyzed with a Thermo Scientific Nicolet iS5 FTIR spectrophotometer in ATR mode with a dia- mond cell in the 550 - 4000 cm−1 interval using 150 scans, see Figure 4 where TTP is in black and TiO in blue. The absorption of C-H groups in TTP can be seen in the following wavenumbers, 2956, 2870, 988, 887 and 783 cm−1. The other absorptions belong to C-O in 1377 and 1071 cm−1, and to the C-C structure, 1472 cm−1. The most important group for this work is located in the wide 050100 150 200 250 300 350 400 450 500 0 10 20 30 40 50 60 308.6 nm Count (nm) 86.4 nm Fibers Particles in monolayers Diameters Figure 3. Diameter distribution frequency histogram of semispheres and fibers. The fiber diameter is centered in 86.4 nm and in particles is centered in 308.6 nm. 4000 35003000 25002000 1500 1000500 TTP T cm-1 TTP TiO 100 W, 240 min 1377 1472 1071 988 596 783 887 2956 2870 1620 Figure 4. IR spectra of TTP (in black) and TiO (in blue) synthesized by plasma. Note that the organic phase in TiO was greatly reduced leaving the most intense absorption to Ti-O bonds. In the TTP molecule, Ti is in blue, O in red, C in grey and H in white. signal centered at 596 cm−1, which is part of the Ti-O absorption in TTP and TiO. This wide signal has been reported before centered around 550 cm−1 for TiO2 ob- tained from TiCl4 [18]. In TiO, many C-H groups of TTP disappeared or re- duced to very low expressions, leaving the Ti-O absorp- tion as the most important. Other groups not present in TTP appeared in TiO as a consequence of the plasma reactions. The wide absorption centered in 3135 cm−1 includes three groups, O-H, =C-H and −C-H. The first one belongs to the interaction with water in the plasma, =C-H groups appear as a consequence of dehydrogenation reactions due to the collisions of the particles in the plasma, and −C-H groups are remnants of TTP in TiO. Other groups in TiO that can be seen in the absorption centered in 1620 cm−1 are −C=C and −C=O, which are also a consequence of the dehydrogenation reactions. The release of H atoms produces free radicals, and if two of them are sufficiently near, both neutralize forming multiple bonds. 3.3. Superficial Elemental Analysis The superficial elemental analysis and the energetic dis- tribution of Ti2p, O1s and C1s orbitals in TiO was ob- tained with a monochromatic Al X-ray (1486.6 eV) Thermo K-Alpha photoelectron spectroscope. The samples re- mained in a pre-analysis chamber for approximately 1 hr at 10−3 mbar before entering the analysis chamber. The diameter of the analysis area was 400 µm. The electrostatic charges in the samples were reduced with a beam of Ar ions which increased the base pressure from 10−9 to 10−7 mbar in which the XPS analyses were Copyright © 2013 SciRes. ANP  Ma. G. OLAYO ET AL. 232 performed. The elements involved in the analyses were Ti, O, C and N and are presented in Figure 5 in survey mode. This last element has a small participation (0.46%) and can be due to the atmospheric interaction. The ele- mental content of Ti is 16.91% and O is 46.34% with an x = 2.74 (O/Ti atomic ratio). This means that there are less oxygen atoms than in TTP molecules (x = 4), but more than in TiO2 compounds with crystalline phases (x = 2). However, O atoms can bond to C and Ti, which displace the O/Ti ratio from 2. The content of C atoms was reduced from 70.58% in TTP to 36.29% in TiO in- dicating that the degradation of TTP molecules worked in at least 50%. 3.4. Chemical States in TiO The analysis of the chemical states in TiO particles was based on the electronic energetic distribution of Ti2p, O1s and C1s orbitals and on different chemical states that may appear with the degradation of TTP molecules in plasmas. The specific energetic atomic states were stud- ied adjusting the distribution of the orbitals with internal Gaussian curves considering the full width at half maxi- mum (FWHM) parameters based on the Crist work for advanced fitting of monochromatic XPS spectra [19]. As the internal curves become wider, more chemical states can be included in them. Each energetic state can be associated with atomic chemical states involving all bonding orbitals shared in the atoms, and although the bonding orbitals are in the exterior electronic shell and the orbitals analyzed in XPS are further inside the atomic structure, any modification in the valence orbitals adjust the energetic equilibrium of the entire atom, modifying the orbitals studied in the XPS analysis. Neighboring atoms also exert influence in the energetic distribution of the atoms, although they are 0100 200 300 400 500 600 700 80090010001100 At. % ------- 16.91 46.34 36.29 0.46 Elem ------- Ti2p O1s C1s N1s I (Adim) BE (eV) O1s Ti2p C1s XPS Survey TiO powder 4 hrs, 100 W O/Ti=2.74 C/Ti=2.15 Figure 5. XPS survey of TiO powder. The elemental content and atomic ratios are included. not directly bonded. Thus, in analyzing the energy dis- tribution of orbitals, the whole chemical environment has to be considered. The scattered points in the following graphs represent the electronic binding energy (BE) of orbitals obtained with the spectroscope, the blue internal curves represent the deconvoluted distribution of the orbital and the red line represents the sum of all adjusted curves along BE. The representation of the atomic chemical states in this work was done including all the possible bonding com- binations. The notation used in this work indicates that the atom in bold face is bonded with all atoms in the formula. For example, the most common chemical state of Ti in TiO is O2-Ti-O2, in which the central Ti atom is bonded in its own spatial configuration with 4 O atoms. In the same trend, C-CH2-C represents a C atom sur- rounded by 2 C and 2 H atoms, and C3-C-H indicates a C atom surrounded by 3 C and 1 H atom. If it is possible, both sides of the central atom are used to clarify the structure. 3.5. Ti Chemical States Ti chemical states were studied with the energetic distri- bution of Ti2p 3/2 orbitals, see Figure 6. Ti2p has a bi- modal electronic distribution belonging to the 1/2 and 3/2 orbitals [20], in which the most intense signal belongs to the 2p 3/2 orbital, which is studied in this work. The 3/2 orbital was observed from 456.5 to 460.6 eV and was adjusted with 3 internal gaussian curves, FWHM ≤ 1.05 eV, which represent 3 Ti energetic states. The greatest participation, 84.31%, was obtained with Curve 2 centered at 458.74 eV, which can be assigned to Ti surrounded by oxygen atoms, O2-Ti-O2. This state is also the core of TTP molecules and it is found in the ma- 456.5 457.0 457.5 458.0 458.5 459.0 459.5 460.0 460.5 461.0 O l O-Ti-O l C O l O-Ti-O l O Ti l O-Ti-O l O I (Adim) BE (eV) BE max (eV) 1- 457.97 2- 458.74 3- 459.40 Area (%) 8.71 84.31 6.98 1 2 3 Orbital Ti 2p 3/2 TiO 100 W, 240 min TTP Figure 6. Energetic distribution of Ti2p 3/2 orbital in TiO particles. Note that the main Ti chemical state in TTP, O2-Ti-O2, was preserved in 84.31% in the final compounds. Copyright © 2013 SciRes. ANP 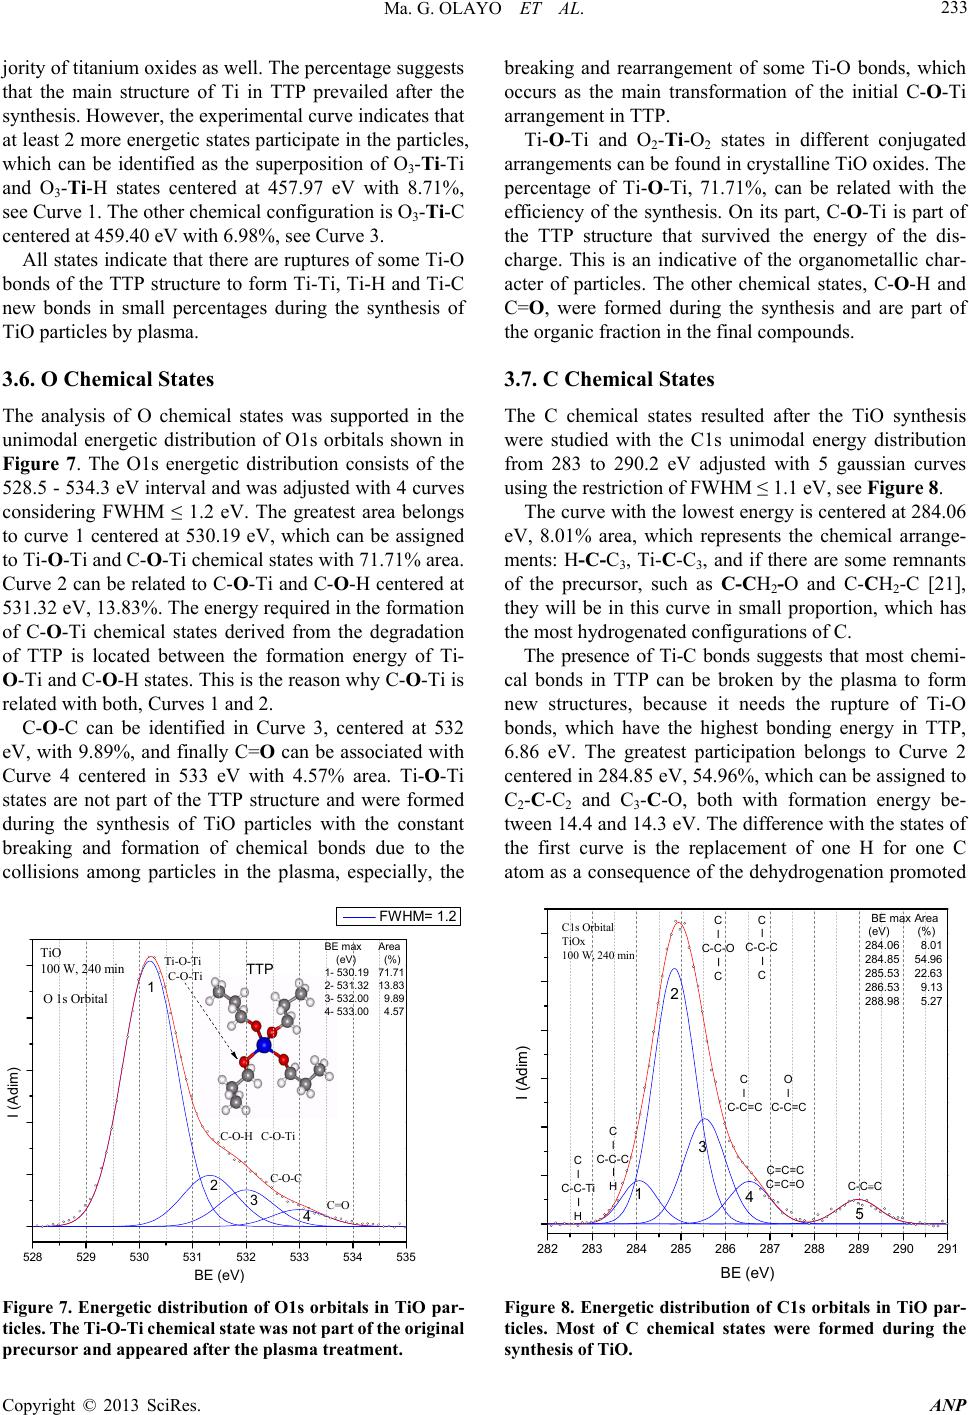 Ma. G. OLAYO ET AL. 233 jority of titanium oxides as well. The percentage suggests that the main structure of Ti in TTP prevailed after the synthesis. However, the experimental curve indicates that at least 2 more energetic states participate in the particles, which can be identified as the superposition of O3-Ti-Ti and O3-Ti-H states centered at 457.97 eV with 8.71%, see Curve 1. The other chemical configuration is O3-Ti-C centered at 459.40 eV with 6.98%, see Curve 3. All states indicate that there are ruptures of some Ti-O bonds of the TTP structure to form Ti-Ti, Ti-H and Ti-C new bonds in small percentages during the synthesis of TiO particles by plasma. 3.6. O Chemical States The analysis of O chemical states was supported in the unimodal energetic distribution of O1s orbitals shown in Figure 7. The O1s energetic distribution consists of the 528.5 - 534.3 eV interval and was adjusted with 4 curves considering FWHM ≤ 1.2 eV. The greatest area belongs to curve 1 centered at 530.19 eV, which can be assigned to Ti-O-Ti and C-O-Ti chemical states with 71.71% area. Curve 2 can be related to C-O-Ti and C-O-H centered at 531.32 eV, 13.83%. The energy required in the formation of C-O-Ti chemical states derived from the degradation of TTP is located between the formation energy of Ti- O-Ti and C-O-H states. This is the reason why C-O-Ti is related with both, Curves 1 and 2. C-O-C can be identified in Curve 3, centered at 532 eV, with 9.89%, and finally C=O can be associated with Curve 4 centered in 533 eV with 4.57% area. Ti-O-Ti states are not part of the TTP structure and were formed during the synthesis of TiO particles with the constant breaking and formation of chemical bonds due to the collisions among particles in the plasma, especially, the 528 529 530 531 532 533 534 535 C-O-Ti C-O-Ti C=O C-O-C C-O-H Ti-O-Ti I (Adim) BE (eV) FWHM= 1.2 BE max (eV) 1- 530.19 2- 531.32 3- 532.00 4- 533.00 Area (%) 71.71 13.83 9.89 4.57 1 234 TTP TiO 100 W, 240 min O 1s Orbital Figure 7. Energetic distribution of O1s orbitals in TiO par- ticles. The Ti-O-Ti chemical state was not part of the original precursor and appeared after the plasma treatment. breaking and rearrangement of some Ti-O bonds, which occurs as the main transformation of the initial C-O-Ti arrangement in TTP. Ti-O-Ti and O2-Ti-O2 states in different conjugated arrangements can be found in crystalline TiO oxides. The percentage of Ti-O-Ti, 71.71%, can be related with the efficiency of the synthesis. On its part, C-O-Ti is part of the TTP structure that survived the energy of the dis- charge. This is an indicative of the organometallic char- acter of particles. The other chemical states, C-O-H and C=O, were formed during the synthesis and are part of the organic fraction in the final compounds. 3.7. C Chemical States The C chemical states resulted after the TiO synthesis were studied with the C1s unimodal energy distribution from 283 to 290.2 eV adjusted with 5 gaussian curves using the restriction of FWHM ≤ 1.1 eV, see Figure 8. The curve with the lowest energy is centered at 284.06 eV, 8.01% area, which represents the chemical arrange- ments: H-C-C3, Ti-C-C3, and if there are some remnants of the precursor, such as C-CH2-O and C-CH2-C [21], they will be in this curve in small proportion, which has the most hydrogenated configurations of C. The presence of Ti-C bonds suggests that most chemi- cal bonds in TTP can be broken by the plasma to form new structures, because it needs the rupture of Ti-O bonds, which have the highest bonding energy in TTP, 6.86 eV. The greatest participation belongs to Curve 2 centered in 284.85 eV, 54.96%, which can be assigned to C2-C-C2 and C3-C-O, both with formation energy be- tween 14.4 and 14.3 eV. The difference with the states of the first curve is the replacement of one H for one C atom as a consequence of the dehydrogenation promoted 282 283 284 285 286 287 288 289 290 291 C l C-C-O I C C1s Orbital TiOx 100 W, 240 min C l C-C-Ti I H I (Adim) BE (eV) 1 2 3 45 C l C-C-C I H C l C-C-C I C C l C-C=C O l C-C=C C=C=O C=C=C C-CC BE max (eV) 284.06 284.85 285.53 286.53 288.98 Area (%) 8.01 54.96 22.63 9.13 5.27 Figure 8. Energetic distribution of C1s orbitals in TiO par- ticles. Most of C chemical states were formed during the synthesis of TiO. Copyright © 2013 SciRes. ANP 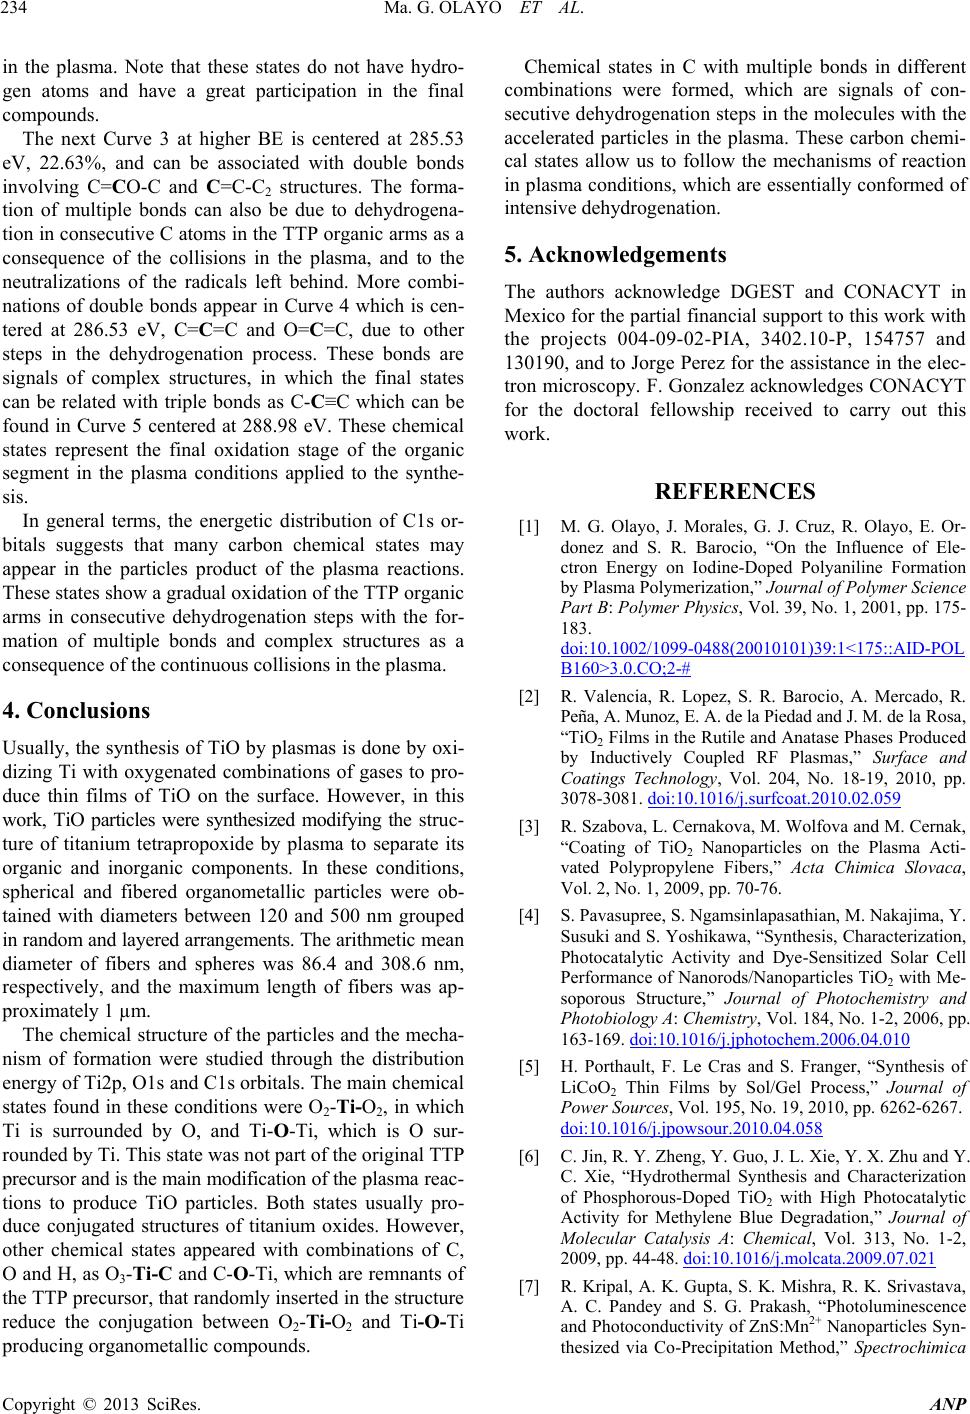 Ma. G. OLAYO ET AL. 234 in the plasma. Note that these states do not have hydro- gen atoms and have a great participation in the final compounds. The next Curve 3 at higher BE is centered at 285.53 eV, 22.63%, and can be associated with double bonds involving C=CO-C and C=C-C2 structures. The forma- tion of multiple bonds can also be due to dehydrogena- tion in consecutive C atoms in the TTP organic arms as a consequence of the collisions in the plasma, and to the neutralizations of the radicals left behind. More combi- nations of double bonds appear in Curve 4 which is cen- tered at 286.53 eV, C=C=C and O=C=C, due to other steps in the dehydrogenation process. These bonds are signals of complex structures, in which the final states can be related with triple bonds as C-C≡C which can be found in Curve 5 centered at 288.98 eV. These chemical states represent the final oxidation stage of the organic segment in the plasma conditions applied to the synthe- sis. In general terms, the energetic distribution of C1s or- bitals suggests that many carbon chemical states may appear in the particles product of the plasma reactions. These states show a gradual oxidation of the TTP organic arms in consecutive dehydrogenation steps with the for- mation of multiple bonds and complex structures as a consequence of the continuous collisions in the plasma. 4. Conclusions Usually, the synthesis of TiO by plasmas is done by oxi- dizing Ti with oxygenated combinations of gases to pro- duce thin films of TiO on the surface. However, in this work, TiO particles were synthesized modifying the struc- ture of titanium tetrapropoxide by plasma to separate its organic and inorganic components. In these conditions, spherical and fibered organometallic particles were ob- tained with diameters between 120 and 500 nm grouped in random and layered arrangements. The arithmetic mean diameter of fibers and spheres was 86.4 and 308.6 nm, respectively, and the maximum length of fibers was ap- proximately 1 µm. The chemical structure of the particles and the mecha- nism of formation were studied through the distribution energy of Ti2p, O1s and C1s orbitals. The main chemical states found in these conditions were O2-Ti-O2, in which Ti is surrounded by O, and Ti-O-Ti, which is O sur- rounded by Ti. This state was not part of the original TTP precursor and is the main modification of the plasma reac- tions to produce TiO particles. Both states usually pro- duce conjugated structures of titanium oxides. However, other chemical states appeared with combinations of C, O and H, as O3-Ti-C and C-O-Ti, which are remnants of the TTP precursor, that randomly inserted in the structure reduce the conjugation between O2-Ti-O2 and Ti-O-Ti producing organometallic compounds. Chemical states in C with multiple bonds in different combinations were formed, which are signals of con- secutive dehydrogenation steps in the molecules with the accelerated particles in the plasma. These carbon chemi- cal states allow us to follow the mechanisms of reaction in plasma conditions, which are essentially conformed of intensive dehydrogenation. 5. Acknowledgements The authors acknowledge DGEST and CONACYT in Mexico for the partial financial support to this work with the projects 004-09-02-PIA, 3402.10-P, 154757 and 130190, and to Jorge Perez for the assistance in the elec- tron microscopy. F. Gonzalez acknowledges CONACYT for the doctoral fellowship received to carry out this work. REFERENCES [1] M. G. Olayo, J. Morales, G. J. Cruz, R. Olayo, E. Or- donez and S. R. Barocio, “On the Influence of Ele- ctron Energy on Iodine-Doped Polyaniline Formation by Plasma Polymerization,” Journal of Polymer Science Part B: Polymer Physics, Vol. 39, No. 1, 2001, pp. 175- 183. doi:10.1002/1099-0488(20010101)39:1<175::AID-POL B160>3.0.CO;2-# [2] R. Valencia, R. Lopez, S. R. Barocio, A. Mercado, R. Peña, A. Munoz, E. A. de la Piedad and J. M. de la Rosa, “TiO2 Films in the Rutile and Anatase Phases Produced by Inductively Coupled RF Plasmas,” Surface and Coatings Technology, Vol. 204, No. 18-19, 2010, pp. 3078-3081. doi:10.1016/j.surfcoat.2010.02.059 [3] R. Szabova, L. Cernakova, M. Wolfova and M. Cernak, “Coating of TiO2 Nanoparticles on the Plasma Acti- vated Polypropylene Fibers,” Acta Chimica Slovaca, Vol. 2, No. 1, 2009, pp. 70-76. [4] S. Pavasupree, S. Ngamsinlapasathian, M. Nakajima, Y. Susuki and S. Yoshikawa, “Synthesis, Characterization, Photocatalytic Activity and Dye-Sensitized Solar Cell Performance of Nanorods/Nanoparticles TiO2 with Me- soporous Structure,” Journal of Photochemistry and Photobiology A: Chemistry, Vol. 184, No. 1-2, 2006, pp. 163-169. doi:10.1016/j.jphotochem.2006.04.010 [5] H. Porthault, F. Le Cras and S. Franger, “Synthesis of LiCoO2 Thin Films by Sol/Gel Process,” Journal of Power Sources, Vol. 195, No. 19, 2010, pp. 6262-6267. doi:10.1016/j.jpowsour.2010.04.058 [6] C. Jin, R. Y. Zheng, Y. Guo, J. L. Xie, Y. X. Zhu and Y. C. Xie, “Hydrothermal Synthesis and Characterization of Phosphorous-Doped TiO2 with High Photocatalytic Activity for Methylene Blue Degradation,” Journal of Molecular Catalysis A: Chemical, Vol. 313, No. 1-2, 2009, pp. 44-48. doi:10.1016/j.molcata.2009.07.021 [7] R. Kripal, A. K. Gupta, S. K. Mishra, R. K. Srivastava, A. C. Pandey and S. G. Prakash, “Photoluminescence and Photoconductivity of ZnS:Mn2+ Nanoparticles Syn- thesized via Co-Precipitation Method,” Spectrochimica Copyright © 2013 SciRes. ANP  Ma. G. OLAYO ET AL. Copyright © 2013 SciRes. ANP 235 Acta Part A: Molecular and Biomolecular Spectroscopy, Vol. 76, No. 5, 2010, pp. 523-530. doi:10.1016/j.saa.2010.04.018 [8] C.-H. Huang, Y.-T. Yang and R.-A. Doong, “Micro- wave-Assisted Hydrothermal Synthesis of Mesoporous Anatase TiO2 via Sol-Gel Process for Dye-Sensitized Solar Cells,” Microporous and Mesoporous Materials, Vol. 142, No. 2, 2011, pp. 473-480. doi:10.1016/j.micromeso.2010.12.038 [9] J. K. Ani, S. Savithri and G. D. Surender, “Characteris- tics of Titania Nanoparticles Synthesized through Low Temperature Aerosol Process,” Aerosol and Air Quality Research, Vol. 5, No. 1, 2005, pp. 1-13. [10] W. Li, S. I. Shah, M. Sung and C.-P. Huang, “Structure and Size Distribution of TiO2 Nanoparticles Deposited on Stainless Steel Mesh,” Journal of Vacuum Science & Technology B: Microelectronics and Nanometer Stru- ctures, Vol. 20, No. 6, 2002, pp. 2303-2308. doi:10.1116/1.1520557 [11] M. G. Olayo, M. L. Arreola, G. J. Cruz, G. Garcia-Ro- sales, S. Gonzalez-Castillo, L. M. Gomez and M. Gon- zalez-Torres, “Synthesis of Ti-O Superficial Compos- ites by Plasmas of Titanium Tetraisopropoxide,” Mac- romolecular Symposia, Vol. 325-326, No. 1, 2013, pp. 105-111. doi:10.1002/masy.201200047 [12] C. Massard, D. Bourdeaux, V. Raspal, E. Feschet-Cha- ssot, Y. Sibaud, E. Caudron, T. Devers and K. O. Awi- tor, “One-Pot Synthesis of TiO2 Nanoparticles in Sus- pensions for Quantification of Titanium Debris Re- lease in Biological Liquids,” Advances in Nanoparticles, Vol. 1, No. 3, 2012, pp. 86-94. doi:10.4236/anp.2012.13012 [13] M. Gouda and A. I. Aljaafari, “Augmentation of Multi- functional Properties of Cellulosic Cotton Fabric Using Titanium Dioxide Nanoparticles,” Advances in Nano- particles, Vol. 1, No. 3, 2012, pp. 29-36. [14] R. Valencia-Alvarado, R. Lopez-Callejas, S. R. Barocio, A. Mercado-Cabrera, R. Peña-Eguiluz, A. E. Muñoz- Castro, A. Piedad-Beneitez and J. M. Rosa-Vazquez, “Titanium Oxidation by RF Inductively Coupled Plas- ma,” International Journal of Nanomanufacturing, Vol. 5, No. 1-2, 2010, pp. 62-68. doi:10.1504/IJNM.2010.029923 [15] C. Chen, H. Bai, H. M. Chein and T. M. Chen, “Con- tinuous Generation of TiO2 Nanoparticles by an At- mospheric Pressure Plasma-Enhanced Process,” Aero- sol Science and Technology, Vol. 41, No. 11, 2007, pp. 1018-1028. doi:10.1080/02786820701694355 [16] F. Gonzalez-Salgado, M. G. Olayo, G. J. Cruz, L. M. Gomez, E. Ordoñez and G. Garcia-Rosales, “Synthesis of Titanium Oxide Nanoparticles by Plasma,” Super- ficies y Vacio, Vol. 25, No. 1, 2012, pp. 56-59. [17] F. Gonzalez-Salgado, G. J. Cruz, M. G. Olayo, G. Gar- cia-Rosales and L. M. Gomez, “Organometallic Tita- nium Oxides Obtained by Low-Pressure Plasmas of Water on Titanium Tetrapropoxide,” Advances in Ma- terials Physics and Chemistry, Vol. 2, No. 4, 2012, pp. 212-218. doi:10.4236/ampc.2012.24032 [18] J. M. Hernandez, L. A. Garcia, B. H. Zeifert, R. Garcia, B. B. Zermeño, T. Del Angel and A. Cueto, “Síntesis y Caracterización de Nanopartículas de N-TiO2—Ana- tasa,” Superficies y Vacio, Vol. 21, No. 4, 2008, pp. 1-5. [19] B. V. Crist, “Advanced Peak-Fitting of Monochromatic XPS Spectra,” Journal of Surface Analysis, Vol. 4, No. 3, 1998, pp. 428-434. [20] D. Kumar, M. S. Chen and D. W. Goodman, “Characte- rization of Ultra-Thin TiO2 Films Grown on Mo(112),” Thin Solid Films, Vol. 515, No. 4, 2006, pp. 1475-1479. doi:10.1016/j.tsf.2006.04.014 [21] J. Wan, R. Q. Zhang and H. F. Cheung, “Energetics of Ti Atom Diffusion into Diamond Film,” Computation Materials Science, Vol. 23, No. 1, 2002, pp. 73-79.
|