Paper Menu >>
Journal Menu >>
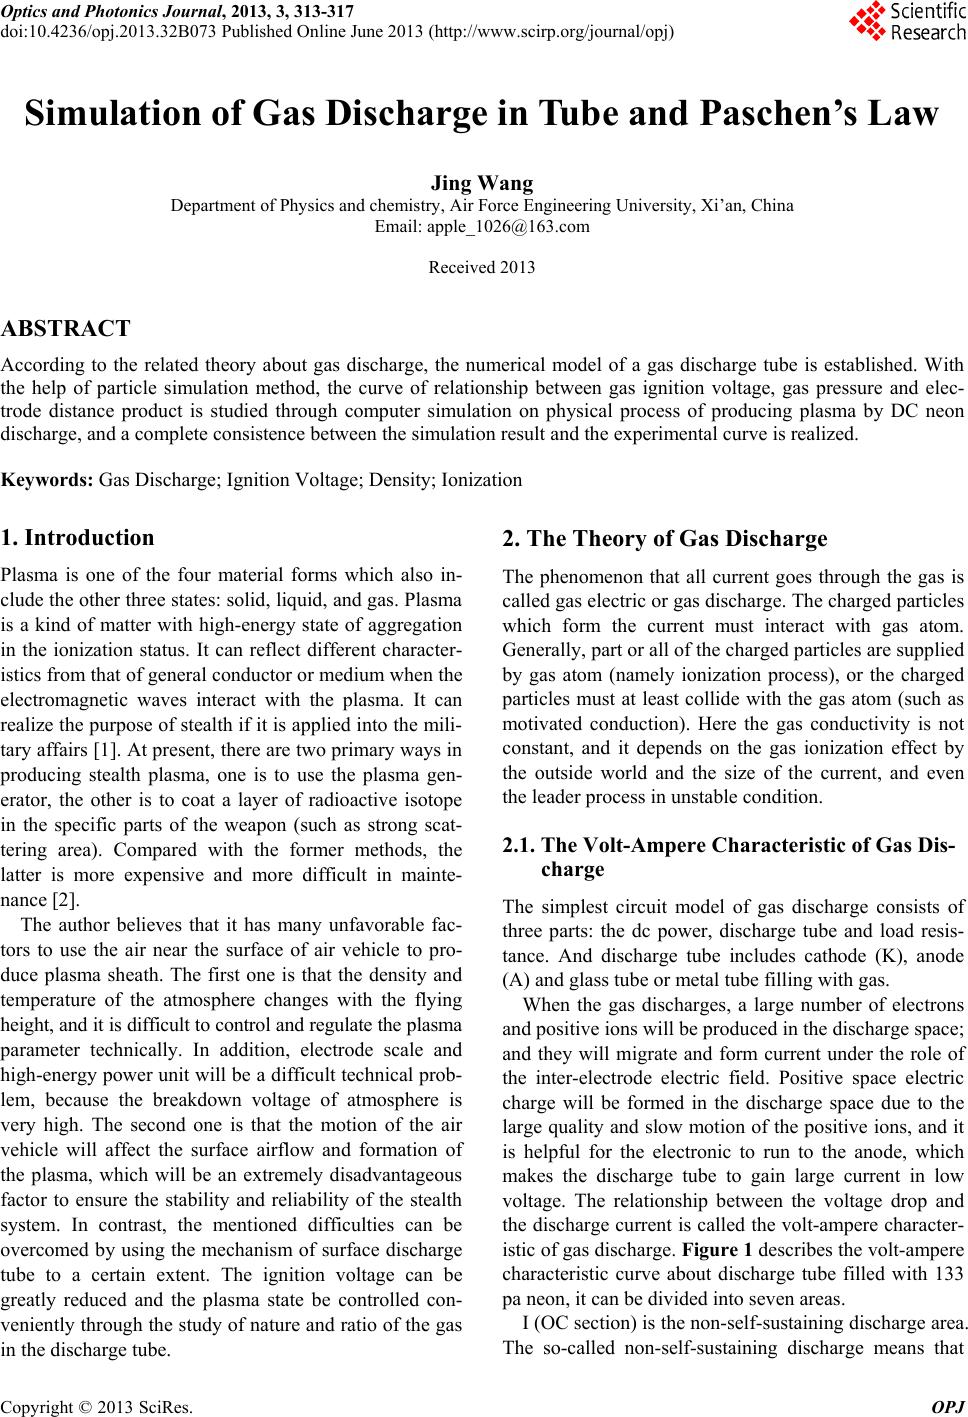 Optics and Photonics Journal, 2013, 3, 313-317 doi:10.4236/opj.2013.32B073 Published Online June 2013 (http://www.scirp.org/journal/opj) Simulation of Gas Discharge in Tube and Paschen’s Law Jing Wang Department of Physics and chemistry, Air Force Engineering University, Xi’an, China Email: apple_1026@163.com Received 2013 ABSTRACT According to the related theory about gas discharge, the numerical model of a gas discharge tube is established. With the help of particle simulation method, the curve of relationship between gas ignition voltage, gas pressure and elec- trode distance product is studied through computer simulation on physical process of producing plasma by DC neon discharge, and a complete consistence between the simulation result and the experimental curve is realized. Keywords: Gas Discharge; Ignition Voltage; Density; Ionization 1. Introduction Plasma is one of the four material forms which also in- clude the other three states: solid, liquid, and gas. Plasma is a kind of matter with high-energy state of aggregation in the ionization status. It can reflect different character- istics from that of general conductor or medium when the electromagnetic waves interact with the plasma. It can realize the purpose of stealth if it is applied into the mili- tary affairs [1]. At present, there are two primary ways in producing stealth plasma, one is to use the plasma gen- erator, the other is to coat a layer of radioactive isotope in the specific parts of the weapon (such as strong scat- tering area). Compared with the former methods, the latter is more expensive and more difficult in mainte- nance [2]. The author believes that it has many unfavorable fac- tors to use the air near the surface of air vehicle to pro- duce plasma sheath. The first one is that the density and temperature of the atmosphere changes with the flying height, and it is difficult to control and regulate the plasma parameter technically. In addition, electrode scale and high-energy power unit will be a difficult technical prob- lem, because the breakdown voltage of atmosphere is very high. The second one is that the motion of the air vehicle will affect the surface airflow and formation of the plasma, which will be an extremely disadvantageous factor to ensure the stability and reliability of the stealth system. In contrast, the mentioned difficulties can be overcomed by using the mechanism of surface discharge tube to a certain extent. The ignition voltage can be greatly reduced and the plasma state be controlled con- veniently through the study of nature and ratio of the gas in the discharge tube. 2. The Theory of Gas Discharge The phenomenon that all current goes through the gas is called gas electric or gas discharge. The charged particles which form the current must interact with gas atom. Generally, part or all of the charged particles are supplied by gas atom (namely ionization process), or the charged particles must at least collide with the gas atom (such as motivated conduction). Here the gas conductivity is not constant, and it depends on the gas ionization effect by the outside world and the size of the current, and even the leader process in unstable condition. 2.1. The Volt-Ampere Characteristic of Gas Dis- charge The simplest circuit model of gas discharge consists of three parts: the dc power, discharge tube and load resis- tance. And discharge tube includes cathode (K), anode (A) and glass tube or metal tube filling with gas. When the gas discharges, a large number of electrons and positive ions will be produced in the discharge space; and they will migrate and form current under the role of the inter-electrode electric field. Positive space electric charge will be formed in the discharge space due to the large quality and slow motion of the positive ions, and it is helpful for the electronic to run to the anode, which makes the discharge tube to gain large current in low voltage. The relationship between the voltage drop and the discharge current is called the volt-ampere character- istic of gas discharge. Figure 1 describes the volt-ampere characteristic curve about discharge tube filled with 133 pa neon, it can be divided into seven areas. I (OC section) is the non-self-sustaining discharge area. The so-called non-self-sustaining discharge means that Copyright © 2013 SciRes. OPJ  J. WANG 314 the initial charged particles are caused by outside ioniza- tion source, and discharge stopped immediately when the outside ionization source is removed. II (CD section) is the self-sustaining dark discharge area. This kind of discharge means that the medium conduc- tivity remains and continuous discharge is resulted in by the ways that the regeneration of ionization offsets the composites and its loss mechanism. The corresponding voltage of C point is the ignition voltage, and tube volt- age drop is close to the power voltage. But the discharge current is still very low and light is faint, so, it is called dark discharge. III (DE section) is the transition area and remains ex- tremely unstable. It will quickly transfer to E point as soon as the circuit current increases slightly. IV (EF section) is the normal glow discharge area. In this area, the tube voltage drop keeps almost unchanged if current increases. Gas discharge will produce glow in this area, therefore it is named. V (FG section) is the abnormal glow discharge area. In this area, the tube voltage drop will grow along with the increasing of the current. VI (GH section) is the transition to arc discharge area. VII (after H) is the arc discharge area. Bright arc will occur in the tube while discharging, meanwhile tube voltage drop is lower and current is larger. From the volt-ampere characteristic we can obtain that the gas discharge has two stable discharge areas: normal glow discharge area and arc discharge area [3]. 2.2. Townsend’s Discharge Theory British physicist Townsend holds the opinion that when the electrons move in a homogeneous electric field, on the one hand, they will continue to get energy from the field, on the other hand, the energy will lose because ionization caused by electrons impact gas atoms. As a result, the two parts of energy should be equal while the two kinds of effect achieve balance. When the charged particles generated by impact ionization are accelerated by electric field, new impact ionization can be caused. Ua (V) 600 800 1010 -5 10 -15 10 -12 10 -4 10 -1 1 I (A) Ⅰ Ⅱ Ⅳ Ⅲ Ⅴ Ⅵ Ⅶ O C D EF G H 400 0 Figure 1. Volt-ampere characteristic curve. When thode, im 2.3. Gas Breakdown and Paschen’s Law gree, igni- tio arge Tube in an initial electron runs to anode from ca pact ionization will occur in order 1, 2, 3, and 4 and so on. And new generated electrons will also run to anode and cause new impact ionization, the electron number which move to anode will increase correspondingly to 2, 4, 8, and 16 and so on. It is called electron avalanche because electrons become more and more like avalanche growth. The avalanche theory can apply to the discharge area in which directed movement of the electrons is dominant and random thermal motion of the electrons is secondary. When the external voltage is raised to a certain de discharge mode turns into glow discharge or spark dis- charge and the conversion process is breakdown. The inter-electrode voltage needed for the transition from non-self-sustaining discharge to self-sustaining discharge is called ignition voltage or breakdown voltage, and this is an important parameter of gas discharge device. Through measuring the relationship between the n voltage and breakdown distance and gas pressure Paschen discovered a law that: the homogeneous field will be formed between the inter-electrodes after apply- ing DC voltage to the two parallel plate electrodes. The inter-electrode distance is made as d(mm) and pressure is p(Pa), if gas components and electrode stuff are assured, and the gas is homoiothermal, then ignition voltage Ub is a function of pd instead of the two variables: p and d , under the cold electrode condition, and Ub have a mini- mum Ubmin when the numerical value of pd is changed. Later, the law is called Paschen’s Law [4]. 3. Simulation of Gas Discharge 3.1. The Numerical Model of Disch The numerical model of gas discharge tube established this paper is shown in Fig ure 2. A K x zi) ( y (j) Figure 2. Numerical model. Copyright © 2013 SciRes. OPJ  J. WANG 315 The upper and the lower boundaries are plane parallel electrodes (secoentndary electron emission coeffici 0.40 ), in = 13 133Pa·cm), and adjust the . Then the variable curves the middle is the discharge gap, and discharge gas Ne (anode-to-kathode distance d = 20 cm, pressure p 3 Pa) is sealed. The gas in the discharge gap will discharge and produce plasma when some certain voltage is added on the electrodes. 3.2. Results of Simulation First, given pd value is 10 (× voltage Ua between electrodes as shown in Figure 3 to Figure 8 about charged particle density at discharge gap will be obtained while Ua gradu- ally increases. 0.0 0.4 t(μs) 0 1.874(×10 4 ) n(/m3) Figure 3. Electron density curve (Ua = 150 V). ×10 6 ) n(/m 3 ) t(μs) 0.0 0.4 0 1.017( Figure 4. Ion density curve (a = 150 V). 0.4 t (μs) 0.226 1. n(×10 4 /m 3 ) 874 0.0 n(/m 3 ) 1.700(×10 3 ) 0.0 0. 2.682(×10 6 ) 4 t(μs) Figure 6. Ion density curve(Ua = 300 V). 0.0 0.4 1.788(×104) 2.08 8( ×10 9) n(/m 3 ) t(μs) Figure 7. Electron density curve (Ua = 400 V). 1.700(×10 3 ) 7.762(×10 9 ) n(/m 3 ) t(μs) 0.0 0.4 Figure 8. Electron density curve (Ua = 400 V). Figures 3 and 4 show the changing rule of charged particles density when applied voltage is lower than igni- tion voltage. At this point, the electron density can quickly reduce to zero, and the ion density will increase first and then decrease gradually to zero, the gas discharge cannot last. Figures 5 and 6 indicate that the density of charged particles will increase in accordance with the index law when the applied voltage just reaches the ignition voltage, and it is the result of electron avalanche. Figures 7 and 8 show that the increasing of electron density and ion sity ter an ignition voltage. According to the above phenomena, w den- are more apparent when applied voltage is grea th e can get a critical value of inter-electrode voltage at dif- ferent Figure 5. Electron density curv(Ua = 300 V). Copyright © 2013 SciRes. OPJ  J. WANG Copyright © 2013 SciRes. OPJ 316 cor 5 Table 1. pd and responding UB. pd (×133Pa·cm) 1 2 3 10 20 30 50 100 200 Ub(V) 360 270 230 260 300 350 480 600 750 〉1000 0 1 2 3 5 10203050100 900 200 300 400 500 600 700 800 U b (V) pd(×133P a·cm) Figure 9. Simulation curve. values of pd by changing the external condition such as gas pressure p and inter-electrode distance d, here the voltage is the ignition voltage. Record each ignition voltage measured as is shown in Table 1. We draw the corresponding curve as shown in Figure 9 according to the data in Table 1. The curve has the following features: U has a bearing le the pd value in e increasing intensity of mulation curve in the same direction. In pletely, which can eliminate the error between MCC method and experiment and can correct the program. The changing rule that ignition voltage varies with the value of gas pd is shown in Figure 9. And the phenome- non can be interpreted as whepd is very low, the colli- ncy or ratio will increase if value of pd in- creases, but the probability of ionization changes little, the to n sion freque b on pd product; the curve goes down first and then rises with a minimum value; the curve in the left of the mini- mum value is very steep, but that in the right is relatively smooth. Two conflicting factors work whi creases. On the one hand, the colliding numbers of electrons and atoms grow due to th pressure, and it is favorable for discharge. On the other hand, average free path decreases and the energy that the electrons obtain from the electric field also re- duces in each free path, and it is unfavorable for dis- charge. The ignition voltage depends on the contrast of these two factors. It’s worth mentioning that the simulation results of the voltage value and experimental value at each point have the certain error in the same direction because only some influential collision effects have been considered in the MCC model of program. This phenomenon represents a certain numerical value deviation between the experi- mental curve and si order to make the simulation results to agree with ex- perimental results, we have prescribed the adjustment coefficients icxfactor and ecxfactor of the relative colli- sion cross section, and adjust their values to make theo- retical data to be consistent with experimental data com- and the result makes ionization frequency has a trend of growth. At this point, only low applied voltage is needed if we want to maintain gas discharge, therefore, Ub will decrease along with the increase of pd. However, when pd is very high, the electrons get smaller energy from electric field in each average free path, so the electronic energy decreases with the increase of pd value, and the probability of ionization reduces proportionally which leads to the rise of ignition voltage. Simultaneously, tal number of collision will increase in proportion along with the increase of pd, and the ignition voltage will have a downward trend. The roles of these two fac- tors neutralize each other and the ignition voltage in- crease little, so the characteristic curve goes up compara- tively smoothly. Thus it can be seen that the ignition voltage will rise no matter the value of pd is too high or too low, so there is a proper pd value which can make the ignition voltage at the minimum. Through simulation of the gas discharge process, we can see that using the gas discharge tube technology can produce plasma with certain density under hundreds of voltage. And it can substantially reduce the discharge voltage compared with the solution that uses the ioniza-  J. WANG 317 tion of air near the surface of air vehicle to produce plasma. This is an outstanding advantage of the mecha- nism of gas discharge tube. REFERENCES [1] R. J. Vidmar “Electromagnetic Wave Propagation in Unmagnetized Plasmas,” AD-A250710, 1992. [2] A. B. Petrin, “Nonlinear Interaction of Microwave and Vol.26, No.4, pp.150-158. doi:10.1109 /27.669617 Plane Magnetoactive Plasma Layer,” IEEE Transactions on Plasma Science, 1998, [3] J. L. Qiu, “Gazhong University of Science an Wuhan, 1999, pp. s, 1960, aseous Electronics,” Hu d Technology publisher, 81-90. [4] J. M. Dawson, Physics Review Letter pp.118-391. Copyright © 2013 SciRes. OPJ |