Optics and Photonics Journal, 2013, 3, 272-276
doi:10.4236/opj.2013.32B064 Published Online June 2013 (http://www.scirp.org/journal/opj)
Study of Raman Spectroscopy to detect the Underlying
Substance Concealed below Diffusely Scattering Medium
Xiaohua Zhang*, Ji Zhang, Haifeng Zhang, Jianxin Lu, Leijian Wang, Yongsheng Xu
China Institute of Atomic Energy, Beijing, China
Email: *xhciae@126.com
Received 2013
ABSTRACT
Measurement and comparison of NaNO3 powder concealed in opaque and semi-transparent plastic bottles are carried
out through conventional Raman spectroscopy and spatially offset Raman spectroscopy individually. The action
mechanism why the spatially offset Raman spectroscopy can effectively detect the medium concealed in the non-
transparent bottle is analyzed. The spatially offset Raman spectroscopy breaks through the detection neck of the con-
ventional Raman spectroscopy (the detection depth is small and cannot detect the ingredient of the subsurface under
non-transparent medium), and the measurement and identification of the substance concealed in the non-transparent
medium (opaque/semi-transparent plastic) bottle have been realized.
Keywords: Spatially Offset Raman Spectroscopy; Opaque/sub-transparent Plastic Bottle; Ingredient of the Subsurface;
Diffuse Scattering
1. Introduction
Raman spectroscopy is a measurement method based on
the inelastic scattering through interaction between light
and matter. It can test samples noncontactly and non-
destructively, and offers a substantially higher degree of
chemical specificity, so this technique is one of the re-
search focuses of analytical science. To conventional
Raman spectroscopy adopted generally, the sampling
depth is only limited in the area no more than several
hundred microns of depth [1], or subsurface in transpar-
ent medium. However, diffusely scattering surface layers
are frequently encountered in many medical and biologi-
cal applications, such as food products, colloids, poly-
mers, catalysts, powders in general, coating technology,
dermatology applications involving the detection of can-
cerous tissue, biochemical identification for medical
studies, and noninvasive authentication of pharmaceuti-
cal products. Such samples are often highly heterogene-
ous and can be made of various layers, each having a
different chemical make-up. The major goal for analyti-
cal science is to provide a method capable of determining
the chemical composition of subsurface layers in turbid
media in a non-destructive way, by which the sample can
be authenticated or the disease can be diagnosed. If the
conventional Raman spectroscopy is employed, the fluo-
rescence and Raman spectra of the target are collected
simultaneously, whereas the Raman spectrum of the sub-
surface is relatively very weak, and it is often interfered
seriously or even overwhelmed by the fluorescence and
Raman spectra from the surface layer, so it becomes ex-
tremely complicated or even impossible to separate the
spectrum of the surface and the one of the subsurface. In
the face of these emerging challenges, a new technique
based on Raman scattering, spatially offset Raman spec-
troscopy (SORS), which is capable of retrieving the sub-
surface concealed by opaque or sub- transparent diffusely
scattering medium, is discovered by the workers of
Rutherford Appleton laboratory [2]. And it has been used
in the fields such as researches and applications of au-
thentication of the packed pharmaceutical products [3-5],
disease diagnoses [6-8], anti-smuggling [9], airport
screening for explosives especial liquid ones [10-12], and
has gained extraordinary attention and approval from the
whole society.
In this paper, measurement and contrasting analysis
for NaNO3 powder concealed in opaque and sub-trans-
parent bottles have been carried out through conventional
Raman configuration and SORS configuration individu-
ally. And the action mechanism how the SORS can real-
ize the efficient detection of the media concealed in non-
transparent plastic bottles has been analyzed.
2. Thoery and Method
During Raman scattering, the incoming light passing
through the sample will be inelastically scattered from
the molecular vibration, which causes the energy (wave-
*Corresponding author.
Copyright © 2013 SciRes. OPJ
X. H. ZHANG ET AL. 273
length/ frequency) of the photons to be altered. In the
conventional mode, backscattering geometry is often
adopted whose focus of the collecting lens is strictly
overlapped with the illuminated spot. However, the
SORS is based on the collection of the Raman spectrum
emanating from spatially offset regions away from the
point of illumination Δs on the sample surface, see Fig-
ure 1, where the relative intensity ratio of Raman spec-
trum of the surface to the one of the subsurface varies
with the different offset distance. If the spectra data of
spatial offset distance Δs 0 and Δs = 0 are processed,
the pure Raman spectrum of the subsurface covered by
the opaque/sub-transparent medium will be retrieved.
3. Experiment
3.1. Experiment Apparatus
The setup diagram of the SORS of the experiment is
shown in Figure 2, the probe beam is generated by a tem-
perature stabilized 532 nm constant wave laser (MGL-
-532, Changchun New Industries), the output power of
which is 150mW with spectral line width is < 0.2 nm.
The illuminating laser light is incident on the sample at
~45o after it is focused by lens F1. Here, mirror M and the
sample are all placed on a 1D micro-positioning stage,
keeping the point of incidence on the sample fixed with
respect to the sample. In the configuration, a lens F2 with
20mm diameter and 50mm focal length is adopted for
spectra collecting and collimating, then the interaction
zone of laser and the sample is imaged onto the fiber
detector (a single fiber with 1mm diameter) with the ratio
of 1:1 by F3 with specifications as same as F2. The holo-
graphic notch filter centered at 532 nm (Kaiser Optical
Systems, Inc.) between F2 and F3 is the crucial element,
which can reduce the intensity of Rayleigh scattering by
three orders of magnitude, whereas the Raman scattering
light is of no attenuation. The spectra collected are
measured by the miniature spectrometer (BTC112E se-
ries) produced by B&W Tek Inc.
If the mirror S in Figure 2 is removed, then the setup
will be the conventional one, where the illuminating laser
is coupled into the Raman collecting system directly and
normally incident on the sample as Figrue 1(a).
3.2. Samples and Measurements
The samples used in the experiments are chemical re-
agent NaNO3 produced by Beijing Red Star Chemical
Factory, white plastic bottle(opaque) with thickness of
1mm and Olay oil moisture protection cream bottle (sub-
transparent hard plastic, thickness of about 6 mm), and
NaNO3 packed in the bottles aforementioned. The chemi-
cal reagent NaNO3 is fine powder ground by a pestle and
mortal, which is loosely packed in the bottles or piled on
a metal plate without any mechanical tapping.
Raman spectra of powder NaNO3, opaque and sub-
transparent plastic bottles, and bottles containing NaNO3
are measured by the conventional setup, and the spatially
offset ones with different offset distance of bottles con-
taining powder NaNO3 are then measured by the SORS
configuration in Figure 2.
4. Results and Discussion
Firstly, Raman spectra of powder NaNO3, opaque plastic
bottle with thickness of about 1mm, and the bottle con-
taining NaNO3 powder are individually measured by the
conventional setup, and the results are shown in Figure 3.
Figure 1. Schematic diagram for (a) backscattering Raman
spectroscopy and (b) spatially offset Raman spectroscopy.
Notch
F1
F2
F3
Sample
M
Laser
Spectrometer
S
Figure 2. Setup of spatially offset Raman spectroscopy.
Figure 3. Conventional Raman spectroscopy of NaNO3 pow-
der, white plastic bottle (thickness of ~1 mm), and the bottle
containing NaNO3: (a) NaNO3; (b) bottle containing NaNO3;
(c) empty bottle.
Copyright © 2013 SciRes. OPJ
X. H. ZHANG ET AL.
274
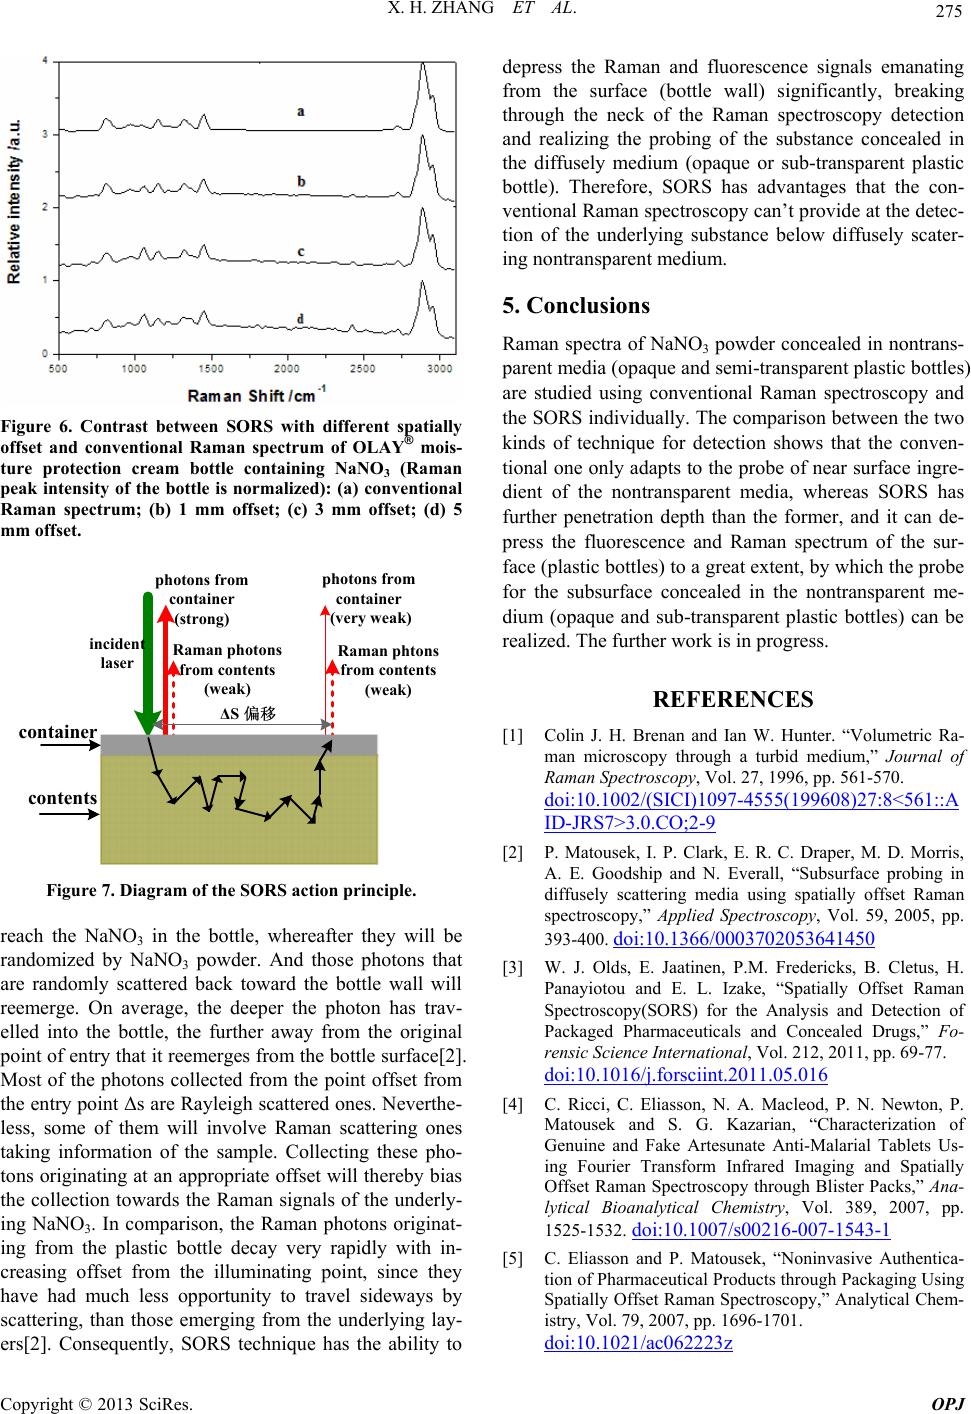
As shown in the figure, there is a sharp Raman peak of
the NO3
in the spectrum of NaNO3 piled on the metal
plate, however, the Raman spectrum of NaNO3 concealed
in the plastic bottle is remarkably similar to the one of
the empty bottle, without obviously peak near 1062cm-1
at all. All these results indicate that it is very efficient for
the conventional Raman spectroscopy to probe the near
surface ingredient, nevertheless, this approach is ham-
pered or fails when facing to the detection of the subsur-
face concealed in the opaque plastic bottle, because the
illumination and collection zones are coincided, the
fluorescence and Raman spectra generated from the bot-
tle are intense enough to ‘swamp’ the detector, thus de-
grading or precluding entirely, the detection of the rela-
tively much weaker Raman photons from the deep layer.
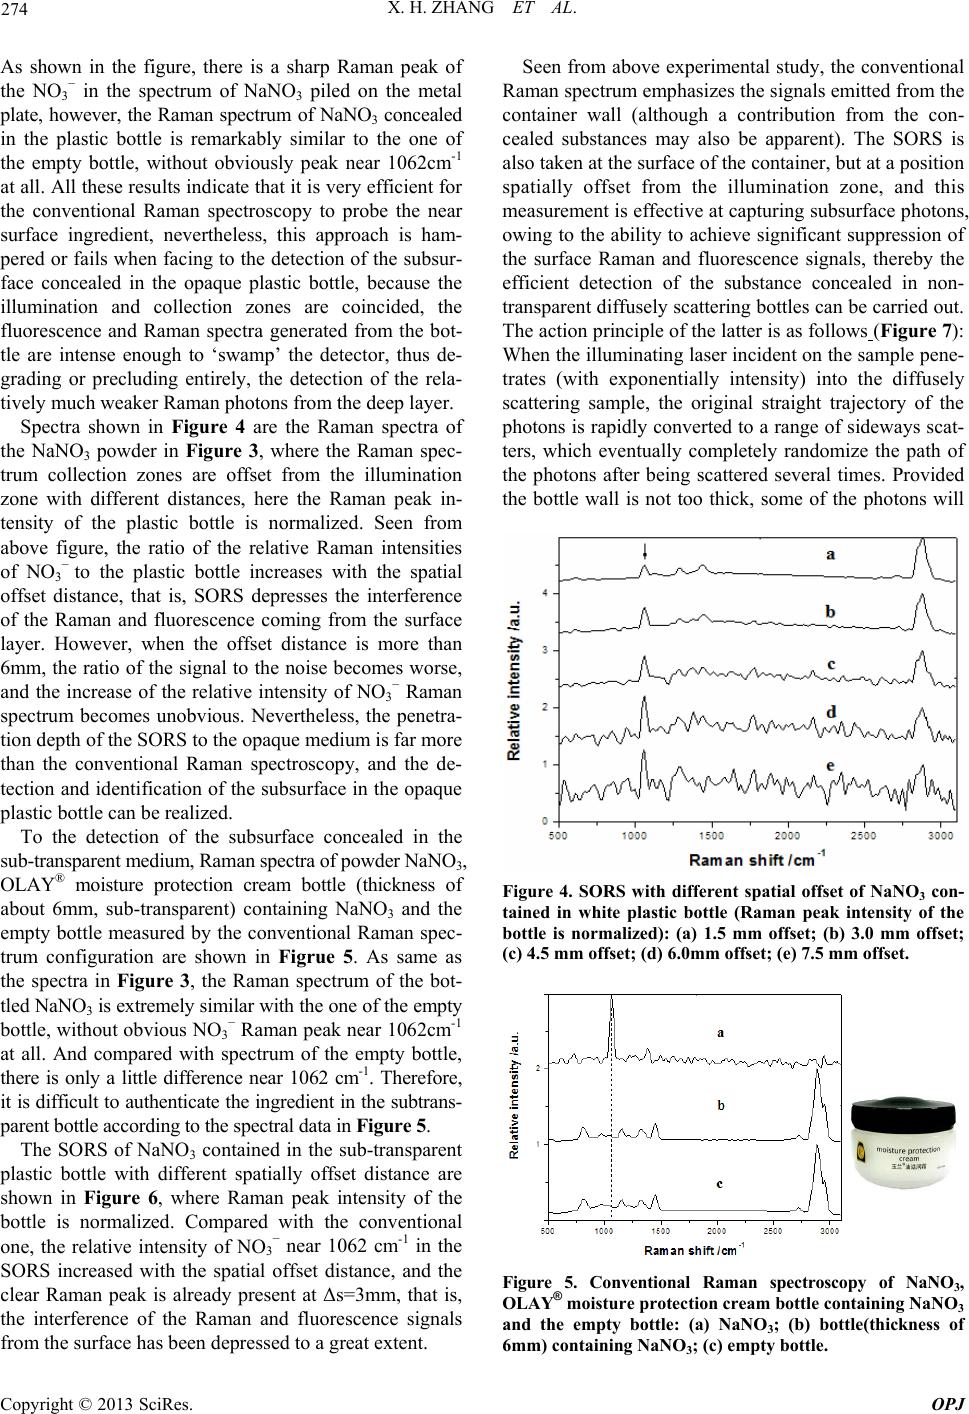
Spectra shown in Figure 4 are the Raman spectra of
the NaNO3 powder in Figure 3, where the Raman spec-
trum collection zones are offset from the illumination
zone with different distances, here the Raman peak in-
tensity of the plastic bottle is normalized. Seen from
above figure, the ratio of the relative Raman intensities
of NO3
to the plastic bottle increases with the spatial
offset distance, that is, SORS depresses the interference
of the Raman and fluorescence coming from the surface
layer. However, when the offset distance is more than
6mm, the ratio of the signal to the noise becomes worse,
and the increase of the relative intensity of NO3
Raman
spectrum becomes unobvious. Nevertheless, the penetra-
tion depth of the SORS to the opaque medium is far more
than the conventional Raman spectroscopy, and the de-
tection and identification of the subsurface in the opaque
plastic bottle can be realized.
To the detection of the subsurface concealed in the
sub-transparent medium, Raman spectra of powder NaNO3,
OLAY® moisture protection cream bottle (thickness of
about 6mm, sub-transparent) containing NaNO3 and the
empty bottle measured by the conventional Raman spec-
trum configuration are shown in Figrue 5. As same as
the spectra in Figure 3, the Raman spectrum of the bot-
tled NaNO3 is extremely similar with the one of the empty
bottle, without obvious NO3
Raman peak near 1062cm-1
at all. And compared with spectrum of the empty bottle,
there is only a little difference near 1062 cm-1. Therefore,
it is difficult to authenticate the ingredient in the subtrans-
parent bottle according to the spectral data in Figure 5.
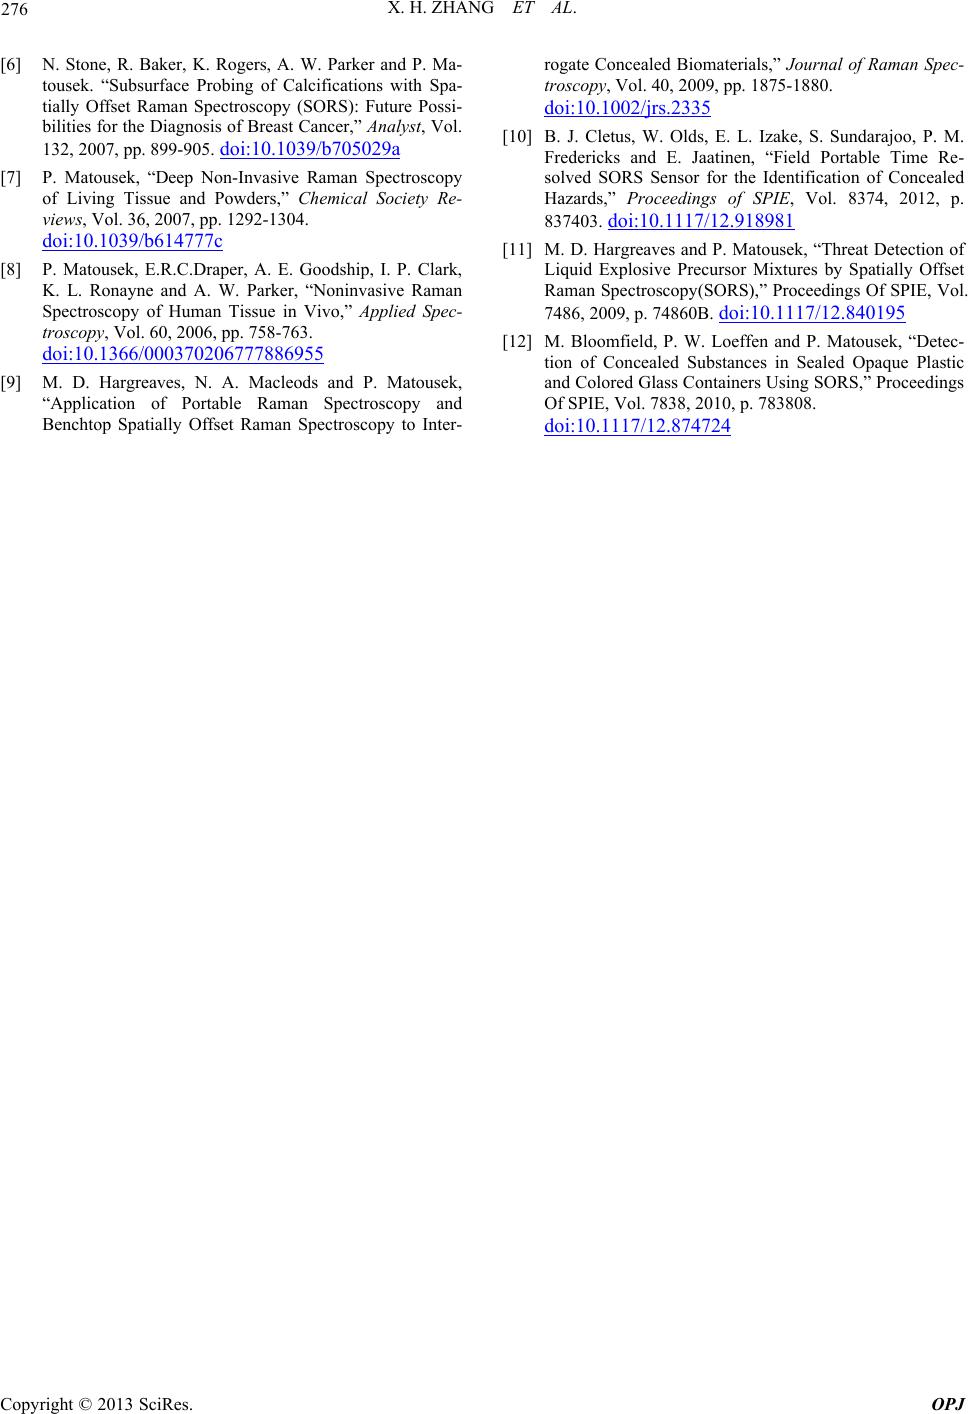
The SORS of NaNO3 contained in the sub-transparent
plastic bottle with different spatially offset distance are
shown in Figure 6, where Raman peak intensity of the
bottle is normalized. Compared with the conventional
one, the relative intensity of NO3
near 1062 cm-1 in the
SORS increased with the spatial offset distance, and the
clear Raman peak is already present at Δs=3mm, that is,
the interference of the Raman and fluorescence signals
from the surface has been depressed to a great extent.
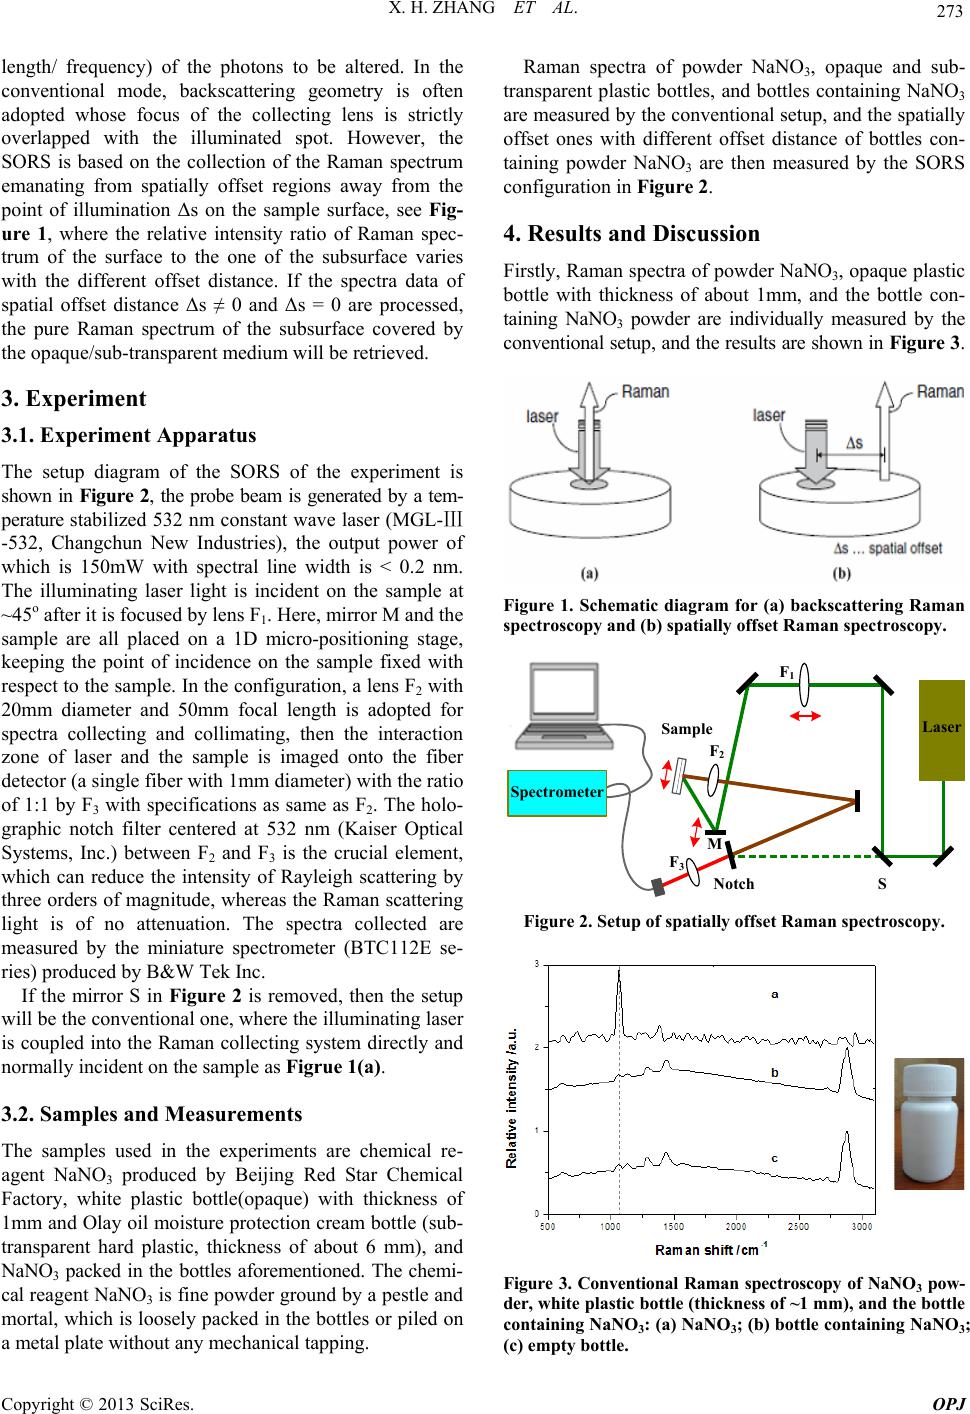
Seen from above experimental study, the conventional
Raman spectrum emphasizes the signals emitted from the
container wall (although a contribution from the con-
cealed substances may also be apparent). The SORS is
also taken at the surface of the container, but at a position
spatially offset from the illumination zone, and this
measurement is effective at capturing subsurface photons,
owing to the ability to achieve significant suppression of
the surface Raman and fluorescence signals, thereby the
efficient detection of the substance concealed in non-
transparent diffusely scattering bottles can be carried out.
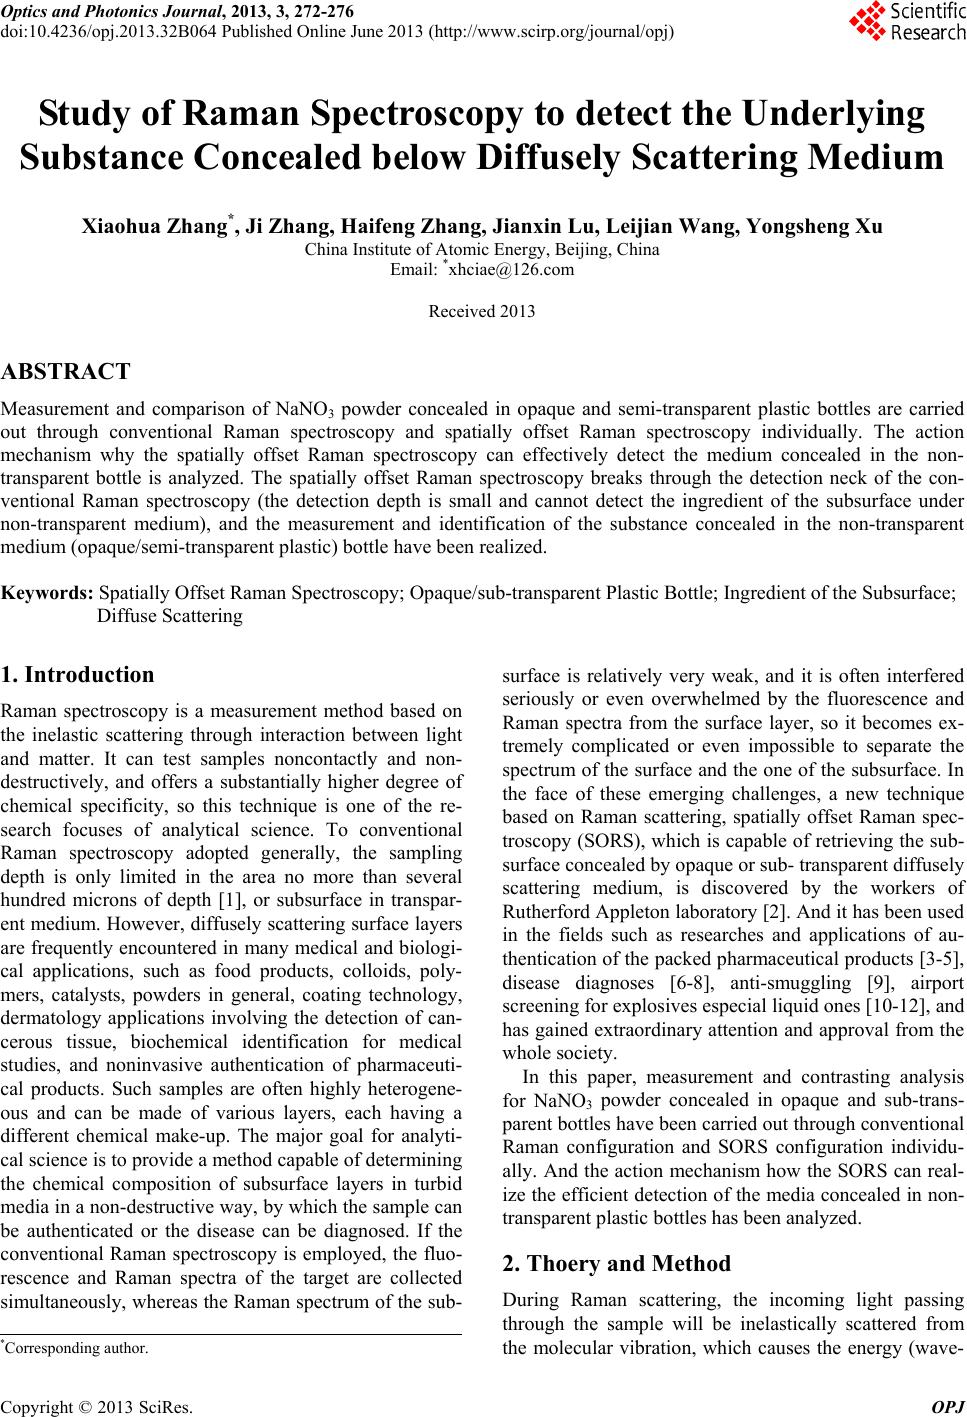
The action principle of the latter is as follows (Figure 7):
When the illuminating laser incident on the sample pene-
trates (with exponentially intensity) into the diffusely
scattering sample, the original straight trajectory of the
photons is rapidly converted to a range of sideways scat-
ters, which eventually completely randomize the path of
the photons after being scattered several times. Provided
the bottle wall is not too thick, some of the photons will
Figure 4. SORS with different spatial offset of NaNO3 con-
tained in white plastic bottle (Raman peak intensity of the
bottle is normalized): (a) 1.5 mm offset; (b) 3.0 mm offset;
(c) 4.5 mm offset; (d) 6.0mm offset; (e) 7.5 mm offset.
Figure 5. Conventional Raman spectroscopy of NaNO3,
OLAY® moisture protection cream bottle containing NaNO3
and the empty bottle: (a) NaNO3; (b) bottle(thickness of
6mm) containing NaNO3; (c) empty bottle.
Copyright © 2013 SciRes. OPJ
X. H. ZHANG ET AL. 275
Figure 6. Contrast between SORS with different spatially
offset and conventional Raman spectrum of OLAY® mois-
ture protection cream bottle containing NaNO3 (Raman
peak intensity of the bottle is normalized): (a) conventional
Raman spectrum; (b) 1 mm offset; (c) 3 mm offset; (d) 5
mm offset.
ΔS
contents
container
photons from
container
(strong)
Raman photons
from contents
(weak)
Raman phtons
from contents
(weak)
photons from
container
(very weak)
incident
laser
Figure 7. Diagram of the SORS action principle.
reach the NaNO3 in the bottle, whereafter they will be
randomized by NaNO3 powder. And those photons that
are randomly scattered back toward the bottle wall will
reemerge. On average, the deeper the photon has trav-
elled into the bottle, the further away from the original
point of entry that it reemerges from the bottle surface[2].
Most of the photons collected from the point offset from
the entry point Δs are Rayleigh scattered ones. Neverthe-
less, some of them will involve Raman scattering ones
taking information of the sample. Collecting these pho-
tons originating at an appropriate offset will thereby bias
the collection towards the Raman signals of the underly-
ing NaNO3. In comparison, the Raman photons originat-
ing from the plastic bottle decay very rapidly with in-
creasing offset from the illuminating point, since they
have had much less opportunity to travel sideways by
scattering, than those emerging from the underlying lay-
ers[2]. Consequently, SORS technique has the ability to
depress the Raman and fluorescence signals emanating
from the surface (bottle wall) significantly, breaking
through the neck of the Raman spectroscopy detection
and realizing the probing of the substance concealed in
the diffusely medium (opaque or sub-transparent plastic
bottle). Therefore, SORS has advantages that the con-
ventional Raman spectroscopy can’t provide at the detec-
tion of the underlying substance below diffusely scater-
ing nontransparent medium.
5. Conclusions
Raman spectra of NaNO3 powder concealed in nontrans-
parent media (opaque and semi-transparent plastic bottles)
are studied using conventional Raman spectroscopy and
the SORS individually. The comparison between the two
kinds of technique for detection shows that the conven-
tional one only adapts to the probe of near surface ingre-
dient of the nontransparent media, whereas SORS has
further penetration depth than the former, and it can de-
press the fluorescence and Raman spectrum of the sur-
face (plastic bottles) to a great extent, by which the probe
for the subsurface concealed in the nontransparent me-
dium (opaque and sub-transparent plastic bottles) can be
realized. The further work is in progress.
REFERENCES
[1] Colin J. H. Brenan and Ian W. Hunter. “Volumetric Ra-
man microscopy through a turbid medium,” Journal of
Raman Spectroscopy, Vol. 27, 1996, pp. 561-570.
doi:10.1002 /(SI CI)10 97- 455 5(199 608 )2 7 :8<561 ::A
ID-JRS7>3.0.CO;2-9
[2] P. Matousek, I. P. Clark, E. R. C. Draper, M. D. Morris,
A. E. Goodship and N. Everall, “Subsurface probing in
diffusely scattering media using spatially offset Raman
spectroscopy,” Applied Spectroscopy, Vol. 59, 2005, pp.
393-400. doi:10.1366/00037020536414 50
[3] W. J. Olds, E. Jaatinen, P.M. Fredericks, B. Cletus, H.
Panayiotou and E. L. Izake, “Spatially Offset Raman
Spectroscopy(SORS) for the Analysis and Detection of
Packaged Pharmaceuticals and Concealed Drugs,” Fo-
rensic Science International, Vol. 212, 2011, pp. 69-77.
doi:10.1016/j.fo rsciin t.2011 .05.0 16
[4] C. Ricci, C. Eliasson, N. A. Macleod, P. N. Newton, P.
Matousek and S. G. Kazarian, “Characterization of
Genuine and Fake Artesunate Anti-Malarial Tablets Us-
ing Fourier Transform Infrared Imaging and Spatially
Offset Raman Spectroscopy through Blister Packs,” Ana-
lytical Bioanalytical Chemistry, Vol. 389, 2007, pp.
1525-1532. doi:10.1007 /s00 216-00 7- 154 3-1
[5] C. Eliasson and P. Matousek, “Noninvasive Authentica-
tion of Pharmaceutical Products through Packaging Using
Spatially Offset Raman Spectroscopy,” Analytical Chem-
istry, Vol. 79, 2007, pp. 1696-1701.
doi:10.1021 /ac0 622 23 z
Copyright © 2013 SciRes. OPJ
X. H. ZHANG ET AL.
Copyright © 2013 SciRes. OPJ
276
[6] N. Stone, R. Baker, K. Rogers, A. W. Parker and P. Ma-
tousek. “Subsurface Probing of Calcifications with Spa-
tially Offset Raman Spectroscopy (SORS): Future Possi-
bilities for the Diagnosis of Breast Cancer,” Analyst, Vol.
132, 2007, pp. 899-905. doi:10.1039/b705029a
[7] P. Matousek, “Deep Non-Invasive Raman Spectroscopy
of Living Tissue and Powders,” Chemical Society Re-
views, Vol. 36, 2007, pp. 1292-1304.
doi:10.1039 /b61 477 7c
[8] P. Matousek, E.R.C.Draper, A. E. Goodship, I. P. Clark,
K. L. Ronayne and A. W. Parker, “Noninvasive Raman
Spectroscopy of Human Tissue in Vivo,” Applied Spec-
troscopy, Vol. 60, 2006, pp. 758-763.
doi:10.1366 /000 370 206777 886 955
[9] M. D. Hargreaves, N. A. Macleods and P. Matousek,
“Application of Portable Raman Spectroscopy and
Benchtop Spatially Offset Raman Spectroscopy to Inter-
rogate Concealed Biomaterials,” Journal of Raman Spec-
troscopy, Vol. 40, 2009, pp. 1875-1880.
doi:10.1002 /jr s.2335
[10] B. J. Cletus, W. Olds, E. L. Izake, S. Sundarajoo, P. M.
Fredericks and E. Jaatinen, “Field Portable Time Re-
solved SORS Sensor for the Identification of Concealed
Hazards,” Proceedings of SPIE, Vol. 8374, 2012, p.
837403. doi:10.1117/12.918981
[11] M. D. Hargreaves and P. Matousek, “Threat Detection of
Liquid Explosive Precursor Mixtures by Spatially Offset
Raman Spectroscopy(SORS),” Proceedings Of SPIE, Vol.
7486, 2009, p. 74860B. doi:10.1117/12.840195
[12] M. Bloomfield, P. W. Loeffen and P. Matousek, “Detec-
tion of Concealed Substances in Sealed Opaque Plastic
and Colored Glass Containers Using SORS,” Proceedings
Of SPIE, Vol. 7838, 2010, p. 783808.
doi:10.1117 /12.87 4724