 Open Journal of Genetics, 2013, 3, 14-26 OJGen http://dx.doi.org/10.4236/ojgen.2013.32A3003 Published Online August 2013 (http://www.scirp.org/journal/ojgen/) Anxiety and pre-symptomatic testing for neurodegenerative disorders Lêdo Susana1,2,3*, Leite Ângela1,4,5, Jorge Sequeiros1,2 1Centre for Predictive and Preventive Genetics (CGPP), IBMC—Institute for Molecular and Cell Biology, Porto, Portugal 2ICBAS, Universidade do Porto, Porto, Portugal 3ISCS-Norte (CESPU), Porto, Portugal 4ISCET—Instituto Superior de Ciências Empresariais e do Turismo, Porto, Portugal 5ULP—Universidade Lusófona do Porto, Porto, Portugal Email: *susanaledo@gmail.com Received 17 May 2013; revised 2 June 2013; accepted 10 July 2013 Copyright © 2013 Lêdo Susana et al. This is an open access article distributed under the Creative Commons Attribution License, which permits unrestricted use, distribution, and reproduction in any medium, provided the original work is properly cited. ABSTRACT In this retrospective study we have investigated the anxiety as an impact of pre-symptomatic testing (PST) for 3 autosomal dominant late-onset diseases: Hunt- ington disease (HD), Machado-Joseph disease (MJD) and familial amyloidotic po lyneuropathy (FAP) V 3 0M TTR. The study included 686 subjects: 586 (85.4%) were the offspring at risk for FAP, 92 (13.4%) for HD and 8 (1.2%) to MJD. Of these, 352 received the car- rier result and 305 the non-carrier result. As indica- tor of anxiety distress was taken the Self-Rating An- xiety Scale of Zung (SAS), applied in the pre-test and the three post-test moments: three weeks, 6 months and one year after notification of test results. Values decreased significantly along the four evaluation mo- ments, regardless the studied disease or test result. For female population, SAS means cores revealed results of clinical anxiety at pre-test, only decreasing to non clinical scores a year after PST disclosure. Keywords: Anxiety; Subscales; SAS; Psychological Impact; FAP; HD; MJD 1. INTRODUCTION There are numerous diagnostic or pre-symptomatic tests (PST) for hereditary diseases [1-3] Machado-Joseph dis- ease (MJD) or amyloidotic polyneuropathy (FAP) TTR V30M, all late onset autosomal dominant diseases, the PST can predict if, in future more or less distant, the per- son will develop the symptoms of the disease [2,4]. It’s in this field of monogenic autosomal dominant late onset diseases, that the Center for Predictive and Preven- tive Genetics (CGPP) at Institute for Molecular and Cell Biology (IBMC), Oporto University, provides a multid- isciplinary approach for HD, PAF and MJD PST. A Predictive protocol for neurodegenerative diseases implemented in CGPP is a national reference model for genetic counseling and psychosocial support for people at risk of suffering such progressive and debilitating dis- eases without effective treatment and cure until the pre- sent days [2]. The Studied Diseases HD, MJD and FAP are three examples of monogenic au- tosomal dominant of late onset, clinically considered as neurodegenerative diseases, incurable and highly debili- tating and that may take a broad spectrum of symptoma- tic manifestations. Huntington’s disease [5,6] is the most studied, largely due to the discovery by Guselli and colleagues, of its ge- netic marker since 1983 [7]. Thus, the predictive test for Huntington’s disease began to be held in Canada in 1986 and US [1,8], with over the 90’s progress and the new laboratory techniques for mutation detection [5,6]. MJD and FAP are very specific Portuguese diseases, that also have a severe neurodegenerative pathway, and for which there is still no effective treatment or cure. In 1993, the MJD gene was finally located on chromosome 14 by a group of researchers led by Shoji Tsuji, later con- firmed in the Portuguese households by Sequeiros and colleagues [9]. The genetic mutation present in FAP leads to the production of an amyloid protein, immunologi- cally related to transthyretin (TTR) that is abnormally de- graded, precipitated and stored in tissues as amyloid sub- stance [10], deposited in the tissues of various organs leading these patients for a progressive limitation [11,12]. *Corresponding author. OPEN ACCESS  L. Susana et al. / Open Journal of Genetics 3 (2013) 14-26 15 Pre-symptomatic diagnosis is available since 1984 [11]. Several psychosocial studies have been done with fami- lies and their descendants at risk for neurodegenerative diseases diagnosed in CGPP [13-15]. Lêdo [13] studied FAP carriers after a year of knowl- edge of their genetic status, and concluded there had been no presence of emotional distress and feelings of hopelessness. Other studies with subjects at risk for FAP, HD and MJD pointed to the existence of psychological well-be- ing and better health perception than the control subjects [14]. Also in this field, there have been published psy- chosocial genetic studies related to the experience of more than 10 years in the counseling of individuals at risk [16], as well as studies about the importance of con- tact time with the disease or affected father figure in the psychological impact of PST [15]. Despite the different approaches that have been made, there are still issues to be elucidated regarding the impact of the application of PST to diseases with common start- ing symptoms at the early adulthood and a degenerative path, but with different treatment options and clinical outcomes (e.g. the psychiatric disorders, unique to Hunt- ington’s disease, and for MJD frequent signs of cerebel- lar ataxia, progressive external ophthalmoplegia and py- ramidal signs [9,17,18]. On the other hand, it continues to be relevant studies related to psychological impact of test results, mainly the anxiety indexes because this is one of the most expressed feelings at the first evaluation. In this sense, we estab- lished as objectives of this research: 1) the anxiety in- dexes observed before and after completion of the PST, and 2) the differences on anxiety indexes related to types of disease, carrier or non carrier status, and some demo- graphic variables. 2. MATERIAL AND METHODS It was designed a retrospective study of clinical files of subjects who underwent pre-symptomatic testing for ge- netic autosomal dominant diseases with late onset (MJD, HD and FAP), in CGPP, between 2000 and 2010. These files contained psychological evaluations data conducted along the four moments of the general psychological evaluation protocol: 1) 1st moment, pre-test, prior to the genetic test; 2) 2nd moment of evaluation, three weeks af- ter receiving the test result and knowing genetic status; 3) 3rd moment, six months after disclosure; 4) 4th moment, one year after disclosure. 2.1. Subjects The initial sample (Table 1) is constituted by 686 sub- jects at base line: 586 (85.4%) attended the service to ac- complish the pre-symptomatic test for FAP, 92 (13.4%) for HD and 8 (1.2%) for MJD. Subjects underwent the evaluation protocol voluntarily when they were informed they were 50% at-risk for these diseases and were in- formed about the purpose of the research, simultaneously with PST protocol procedure and signed a written con- sent for the use of their data with the finality of scientific research. 58.6% of the complete sample were women. It was found that 51.3% of the subjects were single, 44.7% were married. Of the total initial subjects, 29 did not ap- pear to know their test result, 352 (51.6%) received the result of carriers and 305 (44.7%) received the result of non-carriers. Along the four moment of the general pro- tocol, subjects were given up. This is why we witnessed a sharp decline in the subject number at the post-test one year later. Men and women have proven to be equivalent in their distribution regarding the age (X2 = 636.939; df = 625; p Table 1. Sample characteristics along the four moments of the general psychological evaluation protocol. Pre-test a (N = 686) Post-test b (N = 290) Post-test c (N = 143) Post-test d (N = 54) FAP HD MJD FAP HD MJD FAP HD MJD FAP HD MJD N 586 92 8 248 38 4 114 25 4 40 13 1 Gender F 340 M 246 F 54 M 38 F 8 M 0 F 146 M 102 F 20 M 18 F 4 M 0 F 64 M 50 F 14 M 11 F 4 M 0 F 25 M 15 F 7 M 6 F 1 M 0 Mean Age 35.09 43.69 38.75 34.83 46.45 48.00 34.68 45.24 48.00 31.85 45.46 37.00 Marital Status S 320 M 239 D 10 W 8 S 27 M 59 D 0 W 0 S 2 M 6 D 0 W 0 S 134 M 104 D 3 W 3 S 13 M 23 D 1 W 1 S 1 M 3 D 0 W 0 S 59 M 52 D 0 W 1 S 9 M 14 D 1 W 1 S 1 M 3 D 0 W 0 S 22 M 17 D 0 W 0 S 2 M 11 D 0 W 0 S 0 M 1 D 0 W 0 Test Result NC 311 C 254 DK 17 NC 39 C 45 DK 8 NC 2 C 6 DK 0 NC 124 C 117 DK 5 NC 16 C 21 DK 1 NC 0 C 4 DK 0 NC 47 C 62 DK 3 NC 5 C 19 DK 1 NC 0 C 4 DK 0 NC 10 C 29 DK 0 NC 2 C 9 DK 2 NC 0 C 1 DK 0 Gender (Female; Male); Marital Status (Single; Married; Divorced; Widow); Test Result (Non Carrier; Carrier; Don’t know). Copyright © 2013 SciRes. OPEN ACCESS  L. Susana et al. / Open Journal of Genetics 3 (2013) 14-26 16 = 0.362), marital status (X2 = 5.733; df = 2; p = 0.057), and test result (X2 = 2.446; df = 2; p = 0.294). 2.2. Procedure The PST protocol queries for neurodegenerative diseases in CGPP have been published elsewhere [2]. In the context of the protocol, each subject answered the anxiety scale evaluation along four stages: 1) pre-test: the first psychological evaluation, it was done the survey and evaluation of the motivations that led the person to pre-symptomatic test, exploring his/her own decision making processes and detection of emotional states that might jeopardize a good adjustment to the predictive test result (hereafter designated 1st moment); 2) post-test: three weeks after receiving the test result post-test (here- after designated 2nd moment); 3) six months after disclo- sure (hereafter designated 3rd moment); 4) one year after reporting the genetic test result (hereafter designated 4th moment). The socio-demographic variables (gender, age and ma- rital status) and medical history were collected at the first psychological evaluation. The anxiety variable was collected by the application of the Portuguese version [19] of the Self-Rating Anxiety Scale of Zung (SAS) [20]. This scale is composed of 20 items rated on a Likert scale of four grades (1 “rarely or never” to 4 “most or all of the time”) and measure the anxiety clinical symptoms. Anxiety is evaluated from the description of its most common symptoms and signals through four anxiety components (subscales): cognitive (items 1 - 3, 4 and 5) which can reach a maximum of 20 points, motor (items 6, 7, 8 and 9) which can reach a maximum of 16, vegetative (items 10 - 16, 17 and 18) that can reach a maximum of 36 and central nervous system—CNS—(items 19 and 20) with a maximum value of 8 points. The score ranges be- tween 20 and 80 and the cut point is 40 [19]. 2.3. Data Analysis The statistical analysis was performed with the software PASW Statistics 19.0 [21]. We carry out procedures re- lated to descriptive statistics (frequencies, mean, stan- dard deviation, minimum, maximum), bi-variate statis- tics (mean, ANOVA, correlation bi-varied); prediction of numerical results (multiple linear regression, stepwise) predicting for the identification of groups (factor analysis and discriminant analysis). 3. RESULTS 3.1. Descriptive Analysis for the Four Evaluation Moments We analyzed the mean and standard deviation of the re- sults obtained from the application of SAS in the four moments considered, for the total sample and for female and male subsamples. Reading Table 2, it can be seen that, along the four moments, women had always higher averages than men. For both genders, 1st moment revealed higher mean val- ues (male: M = 39.6, SD = 8.07; female: M = 43.7, SP = 8.87), however, in women, there is a slight increase in average from the second to the third moment of data col- lection. 3.2. Descriptive Statistics of the 20 SAS Items for the Four Stages of Evaluation We proceeded to the descriptive analysis for the 20 items of the scale (mean, standard deviation and percentage of symptomatic responses, i.e., those scored with 2, 3 or 4 points) for the total sample and male and female sub- samples, for four moment’s evaluation. We can see that, at first assessment (Table 3), i.e., before genetic testing (1st moment), women, in general, have significantly higher averages in some of the items that described anxiety symptoms, for example, restlessness and fear, headaches, neck and back pain and stomachache, or more night- mares. At post-test, three weeks after the communication of the PST result (2nd moment), it was found, with statis- tically significant results, that women continued to show a greater tendency to feel more nervous and anxious than men and have higher sleep disturbance (Table 4). Regarding Table 5, six months after knowing test re- sult (3rd moment), women fell more scared for no reason and have hands dry and warm more often than men; fur- thermore, men fell that things will be all right more than women. Reading Table 6, at 4th moment, there are no statisti- cally significant differences between female and male subsamples. 3.3. Comparison of the Total Means along the Four Evaluation Moments We found that the for the total anxiety average decreased over the four moments. In almost all moments compared, except between the 1st and the 3rd moments, and the 2nd and 3rd moments, the mean values obtained from the ap- plication of SAS decreased significantly with a p value less than 0.05 (see Table 7). 3.4. Comparison of the SAS Subscales Means along the Four Evaluation Moments We observed a decrease in all SAS subscales over the four moments of our evaluation as we can see from the reading Tables 8-11. In Table 8, we found statistically significant differ- ences between 1st and 2nd moments, 1st and 3rd moments, Copyright © 2013 SciRes. OPEN ACCESS  L. Susana et al. / Open Journal of Genetics 3 (2013) 14-26 17 and 2nd and 3rd moments regarding motor anxiety sub- scale. In Table 9, we found statistically significant differ- ences between 1st and 2nd moments, and 1st and 4th mo- ments regarding cognitive anxiety subscale. In Table 10, we found statistically significant differ- ences between 1st and 2nd moments, 1st and 4th moments, and 3rd and 4th moments regarding vegetative anxiety subscale. In Table 11, we found statistically significant differ- ences between 1st and 3rd moments, and 1st and 4th mo- ments regarding CNS anxiety subscale. Tab le 2. Total SAS results (mean, standard deviation) for the four moments evaluated (1st, 2nd, 3rd, 4th), for the total sample and fe- male and male subsamples. Total Sample Female Male M SD M SD M SD SAS 41.9 8.75 43.7 8.87 39.6 8.07 1st moment (n = 653; α = 0.80) (n = 378; α = 0.79) (n = 275; α = 0.78) SAS 40.2 8.21 41.4 8.45 38.6 7.61 2nd moment (n = 232; α = 0.82) (n = 135; α = 0.82) (n = 97; α = 0.79) SAS 41.0 9.87 43.0 10.10 38.4 9.05 3rd moment (n = 85; α = 0.83) (n = 48; α = 0.82) (n = 37; α = 0.85) SAS 36.7 8.10 37.2 7.40 35.8 9.02 4th moment (n = 62; α = 0.83) (n = 35; α = 0.79) (n = 27; α = 0.87) Ta b l e 3 . Results of the items of the SAS 1st moment (mean, standard deviation, and percentage of symptomatic responses) for the total sample and female and male subsamples. Total Sample Female Male Item M SD % M SD % M SD % 1—I feel more nervous and anxious than usual.** 1.86 0.82 62.6 1.960.80 70.4 1.72 0.8351.4 2—I feel afraid for no reason.* 1.39 0.65 31.1 1.440.66 35.9 1.32 0.6324.4 3—I get upset easily or feel panicky. 1.220.5317.71.240.55 19.0 1.20 0.5015.2 4—I feel like I'm falling apart and going to pieces. 1.400.6631.31.430.66 34.8 1.35 0.65 26.4 5—I feel that everything is all right and nothing bad will happen.** 2.58 0.95 85.6 2.670.93 88.0 2.46 0.9782.0 6—My arms and legs shake and tremble.* 1.42 0.62 35.9 1.470.62 40.4 1.35 0.6129.7 7—I am bothered by headaches neck and back pain.** 1.70 0.77 54.1 1.80 0.79 60.6 1.56 0.71 45.2 8—I feel weak and get tired easily.* 1.44 0.67 34.6 1.490.72 37.1 1.36 0.5931.1 9—I feel calm and can sit still easily.** 2.41 1.04 76.7 2.511.02 81.2 2.26 1.0470.6 10—I can feel my heart beating fast. 1.420.62357 1.450.63 38.2 1.37 0.6032.2 11—I am bothered by dizzy spells. 1.250.5221.11.270.53 23.9 1.21 0.5217.2 12—I have fainting spells or feel like it. 1.080.327.2 1.100.36 8.9 1.06 0.265.0 13—I can breathe in and out easily.** 1.70 1.02 38.5 1.791.05 42.7 1.57 0.9531.8 14—I get feelings of numbness and tingling in my fingers & toes. 1.360.6429.31.390.67 30.6 1.33 0.5827.5 15—I am bothered by stomach aches or indigestion.** 1.43 0.70 33.6 1.500.75 38.7 1.33 0.6126.8 16—I have to empty my bladder often. 1.75 0.78 56.6 1.780.81 57.9 1.70 0.7554.6 17—My hands are usually dry and warm. 2.81 1.09 83.4 2.871.08 85.1 2.74 1.1081.1 18—My face gets hot and blushes.** 1.95 0.86 66.8 2.080.91 71.5 1.77 0.7660.2 19—I fall asleep easily and get a good night’s rest.** 1.98 1.0555.5 2.07 1.07 58.9 1.85 1.00 50.7 20—I have nightmares.** 1.39 0.66 31.6 1.460.70 36.4 1.30 0.5824.9 Note: *Differences between men and women to p < 0.05; **Differences between men and women to p < 0.01. Copyright © 2013 SciRes. OPEN ACCESS 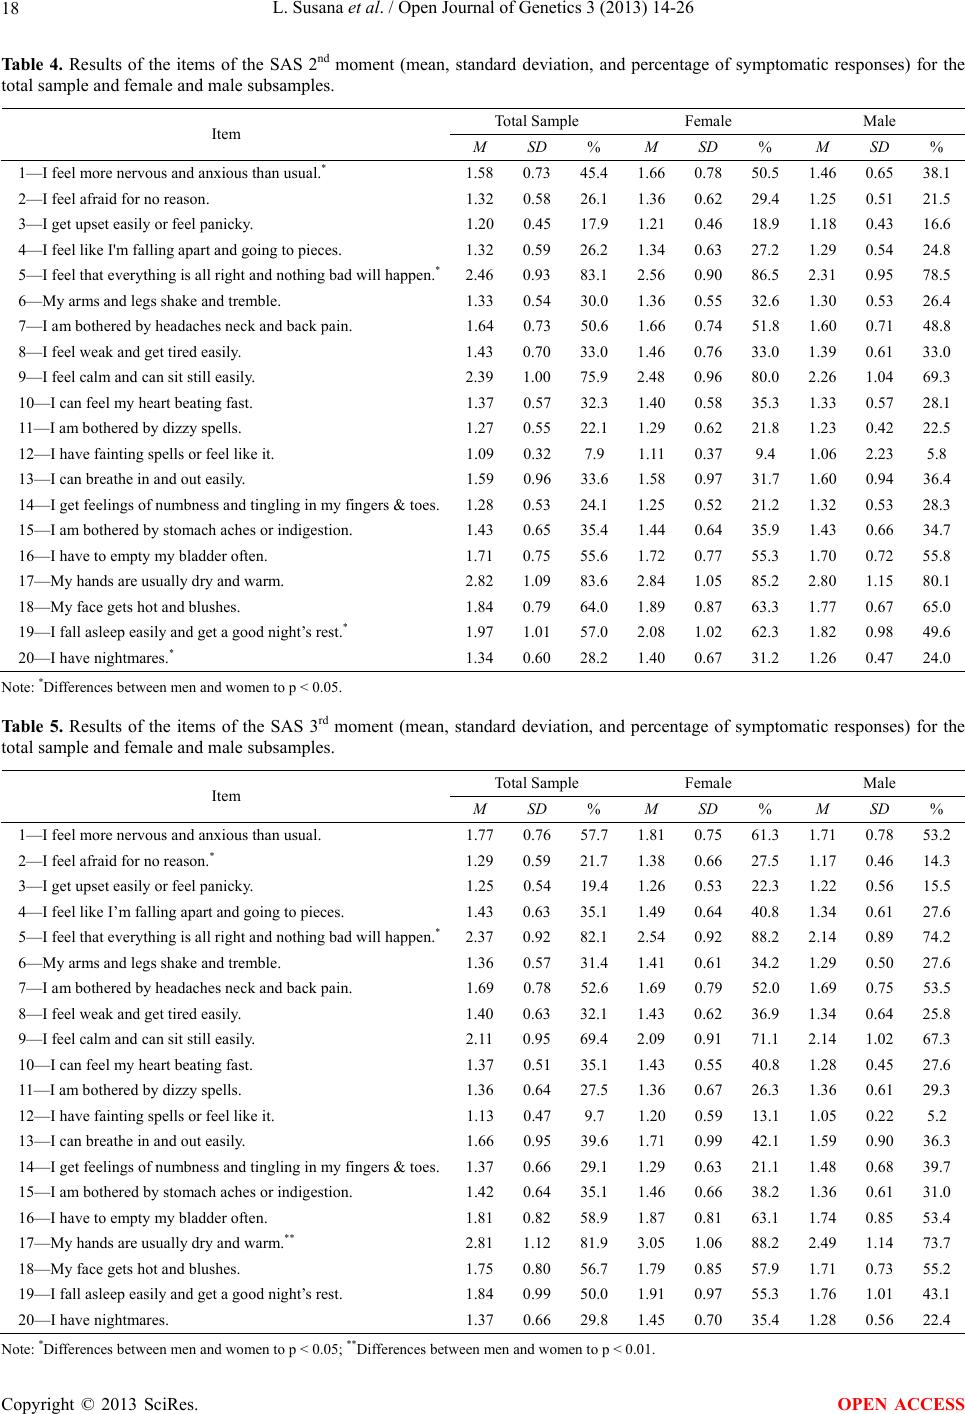 L. Susana et al. / Open Journal of Genetics 3 (2013) 14-26 18 Tab l e 4 . Results of the items of the SAS 2nd moment (mean, standard deviation, and percentage of symptomatic responses) for the total sample and female and male subsamples. Total Sample Female Male Item M SD % M SD % M SD % 1—I feel more nervous and anxious than usual.* 1.580.7345.41.660.7850.5 1.46 0.6538.1 2—I feel afraid for no reason. 1.320.5826.11.360.6229.4 1.25 0.5121.5 3—I get upset easily or feel panicky. 1.200.4517.91.210.4618.9 1.18 0.4316.6 4—I feel like I'm falling apart and going to pieces. 1.320.5926.21.340.63 27.2 1.29 0.54 24.8 5—I feel that everything is all right and nothing bad will happen.*2.46 0.93 83.1 2.56 0.90 86.5 2.31 0.95 78.5 6—My arms and legs shake and tremble. 1.330.5430.01.360.5532.6 1.30 0.5326.4 7—I am bothered by headaches neck and back pain. 1.640.7350.61.660.7451.8 1.60 0.7148.8 8—I feel weak and get tired easily. 1.43 0.70 33.0 1.46 0.76 33.0 1.39 0.61 33.0 9—I feel calm and can sit still easily. 2.39 1.00 75.9 2.48 0.96 80.0 2.26 1.04 69.3 10—I can feel my heart beating fast. 1.370.5732.31.400.5835.3 1.33 0.5728.1 11—I am bothered by dizzy spells. 1.270.5522.11.290.6221.8 1.23 0.4222.5 12—I have fainting spells or feel like it. 1.090.327.9 1.110.379.4 1.06 2.235.8 13—I can breathe in and out easily. 1.590.9633.61.580.9731.7 1.60 0.9436.4 14—I get feelings of numbness and tingling in my fingers & toes.1.280.5324.11.250.5221.2 1.32 0.5328.3 15—I am bothered by stomach aches or indigestion. 1.430.6535.41.440.6435.9 1.43 0.6634.7 16—I have to empty my bladder often. 1.710.7555.61.720.7755.3 1.70 0.7255.8 17—My hands are usually dry and warm. 2.82 1.09 83.6 2.84 1.05 85.2 2.80 1.15 80.1 18—My face gets hot and blushes. 1.84 0.79 64.01.890.87 63.3 1.77 0.67 65.0 19—I fall asleep easily and get a good night’s rest.* 1.971.0157.02.081.0262.3 1.82 0.9849.6 20—I have nightmares.* 1.340.6028.21.400.6731.2 1.26 0.4724.0 Note: *Differences between men and women to p < 0.05. Ta b le 5 . Results of the items of the SAS 3rd moment (mean, standard deviation, and percentage of symptomatic responses) for the total sample and female and male subsamples. Total Sample Female Male Item M SD % M SD % M SD % 1—I feel more nervous and anxious than usual. 1.770.7657.71.810.7561.3 1.71 0.7853.2 2—I feel afraid for no reason.* 1.290.5921.71.380.6627.5 1.17 0.4614.3 3—I get upset easily or feel panicky. 1.250.5419.41.260.5322.3 1.22 0.5615.5 4—I feel like I’m falling apart and going to pieces. 1.430.6335.11.490.64 40.8 1.34 0.61 27.6 5—I feel that everything is all right and nothing bad will happen.*2.37 0.92 82.1 2.54 0.92 88.2 2.14 0.89 74.2 6—My arms and legs shake and tremble. 1.360.5731.41.410.6134.2 1.29 0.5027.6 7—I am bothered by headaches neck and back pain. 1.690.7852.61.690.7952.0 1.69 0.7553.5 8—I feel weak and get tired easily. 1.40 0.63 32.1 1.43 0.62 36.9 1.34 0.64 25.8 9—I feel calm and can sit still easily. 2.11 0.9569.4 2.09 0.91 71.1 2.14 1.02 67.3 10—I can feel my heart beating fast. 1.370.5135.11.430.5540.8 1.28 0.4527.6 11—I am bothered by dizzy spells. 1.360.6427.51.360.6726.3 1.36 0.6129.3 12—I have fainting spells or feel like it. 1.130.479.7 1.200.5913.1 1.05 0.225.2 13—I can breathe in and out easily. 1.660.9539.61.710.9942.1 1.59 0.9036.3 14—I get feelings of numbness and tingling in my fingers & toes.1.370.6629.11.290.6321.1 1.48 0.6839.7 15—I am bothered by stomach aches or indigestion. 1.420.6435.11.460.6638.2 1.36 0.6131.0 16—I have to empty my bladder often. 1.810.8258.91.870.8163.1 1.74 0.8553.4 17—My hands are usually dry and warm.** 2.811.1281.93.051.0688.2 2.49 1.1473.7 18—My face gets hot and blushes. 1.75 0.80 56.71.790.85 57.9 1.71 0.73 55.2 19—I fall asleep easily and get a good night’s rest. 1.840.9950.01.910.9755.3 1.76 1.0143.1 20—I have nightmares. 1.370.6629.81.450.7035.4 1.28 0.5622.4 Note: *Differences between men and women to p < 0.05; **Differences between men and women to p < 0.01. Copyright © 2013 SciRes. OPEN ACCESS 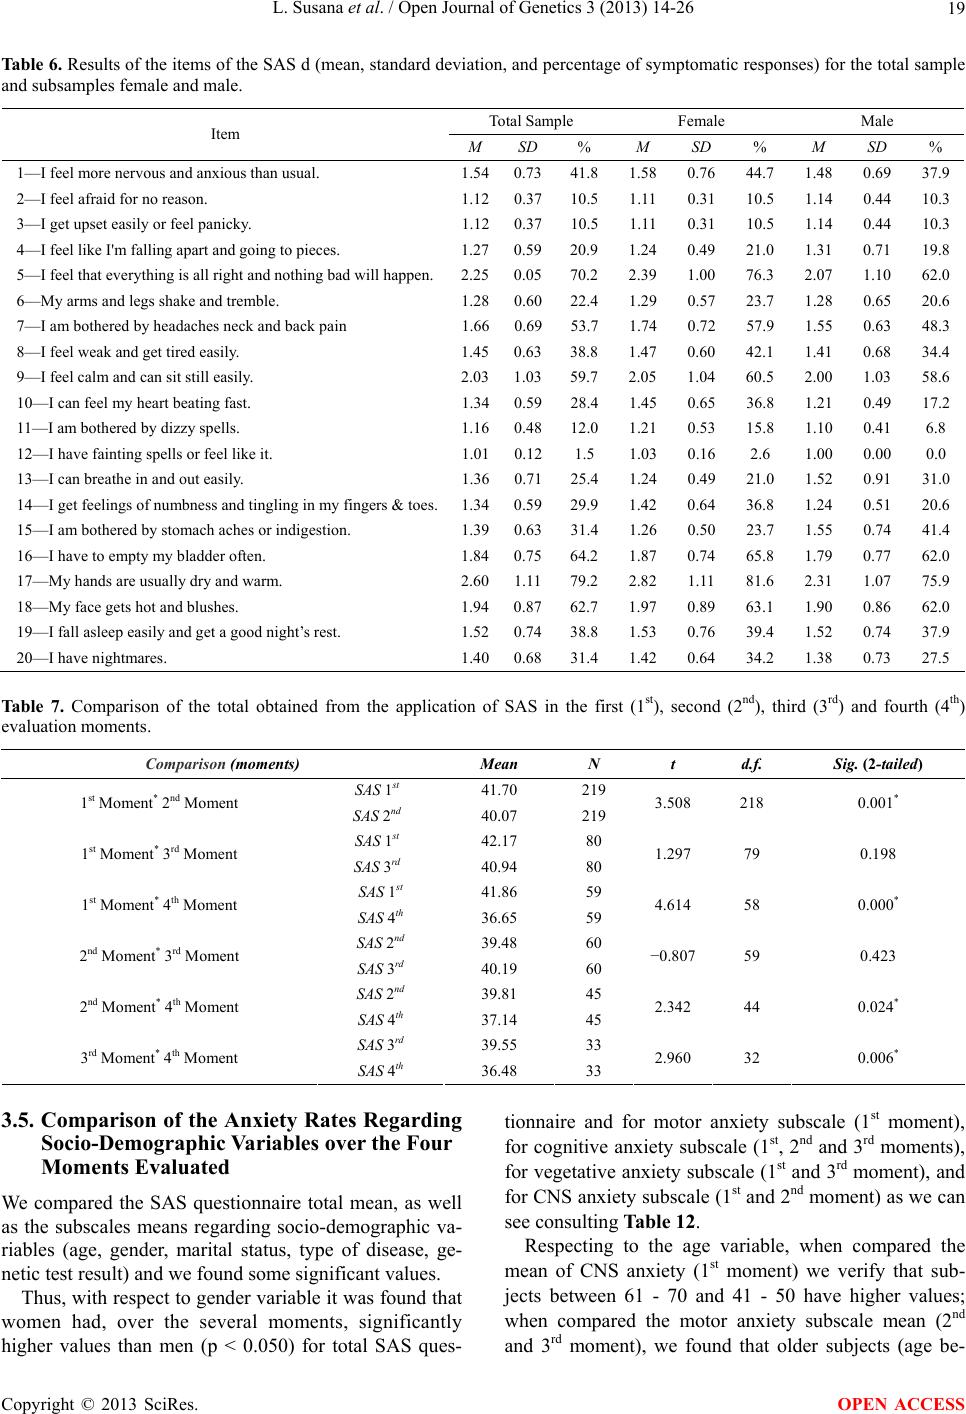 L. Susana et al. / Open Journal of Genetics 3 (2013) 14-26 Copyright © 2013 SciRes. 19 OPEN ACCESS Table 6. Results of the items of the SAS d (mean, standard deviation, and percentage of symptomatic responses) for the total sample and subsamples female and male. Total Sample Female Male Item M SD % M SD % M SD % 1—I feel more nervous and anxious than usual. 1.540.7341.8 1.58 0.76 44.7 1.48 0.69 37.9 2—I feel afraid for no reason. 1.120.3710.51.110.3110.5 1.14 0.4410.3 3—I get upset easily or feel panicky. 1.120.3710.51.110.3110.5 1.14 0.4410.3 4—I feel like I'm falling apart and going to pieces. 1.270.5920.91.240.49 21.0 1.31 0.71 19.8 5—I feel that everything is all right and nothing bad will happen.2.250.0570.2 2.39 1.00 76.3 2.07 1.10 62.0 6—My arms and legs shake and tremble. 1.280.6022.41.290.5723.7 1.28 0.6520.6 7—I am bothered by headaches neck and back pain 1.660.6953.71.740.7257.9 1.55 0.6348.3 8—I feel weak and get tired easily. 1.450.6338.8 1.47 0.60 42.1 1.41 0.68 34.4 9—I feel calm and can sit still easily. 2.031.0359.7 2.05 1.04 60.5 2.00 1.03 58.6 10—I can feel my heart beating fast. 1.340.5928.41.450.6536.8 1.21 0.4917.2 11—I am bothered by dizzy spells. 1.160.4812.01.210.5315.8 1.10 0.416.8 12—I have fainting spells or feel like it. 1.010.121.5 1.030.162.6 1.00 0.000.0 13—I can breathe in and out easily. 1.360.7125.41.240.4921.0 1.52 0.9131.0 14—I get feelings of numbness and tingling in my fingers & toes.1.340.5929.91.420.6436.8 1.24 0.5120.6 15—I am bothered by stomach aches or indigestion. 1.390.6331.4 1.26 0.50 23.7 1.55 0.74 41.4 16—I have to empty my bladder often. 1.840.7564.2 1.87 0.74 65.8 1.79 0.77 62.0 17—My hands are usually dry and warm. 2.601.1179.2 2.82 1.11 81.6 2.31 1.07 75.9 18—My face gets hot and blushes. 1.940.8762.7 1.97 0.89 63.1 1.90 0.86 62.0 19—I fall asleep easily and get a good night’s rest. 1.520.7438.8 1.53 0.76 39.4 1.52 0.74 37.9 20—I have nightmares. 1.400.6831.41.420.6434.2 1.38 0.7327.5 Table 7. Comparison of the total obtained from the application of SAS in the first (1st), second (2nd), third (3rd) and fourth (4th) evaluation moments. Comparison (moments) Mean N t d.f. Sig. (2-tailed) SAS 1st 41.70 219 1st Moment* 2nd Moment SAS 2nd 40.07 219 3.508 218 0.001* SAS 1st 42.17 80 1st Moment* 3rd Moment SAS 3rd 40.94 80 1.297 79 0.198 SAS 1st 41.86 59 1st Moment* 4th Moment SAS 4th 36.65 59 4.614 58 0.000* SAS 2nd 39.48 60 2nd Moment* 3rd Moment SAS 3rd 40.19 60 −0.807 59 0.423 SAS 2nd 39.81 45 2nd Moment* 4th Moment SAS 4th 37.14 45 2.342 44 0.024* SAS 3rd 39.55 33 3rd Moment* 4th Moment SAS 4th 36.48 33 2.960 32 0.006* 3.5. Comparison of the Anxiety Rates Regarding Socio-Demographic Variables over the Four Moments Evaluated We compared the SAS questionnaire total mean, as well as the subscales means regarding socio-demographic va- riables (age, gender, marital status, type of disease, ge- netic test result) and we found some significant values. Thus, with respect to gender variable it was found that women had, over the several moments, significantly higher values than men (p < 0.050) for total SAS ques- tionnaire and for motor anxiety subscale (1st moment), for cognitive anxiety subscale (1st, 2nd and 3rd moments), for vegetative anxiety subscale (1st and 3rd moment), and for CNS anxiety subscale (1st and 2nd moment) as we can see consulting Table 12. Respecting to the age variable, when compared the mean of CNS anxiety (1st moment) we verify that sub- jects between 61 - 70 and 41 - 50 have higher values; when compared the motor anxiety subscale mean (2nd and 3rd moment), we found that older subjects (age be- 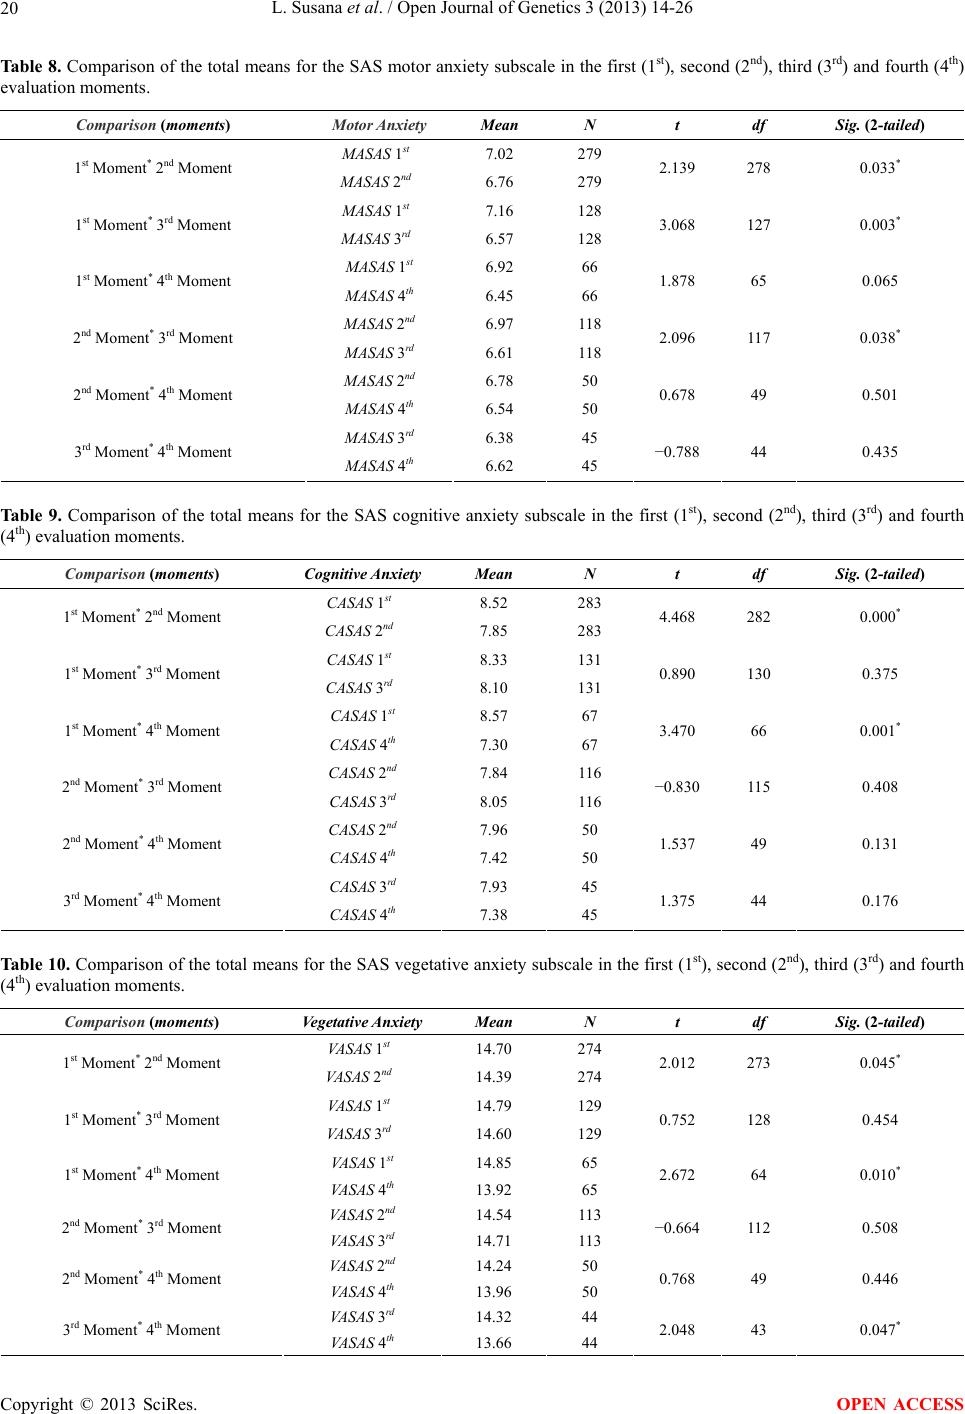 L. Susana et al. / Open Journal of Genetics 3 (2013) 14-26 20 Tab le 8. Comparison of the total means for the SAS motor anxiety subscale in the first (1st), second (2nd), third (3rd) and fourth (4th) evaluation moments. Comparison (moments) Motor Anxiety Mean N t df Sig. (2-tailed) MASAS 1st 7.02 279 1st Moment* 2nd Moment MASAS 2nd 6.76 279 2.139 278 0.033* MASAS 1st 7.16 128 1st Moment* 3rd Moment MASAS 3rd 6.57 128 3.068 127 0.003* MASAS 1st 6.92 66 1st Moment* 4th Moment MASAS 4th 6.45 66 1.878 65 0.065 MASAS 2nd 6.97 118 2nd Moment* 3rd Moment MASAS 3rd 6.61 118 2.096 117 0.038* MASAS 2nd 6.78 50 2nd Moment* 4th Moment MASAS 4th 6.54 50 0.678 49 0.501 MASAS 3rd 6.38 45 3rd Moment* 4th Moment MASAS 4th 6.62 45 −0.788 44 0.435 Ta bl e 9 . Comparison of the total means for the SAS cognitive anxiety subscale in the first (1st), second (2nd), third (3rd) and fourth (4th) evaluation moments. Comparison (moments) Cognitive Anxiety Mean N t df Sig. (2-tailed) CASAS 1st 8.52 283 1st Moment* 2nd Moment CASAS 2nd 7.85 283 4.468 282 0.000* CASAS 1st 8.33 131 1st Moment* 3rd Moment CASAS 3rd 8.10 131 0.890 130 0.375 CASAS 1st 8.57 67 1st Moment* 4th Moment CASAS 4th 7.30 67 3.470 66 0.001* CASAS 2nd 7.84 116 2nd Moment* 3rd Moment CASAS 3rd 8.05 116 −0.830 115 0.408 CASAS 2nd 7.96 50 2nd Moment* 4th Moment CASAS 4th 7.42 50 1.537 49 0.131 CASAS 3rd 7.93 45 3rd Moment* 4th Moment CASAS 4th 7.38 45 1.375 44 0.176 Table 10. Comparison of the total means for the SAS vegetative anxiety subscale in the first (1st), second (2nd), third (3rd) and fourth (4th) evaluation moments. Comparison (moments) Vegetative Anxiety Mean N t df Sig. (2-tailed) VASAS 1st 14.70 274 1st Moment* 2nd Moment VASAS 2nd 14.39 274 2.012 273 0.045* VASAS 1st 14.79 129 1st Moment* 3rd Moment VASAS 3rd 14.60 129 0.752 128 0.454 VASAS 1st 14.85 65 1st Moment* 4th Moment VASAS 4th 13.92 65 2.672 64 0.010* VASAS 2nd 14.54 113 2nd Moment* 3rd Moment VASAS 3rd 14.71 113 −0.664 112 0.508 VASAS 2nd 14.24 50 2nd Moment* 4th Moment VASAS 4th 13.96 50 0.768 49 0.446 VASAS 3rd 14.32 44 3rd Moment* 4th Moment VASAS 4th 13.66 44 2.048 43 0.047* Copyright © 2013 SciRes. OPEN ACCESS 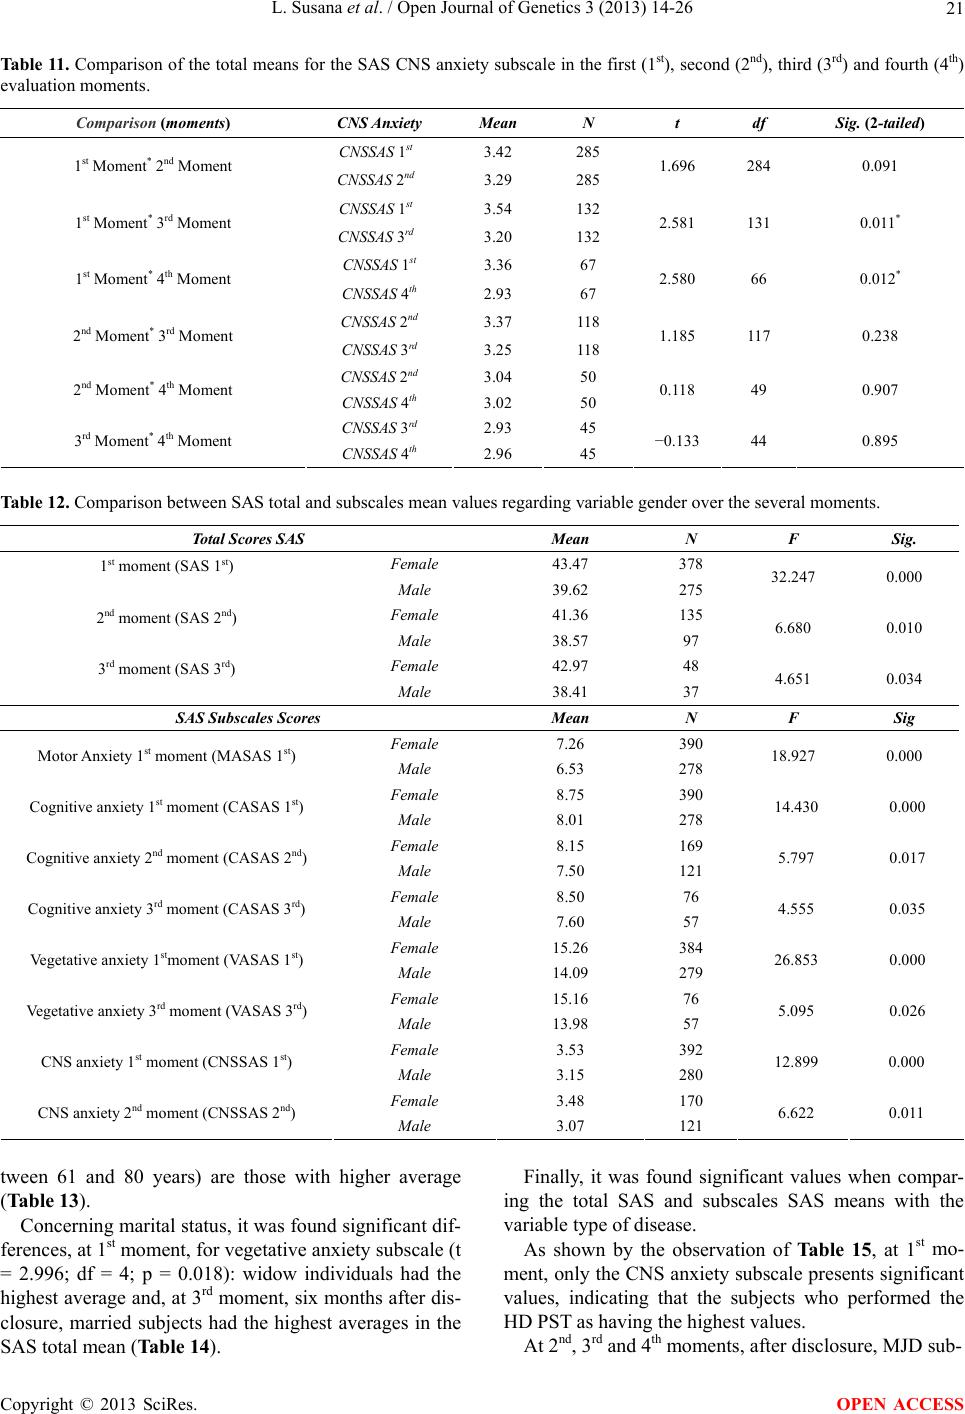 L. Susana et al. / Open Journal of Genetics 3 (2013) 14-26 21 Tab le 1 1 . Comparison of the total means for the SAS CNS anxiety subscale in the first (1st), second (2nd), third (3rd) and fourth (4th) evaluation moments. Comparison (moments) CNS Anxiety Mean N t df Sig. (2-tailed) CNSSAS 1st 3.42 285 1st Moment* 2nd Moment CNSSAS 2nd 3.29 285 1.696 284 0.091 CNSSAS 1st 3.54 132 1st Moment* 3rd Moment CNSSAS 3rd 3.20 132 2.581 131 0.011* CNSSAS 1st 3.36 67 1st Moment* 4th Moment CNSSAS 4th 2.93 67 2.580 66 0.012* CNSSAS 2nd 3.37 118 2nd Moment* 3rd Moment CNSSAS 3rd 3.25 118 1.185 117 0.238 CNSSAS 2nd 3.04 50 2nd Moment* 4th Moment CNSSAS 4th 3.02 50 0.118 49 0.907 CNSSAS 3rd 2.93 45 3rd Moment* 4th Moment CNSSAS 4th 2.96 45 −0.133 44 0.895 Table 12. Comparison between SAS total and subscales mean values regarding variable gender over the several moments. Total Scores SAS Mean N F Sig. Female 43.47 378 1st moment (SAS 1st) Male 39.62 275 32.247 0.000 Female 41.36 135 2nd moment (SAS 2nd) Male 38.57 97 6.680 0.010 Female 42.97 48 3rd moment (SAS 3rd) Male 38.41 37 4.651 0.034 SAS Subscales Scores Mean N F Sig Female 7.26 390 Motor Anxiety 1st moment (MASAS 1st) Male 6.53 278 18.927 0.000 Female 8.75 390 Cognitive anxiety 1st moment (CASAS 1st) Male 8.01 278 14.430 0.000 Female 8.15 169 Cognitive anxiety 2nd moment (CASAS 2nd) Male 7.50 121 5.797 0.017 Female 8.50 76 Cognitive anxiety 3rd moment (CASAS 3rd) Male 7.60 57 4.555 0.035 Female 15.26 384 Vegetative anxiety 1stmoment (VASAS 1st) Male 14.09 279 26.853 0.000 Female 15.16 76 Vegetative anxiety 3rd moment (VASAS 3rd) Male 13.98 57 5.095 0.026 Female 3.53 392 CNS anxiety 1st moment (CNSSAS 1st) Male 3.15 280 12.899 0.000 Female 3.48 170 CNS anxiety 2nd moment (CNSSAS 2nd) Male 3.07 121 6.622 0.011 tween 61 and 80 years) are those with higher average (Table 13). Concerning marital status, it was found significant dif- ferences, at 1st moment, for vegetative anxiety subscale (t = 2.996; df = 4; p = 0.018): widow individuals had the highest average and, at 3rd moment, six months after dis- closure, married subjects had the highest averages in the SAS total mean (Table 14). Finally, it was found significant values when compar- ing the total SAS and subscales SAS means with the variable type of disease. As shown by the observation of Ta ble 15, at 1st mo- ment, only the CNS anxiety subscale presents significant values, indicating that the subjects who performed the HD PST as having the highest values. At 2nd, 3rd and 4th moments, after disclosure, MJD sub- Copyright © 2013 SciRes. OPEN ACCESS 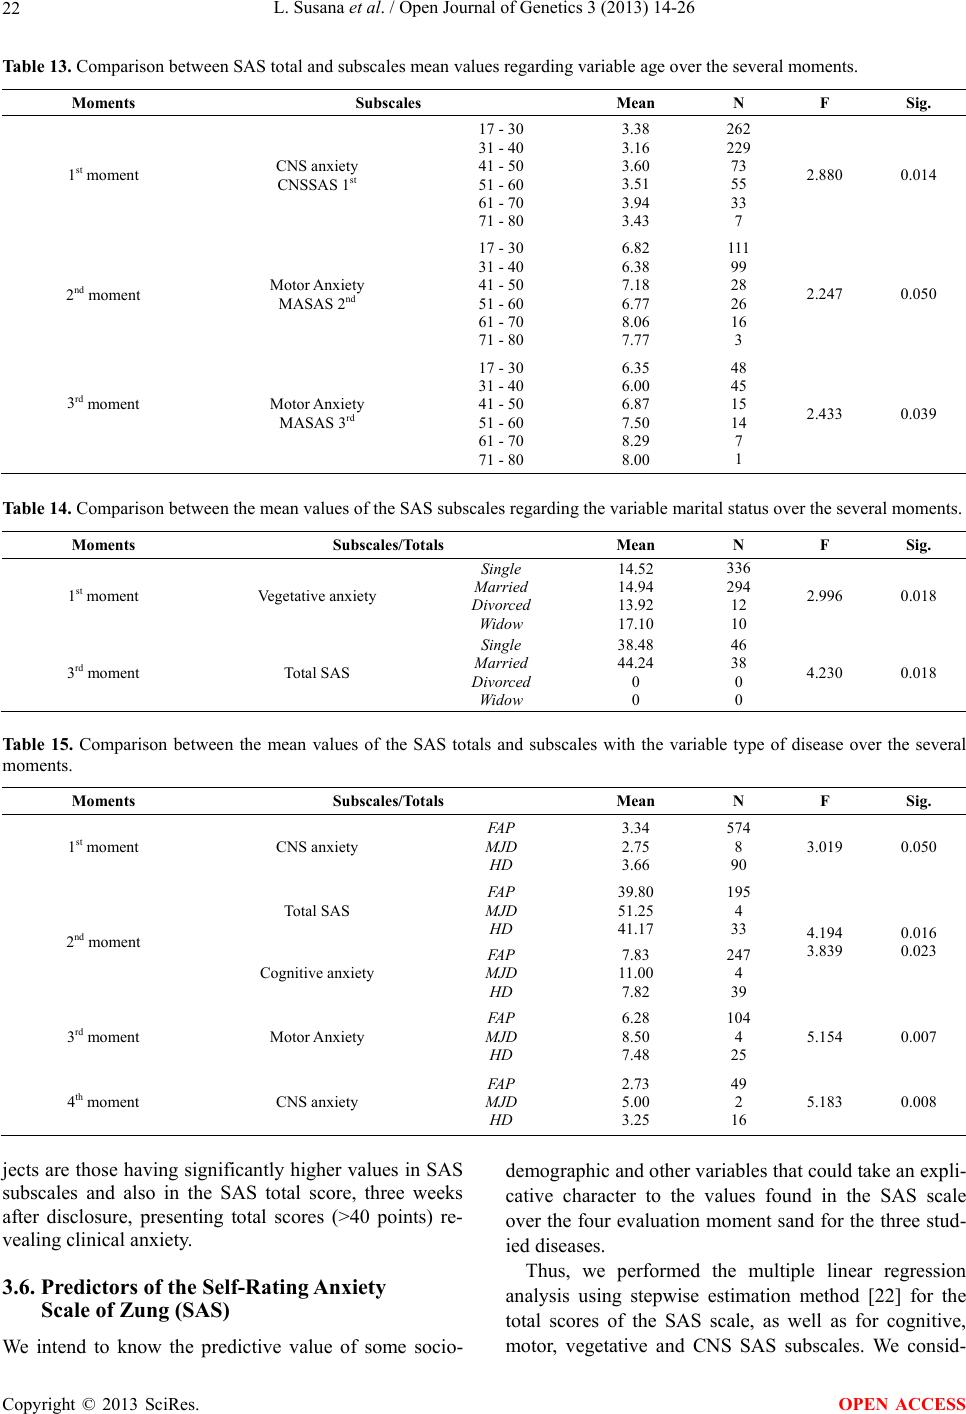 L. Susana et al. / Open Journal of Genetics 3 (2013) 14-26 22 Table 13. Comparison between SAS total and subscales mean values regarding variable age over the several moments. Moments Subscales Mean N F Sig. 1st moment CNS anxiety CNSSAS 1st 17 - 30 31 - 40 41 - 50 51 - 60 61 - 70 71 - 80 3.38 3.16 3.60 3.51 3.94 3.43 262 229 73 55 33 7 2.880 0.014 2nd moment Motor Anxiety MASAS 2nd 17 - 30 31 - 40 41 - 50 51 - 60 61 - 70 71 - 80 6.82 6.38 7.18 6.77 8.06 7.77 111 99 28 26 16 3 2.247 0.050 3rd moment Motor Anxiety MASAS 3rd 17 - 30 31 - 40 41 - 50 51 - 60 61 - 70 71 - 80 6.35 6.00 6.87 7.50 8.29 8.00 48 45 15 14 7 1 2.433 0.039 Table 14. Comparison between the mean values of the SAS subscales regarding the variable marital status over the several moments. Moments Subscales/Totals Mean N F Sig. 1st moment Vegetative anxiety Single Married Divorced Widow 14.52 14.94 13.92 17.10 336 294 12 10 2.996 0.018 3rd moment Total SAS Single Married Divorced Widow 38.48 44.24 0 0 46 38 0 0 4.230 0.018 Table 15. Comparison between the mean values of the SAS totals and subscales with the variable type of disease over the several moments. Moments Subscales/Totals Mean N F Sig. 1st moment CNS anxiety FAP MJD HD 3.34 2.75 3.66 574 8 90 3.019 0.050 Total SAS FAP MJD HD 39.80 51.25 41.17 195 4 33 2nd moment Cognitive anxiety FAP MJD HD 7.83 11.00 7.82 247 4 39 4.194 3.839 0.016 0.023 3rd moment Motor Anxiety FAP MJD HD 6.28 8.50 7.48 104 4 25 5.154 0.007 4th moment CNS anxiety FAP MJD HD 2.73 5.00 3.25 49 2 16 5.183 0.008 jects are those having significantly higher values in SAS subscales and also in the SAS total score, three weeks after disclosure, presenting total scores (>40 points) re- vealing clinical anxiety. 3.6. Predictors of the Self-Rating Anxiety Scale of Zung (SAS) We intend to know the predictive value of some socio- demographic and other variables that could take an expli- cative character to the values found in the SAS scale over the four evaluation moment sand for the three stud- ied diseases. Thus, we performed the multiple linear regression analysis using stepwise estimation method [22] for the total scores of the SAS scale, as well as for cognitive, motor, vegetative and CNS SAS subscales. We consid- Copyright © 2013 SciRes. OPEN ACCESS 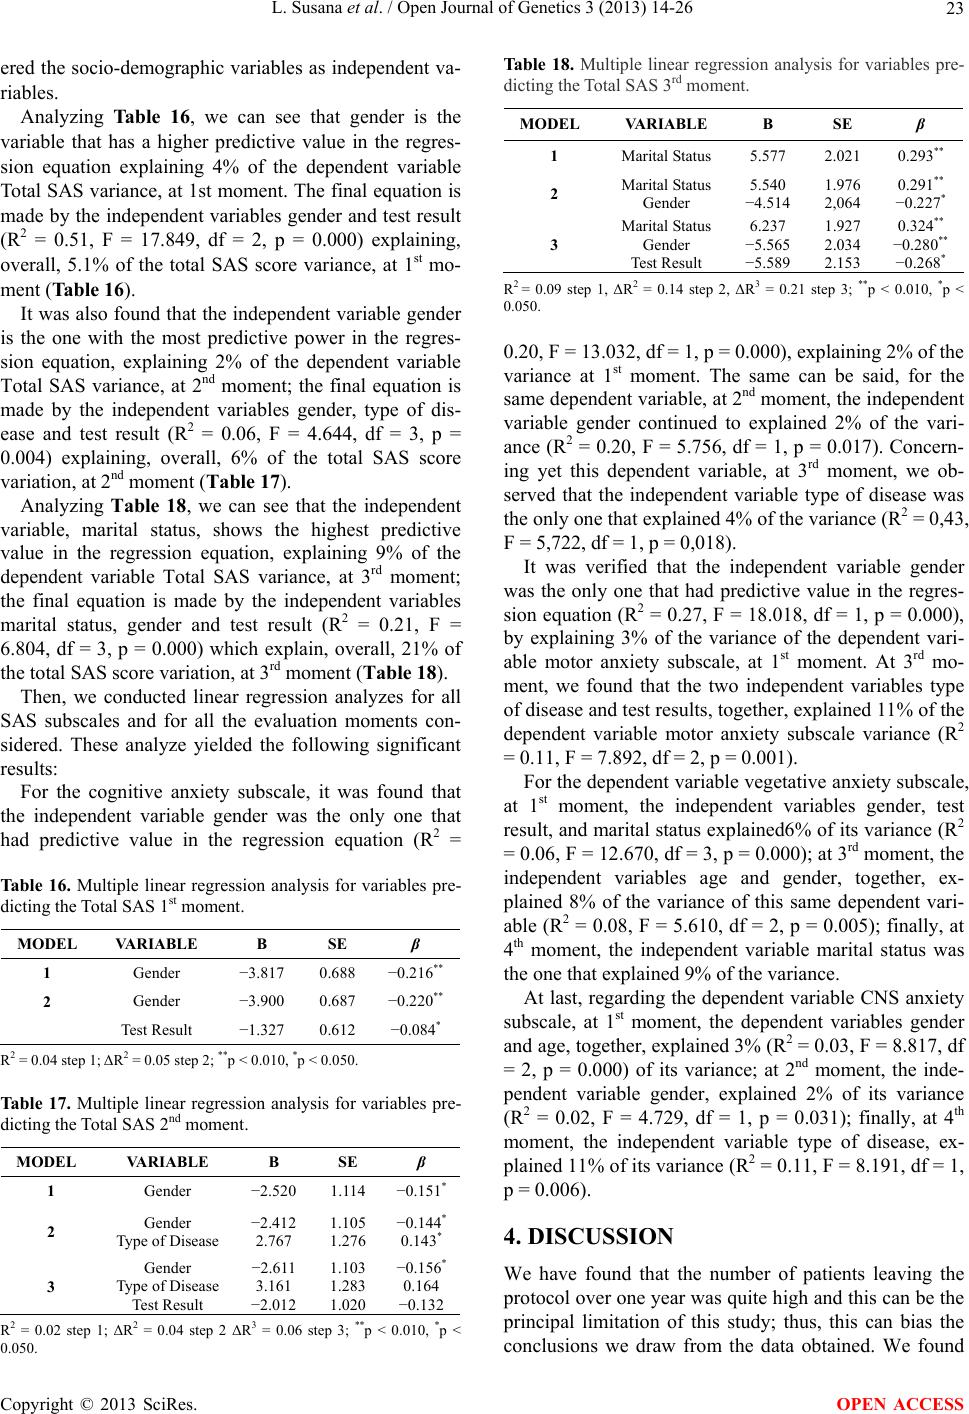 L. Susana et al. / Open Journal of Genetics 3 (2013) 14-26 23 ered the socio-demographic variables as independent va- riables. Analyzing Table 16, we can see that gender is the variable that has a higher predictive value in the regres- sion equation explaining 4% of the dependent variable Total SAS variance, at 1st moment. The final equation is made by the independent variables gender and test result (R2 = 0.51, F = 17.849, df = 2, p = 0.000) explaining, overall, 5.1% of the total SAS score variance, at 1st mo- ment (Table 16). It was also found that the independent variable gender is the one with the most predictive power in the regres- sion equation, explaining 2% of the dependent variable Total SAS variance, at 2nd moment; the final equation is made by the independent variables gender, type of dis- ease and test result (R2 = 0.06, F = 4.644, df = 3, p = 0.004) explaining, overall, 6% of the total SAS score variation, at 2nd moment (Table 17). Analyzing Table 18, we can see that the independent variable, marital status, shows the highest predictive value in the regression equation, explaining 9% of the dependent variable Total SAS variance, at 3rd moment; the final equation is made by the independent variables marital status, gender and test result (R2 = 0.21, F = 6.804, df = 3, p = 0.000) which explain, overall, 21% of the total SAS score variation, at 3rd moment (Table 18). Then, we conducted linear regression analyzes for all SAS subscales and for all the evaluation moments con- sidered. These analyze yielded the following significant results: For the cognitive anxiety subscale, it was found that the independent variable gender was the only one that had predictive value in the regression equation (R2 = Table 16. Multiple linear regression analysis for variables pre- dicting the Total SAS 1st moment. MODEL VARIABLE B SE β 1 Gender −3.817 0.688 −0.216** 2 Gender −3.900 0.687 −0.220** Test Result −1.327 0.612 −0.084* R2 = 0.04 step 1; ΔR2 = 0.05 step 2; **p < 0.010, *p < 0.050. Table 17. Multiple linear regression analysis for variables pre- dicting the Total SAS 2nd moment. MODEL VARIABLE B SE β 1 Gender −2.520 1.114 −0.151* 2 Gender Type of Disease −2.412 2.767 1.105 1.276 −0.144* 0.143* 3 Gender Type of Disease Test Result −2.611 3.161 −2.012 1.103 1.283 1.020 −0.156* 0.164 −0.132 R2 = 0.02 step 1; ΔR2 = 0.04 step 2 ΔR3 = 0.06 step 3; **p < 0.010, *p < 0.050. Table 18. Multiple linear regression analysis for variables pre- dicting the Total SAS 3rd moment. MODEL VARIABLE B SE β 1 Marital Status 5.577 2.021 0.293** 2 Marital Status Gender 5.540 −4.514 1.976 2,064 0.291** −0.227* 3 Marital Status Gender Test Result 6.237 −5.565 −5.589 1.927 2.034 2.153 0.324** −0.280** −0.268* R2 = 0.09 step 1, ΔR2 = 0.14 step 2, ΔR3 = 0.21 step 3; **p < 0.010, *p < 0.050. 0.20, F = 13.032, df = 1, p = 0.000), explaining 2% of the variance at 1st moment. The same can be said, for the same dependent variable, at 2nd moment, the independent variable gender continued to explained 2% of the vari- ance (R2 = 0.20, F = 5.756, df = 1, p = 0.017). Concern- ing yet this dependent variable, at 3rd moment, we ob- served that the independent variable type of disease was the only one that explained 4% of the variance (R2 = 0,43, F = 5,722, df = 1, p = 0,018). It was verified that the independent variable gender was the only one that had predictive value in the regres- sion equation (R2 = 0.27, F = 18.018, df = 1, p = 0.000), by explaining 3% of the variance of the dependent vari- able motor anxiety subscale, at 1st moment. At 3rd mo- ment, we found that the two independent variables type of disease and test results, together, explained 11% of the dependent variable motor anxiety subscale variance (R2 = 0.11, F = 7.892, df = 2, p = 0.001). For the dependent variable vegetative anxiety subscale, at 1st moment, the independent variables gender, test result, and marital status explained6% of its variance (R2 = 0.06, F = 12.670, df = 3, p = 0.000); at 3rd moment, the independent variables age and gender, together, ex- plained 8% of the variance of this same dependent vari- able (R2 = 0.08, F = 5.610, df = 2, p = 0.005); finally, at 4th moment, the independent variable marital status was the one that explained 9% of the variance. At last, regarding the dependent variable CNS anxiety subscale, at 1st moment, the dependent variables gender and age, together, explained 3% (R2 = 0.03, F = 8.817, df = 2, p = 0.000) of its variance; at 2nd moment, the inde- pendent variable gender, explained 2% of its variance (R2 = 0.02, F = 4.729, df = 1, p = 0.031); finally, at 4th moment, the independent variable type of disease, ex- plained 11% of its variance (R2 = 0.11, F = 8.191, df = 1, p = 0.006). 4. DISCUSSION We have found that the number of patients leaving the protocol over one year was quite high and this can be the principal limitation of this study; thus, this can bias the conclusions we draw from the data obtained. We found Copyright © 2013 SciRes. OPEN ACCESS  L. Susana et al. / Open Journal of Genetics 3 (2013) 14-26 24 that, proportionally, the number of carriers increases and non carriers decreases over protocol, i.e., the carriers remain in the protocol more than non carriers; therefore, it is necessary to take into account this point as one of the limitations of this study. The descriptive analysis, such as a previous study of measurement of scale to Portuguese population [19], revealed that female had higher values of anxiety symp- toms. The pre-test (1st moment) recorded higher values for both genders, although for women values were in- dicative of clinical anxiety (score ≥ 40) and men were on the border between normal and pathological anxiety. For both groups it can be stated that anxiety decreased over four assessment moments. We also obtained results quite acceptable for internal consistency, since the αvalues were always, for all mo- ments and groups considered, very close to 0.80, leading us to conclude that this instrument is reliable for the studied population. By examining the 20 items scale, we find that women, in the pre-test (1st moment), revealed a higher level of restlessness, pessimism and fear, and a greater pain asso- ciated with the presence of a higher generalized tension (head, neck and back); these findings seem to corrobo- rate the presence of the total scores inducing anxiety symptoms, even before the completion of the TPS, as said in previous paragraph. Higher values of anxiety symptoms at the beginning of PST, in women, could mean that pre-test (1st moment) itself may bea trigger of anxiety disturbance, as well as other studies have men- tioned, supporting the need for psychological support since the beginning of the genetic counseling PST proc- ess [23,24]. Three weeks after PST disclosure (2nd moment), women continued to show a greater presence of items answered with options-inducing presence of anxiety symptoms, in particular, revealing more likely to present sleep disor- ders. These data, i.e., the reduction of anxiety score during the protocol (mostly, from 1st moment to 2nd moment, first post-test immediately after the PST communication), also seem to indicate that the PST brings advantages in reducing the uncertainty and self control effects for the disease to which the at-risk individual decides to make the test [15,16,25]. Considering the anxiety total scores and subscales values regarding socio-demographic variables, some sig- nificant results were found: Thus, with respect to gender variable it was found that women had, over the several moments, significantly higher values than men for total SAS questionnaire and for motor anxiety subscale (1st moment), for cognitive anxiety subscale (1st, 2nd and 3rd moments), for vegetative anxiety subscale (1st and 3rd moment), and for CNS anxi- ety subscale (1st and 2nd moment). Respecting to the age variable, when compared the mean of CNS anxiety (1st moment) we verify that sub- jects between 61 - 70 and 41 - 50 have higher values; when compared the motor anxiety subscale mean (2nd and 3rd moment), we found that older subjects(age be- tween 61 and 80 years) are those with higher average. This can be explained, first, according to the SAS scale normalization studies for the portuguese population, there is a greater tendency for older individuals present higher values of anxiety [26]; second, the age of these subjects (between 40 and 51 years) is approaching the age mean considered to the beginning of this late on-set diseases first symptoms, that can lead to higher anxiety values. Considering marital status, we found a tendency for widow subjects had the highest average in the vegetative anxiety subscale at pre-test (1st moment); this result seems to point to the hypothesis that people at risk and more alone may have greater tendency for a higher level of anxiety symptoms. Widowhood maybe relates to the perceived lack of effective care, by becoming more dif- ficult the existence of a future caregiver. The fact that, in the divorced group, we did not observe the same trend, canbe explained with the age factor, i.e., widows tend to be older people. After 6months of PST disclosure (3rd moment), the married subjects group had higher total anxiety, compared with the single individuals (note that this moment assessed only subjects with these two mari- tal status); therefore, it may be the existence of a partner or objectives of having a child, significant factors to in- duce higher values of anxiety, since it was widely stud- ied the importance of partners in the at-risk and/or ill patients for HD [8,27]. Finally, when we compared the total scores and sub- scales means regarding the type of disease variable, we found significant values for the CNS anxiety subscale, in the pre-test, for HD; this may indicate greater anxiety for those at risk for this disease, given the severity of their clinical condition. This may also be related to some HD carriers psychopathological symptoms, that may already be manifesting at the beginning of the PST protocol (1st moment). This aspect concerning the disease severity might explain why, at all post-test moments (2nd, 3rd and 4th moments), the HD subjects continued to reveal supe- rior anxiety results, only being surpassed by the MJD subjects (however, MJD group were not significant). Subjects who performed the test for FAP showed lower values, perhaps because they have hope on the drug treatment in the near future or in the currently available solution, the liver transplantation, in order to wage dis- ease progression, both solutions nonexistent for HD or MJD [3,28]. Regarding test result variable, there were no statisti- Copyright © 2013 SciRes. OPEN ACCESS  L. Susana et al. / Open Journal of Genetics 3 (2013) 14-26 25 cally significant results, as previous studies were indi- cated for HD: knowledge of carrier or non-carrier status does not seem to bring a negative psychological impact on individuals [7,8,28]. Several studies have indicated the importance of the socio-demographic variables predictive character for po- pulation that performs the PST [3,6-8,16,28] for the es- tablishment of more effective interventions in those indi- viduals identified as vulnerable. This study identified va- riables such as gender, type of disease, marital status as having some predictive value with respect to what can be expected about future anxiety symptoms presented along the several assessed moments. For this reason, the need for a personalized and careful monitoring to each indi- vidual who performs a PST protocol remains a substan- tial ethical principle in conducting such genetic tests [2, 3]. 5. CONCLUSIONS We found a decrease in mean values over the four eva- luations moments regarding total scores obtained by ap- plying the Self-Ranting Anxiety Scale of Zung (SAS), evidencing that subjects have higher values before pre- symptomatic test (1st moment) than in the several post- testing moments (2nd, 3rd and 4th moments), mainly a year after knowing their genetic status. However, for the fe- male population, the SAS means scores revealed a result of clinical anxiety (>40 points) from the pre-test (1st mo- ment), only decreasing to non clinical scores a year after PST disclosure (4th moment). The inherent characteristics of each disease here stud- ied, as well as the knowledge of the genetic status—to be or not to be a carrier—do not appear to significantly in- fluence the presence of anxiety disorder. However, we find a lower trend in subject’s average who took the PST for FAP. The variables gender, age and marital status, showed an oscillating weight in the anxiety scores verifying that female has higher values, as well as the older subjects or those who are closer to the beginning of the first symp- toms; widows also had the highest anxiety scores. Although, from a clinical point of view, we have not found values indicating anxiety disorder, we can con- clude however that pre-symptomatic test for studying diseases causes a considerable anxiety level, since the averages were always very close to the cutoff point of the SAS. REFERENCES [1] International Huntington Association and World Federa- tion of Neurology Research Group on Huntington’s Dis- ease (1994) Guidelines for the molecular genetics predic- tive test in Huntington’s disease. Journal of Medical Ge- netics, 31, 555-559. doi:10.1136/jmg.31.7.555 [2] Sequeiros, J. (1996) Aconselhamento genético e teste preditivo na Doença de Machado-Joseph. In: Sequeiros, J., Ed., O Teste Preditivo da Doença de Machado-Joseph, UnIGENe, IBMC, Porto. [3] Paneque, H.M., Prieto, A.L., Reynaldo, R.R., Cruz, M.T., Santos, F.N., Almaguer, M.L., et al. (2007) Psychological aspects of presymptomatic diagnosis of spinocerebellar ataxia type 2 in Cuba. Journal of Community Genetics, 10, 132-139. doi:10.1159/000101754 [4] Lerman, C. (1997) Psychological aspects of genetic test- ing: Introduction to the special issue. Health Psychology, 16, 3-7. doi:10.1037/h0092702 [5] Decruyenaere, M., Evers-Kiebooms, G. and Van Den Berghe, H. (1997) Non-participation in predictive testing for Huntington’s Disease: Individual decision-making, personality and avoidant behavior in the family. Euro- pean Journal of Human Genetics, 5, 351-363. [6] Almqvist, E.W., Bloch, M. and Hayden, M. (1999) A worldwide assessment of the frequency of suicide, sui- cide attempts, or psychiatric hospitalization after predic- tive testing for Huntington Disease. American Journal of Human Genetics, 64, 1293-1304. doi:10.1086/302374 [7] Codori, A., Slavney, P.R. and Brandt, J. (1997) Predictors of psychological adjustment to genetic testing of Hunt- ington’s Disease. Health Psychology, 16, 36-50. doi:10.1037/0278-6133.16.1.36 [8] Tibben, A., Timman, R., Bannink, E. and Duivenvoorden, H. (1997) Three years follow-up after presymptomatic testing for Huntington’s Disease in tested individuals and partners. Health Psychology, 16, 20-35. doi:10.1037/0278-6133.16.1.20 [9] Sequeiros, J. (1996) Genética clássica e genética mole- cular na Doença de Machado-Joseph. In: Sequeiros, J., Ed., O Teste Preditivo da Doença de Machado-Joseph, UnIGENe, IBMC, Porto, 1996. [10] Saraiva, M.J. and Costa, P. (1986) Familial amyloidotic polyneuropathy, Portuguese type: Phenotype and geno- type. In: Sales Luís, M.L., Ed., Symposiumon Peripheral Neuropathies, Lisboa, 207-212. [11] Lopes, A. and Fleming, M. (1996) Doença somática e organização psíquica: Reflexões a partir da Polineuro- patia Amiloidótica Familiar. Revista Portuguesa de Psi- canálise, 15, 93-100. [12] Lopes, A. and Fleming, M. (1998) Aspectos psicológicos da Polineuropatia Amiloidótica Familiar: A trama sub- terrânea intergeracional. Brotéria Genética, XIX, 183- 192. [13] Lêdo, S.O. (2002) Primeiro dia do resto de suas vidas. Alguns aspectos psicológicos da Paramiloidose. MSc Thesis, ISPA, Lisbon. [14] Leite, A. (2006) Determinantes psicossociais da adesão ao teste pré-sintomático em doenças neurológicas here- ditárias de aparecimento tardio. PhD Thesis, Instituto de Ciências Biomédicas Abel Salazar da Universidade do Porto, Porto, 2006. [15] Paneque, H.M., Lemos, C., Sousa, A., Velázquez, P.L., Fleming, M. and Sequeiros, J. (2009) Role of the disease Copyright © 2013 SciRes. OPEN ACCESS  L. Susana et al. / Open Journal of Genetics 3 (2013) 14-26 Copyright © 2013 SciRes. 26 OPEN ACCESS in the psychological impact of pre-symptomatic testing for SCA2 and FAP ATTRV30M: Experience with the disease, kinship and gender of the transmitting parent. Journal of Genetic Counseling, 18, 483-493. doi:10.1007/s10897-009-9240-1 [16] Rolim, L., Leite, A., Ledo, S., Paneque, M., Sequeiros, J. and Fleming, M. (2006) Psychological aspects of pre- symptomatic testing for Machado-Joseph disease and fa- milial amyloid polyneuropathy type I. Clinical Genetics, 69, 297-305. doi:10.1111/j.1399-0004.2006.00606.x [17] Sequeiros, J. (1996) História da Doença de Machado- Joseph. In: Sequeiros, J., Ed., O Teste Preditivo da Do- ença de Machado-Joseph, UnIGENe, IBMC, Porto, 1996. [18] Coutinho, P. (1996) Aspectos clínicos, história natural e epidemiologia na Doença de Machado-Joseph. In: Se- queiros, J., Ed., O Teste Preditivo da Doença de Ma- chado-Joseph, UnIGENe, IBMC, Porto. [19] Vaz Serra, A., Ponciano, E. and Relvas, J. (1982) Afe- rição da escala de auto-avaliação de ansiedade de SAS, numa amostra da população portuguesa-II-Sua avaliação como instrumento de medida. Psiquiatria Clínica, 3, 203- 213. [20] Zung, W.A. (1975) Rating instrument for anxiety disor- ders. Psychosomatics, 12, 371-379. [21] Norusis, M.J. (2011) PASW statistics 19 guide to data analysis by Inc. SPSS. Pearson, 2011. [22] Pestana, M.H. and Gageiro, J.N. (1998) Análise de dados para Ciências Sociais—A complementaridade do SPSS. Edições Sílabo, Lisboa. [23] Sequeiros, J. (1998) Prenatal diagnosis of late-onset dis- eases. Progresos en Diagnóstico Prenatal, 10, 218-220. [24] Weil, J. (2003) Psychosocial genetic counseling in the post-nondirective era: A point of view. Journal of Ge- netic Counseling, 12, 199-211. doi:10.1023/A:1023234802124 [25] Almqvist, E.W., Brinkman, R.R., Wiggins, S. and Hay- den, M.R. (2003) Canadian collaborative study of predic- tive testing. Psychological consequences and predictors of adverse events in the first 5 years after predictive test- ing for Huntington’s disease. Clinical Genetics, 64, 300- 309. doi:10.1034/j.1399-0004.2003.00157.x [26] Ponciano, E., Vaz Serra, A. and Relvas, J. (1982) Afe- rição da Escala de Auto-avaliação de Ansiedade de SAS, numa amostra da população portuguesa-I. Resultados da aplicação numa amostra de população normal. Psiquia- tria Clínica, 3, 191-202. [27] Richards, F. and Williams, K. (2004) Impact on couple relationships of predictive testing for Huntington disease: A longitudinal study. American Journal of Medical Ge- netics, 126, 161-169. [28] DudokdeWit, A.C., Tibben, A., Duivenvoorden, H.J., Nier- meijer, M.F. and Passchier, J. (1998) Predicting adapta- tion to presymptomatic DNA testing for late onset disor- ders: Who will experience distress? Rotterdam Leiden Ge- netics Workgroup. Journal of Medical Genetics, 35, 745- 754. doi:10.1136/jmg.35.9.745
|