 Open Journal of Genetics, 2013, 3, 9-86 OJGen http://dx.doi.org/10.4236/ojgen.2013.32A2002 Published Online July 2013 (http://www.scirp.org/journal/ojgen/) UP780, a Chromone-Enriched Aloe Composition, Enhances Adipose Insulin Receptor Signaling and Decreases Liver Lipid Biosynthesis Julie Tseng-Crank1*, Seon-Gil Do2, Brandon Corneliusen1, Carmen Hertel1, Jennifer Homan1, Mesfin Yimam1, Jifu Zhao1, Qi Jia1 1Unigen, Seattle, USA 2Unigen Korea, Songjung-Ri, Byeongchen-Myeon, Vheonan-Si, Chungnam, South Korea Email: *jtsengcrank@gmail.com Received 12 May 2013; revised 17 June 2013; accepted 17 July 2013 Copyright © 2013 Julie Tseng-Crank et al. This is an open access article distributed under the Creative Commons Attribution License, which permits unrestricted use, distribution, and reproduction in any medium, provided the original work is properly cited. ABSTRACT Nutrigenomic studies were conducted to uncover the mechanism of action for the hypoglycemic and insulin sensitizing effects of UP780. From high fat diet-induc- ed obesity mouse model for UP780, livers and white adipose tissues (WAT) from groups of lean control, high fat diet (HFD), and HFD treated with UP780 were collected for microarray study. Microarray genera- ted gene expression changes were applied to Ingenu- ity Pathway Analysis for changes in canonical meta- bolic and signaling pathways. Microarray was vali- dated by quantitative reverse transcriptase-polyme- rase chain reaction (QPCR), Western blots, liver tri- glyceride, liver cholesterol, liver steatosis, and insulin ELISA. UP780 treatment decreased liver gene expres- sions for multiple enzymes involved in fatty acid bio- synthesis and triglyceride production. UP780 treat- ment increased gene expressions globally for the insu- lin receptor signaling pathway in WAT. Both liver triglyceride and liver cholesterol levels were signifi- cantly reduced by UP780 over HFD. The reduction of liver fat was confirmed by microscopic analysis of li- ver steatosis. Finally, UP780 significantly decreased fasting plasma insulin level over HFD. The mechani- sm of action for UP780 indicated a reduction of liver fat accumulation and an enhancement in adipose tis- sue insulin signaling pathway. This provided mecha- nistic explanation for the in vivo UP780 effects of en- hanced insulin sensitiveity and decreased blood glu- cose in mouse diabetes and prediabetes models. Keywords: Nutrigenomics; Insulin Signaling Pathway; Liver Fatty Acid Biosynthesis; Liver Steatosis; Aloe Vera 1. INTRODUCTION Diabetes and prediabetes have become epidemic globally. In recent US surveys, 26.9% of the population aged 65 years and older had diabetes and 35% of those 20 years or older had prediabetes [1]. WHO of the United Nations estimated in 2011 that 346 million people worldwide had diabetes, and that number was likely to double by 2030 [2]. Complications of diabetes include heart disease, stroke, hypertension, blindness, kidney disease, neuro- pathy, amputation, and dental disease. Economic bur- den of diabetes was high, in US, the 2007 direct and in- direct cost of diabetes amounted to $174 billion [1]. The culprit for the epidemic of type II diabetes and prediabetes/metabolic syndrome is obesity. Obesity pre- disposes patients to a complex metabolic pathology, cha- racterized by a cluster of closely related clinical fea- tures of central obesity, hyperglycemia, insulin resistance, dyslipidaemia and hypertension [3]. Metabolic syndrome is associated with increased risk of type II diabetes and cardiovascular disease; cardiovascular diseases ultima- tely are responsible for a large proportion of diabetic mortality [4]. The epidemics in type II diabetes calls for interventions at the stage of metabolic syndrome, with diet, exercise, and medications/dietary supplements tar- geting insulin resistance, to decrease the societal burden from diabetes. For thousands of years, herbal medicine was the only treatment available to mankind. What is old is not nec- essarily worthless in the modern world. Recently, tradi- tional herbal medicines with a history in diabetic treat- ment, now as nutritional supplements or as alternate me- dicines, were rediscovered by the medical world for obe- sity, metabolic syndrome, and diabetes: Aloe vera leaf gel [5], berberine [6,7], bitter melon [8], ginsenoside Rb1 *Corresponding author. OPEN ACCESS  J. Tseng-Crank et al. / Open Journal of Genetics 3 (2013) 9-86 10 [9], genistein [10], and cinnamon [11], to name a few. In addition, resveratrol from red grape was recently disco- vered to improve obesity and aging related disorders [12]. Aloe vera inner leaf gel and whole leaf extract had been reported to produce a hypoglycemic effect in dia- betic animal models of alloxan-induced diabetic mice [13-15] and type I/type II diabetic rats [16,17]. UP780, the Aloe vera inner leaf gel extract standardized with aloesin, was found to decrease fasting blood glucose lev- els and insulin resistance in mouse diet-induced obesity (DIO) model and db diabetic model [18]. Significantly, UP780 was the subject of a double blind, placebo con- trolled clinical pilot study of prediabetic patients. After eight weeks of treatment, UP780 significantly reduced fasting blood glucose, insulin, HbA1c, fructosamine, and urinary F2-isoprostanes compared to placebo [19]. Although aloe was traditionally used for diabetes treatment, and shown to reduce blood glucose, improve lipid profile, and provide anti-oxidants in diabetic animal models [13,15-17,20,21], there is a paucity of aloe me- chanism of action study. From the UP780 prediabetic DIO mouse study [18], livers and white adipose tissues (WAT) collected from the DIO animals were used in a nutrigenomic study. By microarray/pathway analysis and QPCR gene expression, UP780 decreased fatty acid bio- synthesis and triglyceride production in liver and in- creased insulin receptor signaling pathway in WAT. The microarray and QPCR gene expression data was valida- ted by Western blot, liver triglyceride/cholesterol, liver steatosis, and plasma insulin ELISA. 2. MATERIALS AND METHODS 2.1. Composition of UP780 UP780 is a combination of Aloe vera inner leaf gel powder (QMatrix®) standardized to contain 2% - 4% alo- esin. QMatrix® is produced from Aloe vera gel car- bon-filtered to remove anthraquinone, which has laxative effect [22]. Aloesin, an aromatic chromone isolated from Aloe ferox, was discovered by high throughput screening of 2059 plant extracts to increase adiponectin secretion from differentiated 3T3-L1 adipocytes [18]. In the pre- paration of QMatrix®, aloesin was removed by carbon filtration. Aloesin was added to QMatrix® with an expec- tation of broadening the aloe action for glycemic control. GW1929 is a specific non-thiazolidinedione, tyrosine- derived agonist of peroxisome proliferatoractivated rece- ptor gamma (PPARα, Tocris Bioscience). Thiazolidine- dione class PPAR agonists are standard medicines for type II diabetes [23]. 2.2. Methods Methods for tissue collection from DIO mice, RNA ex- traction, microarray, Ingenuity Pathway Analysis, real- time RT-QPCR, Western blot, liver triglyceride and cho- lesterol assays, liver steatosis, and plasma insulin ELISA are described in the supplemental materials. 3. RESULTS 3.1. Microarray/QPCR and UP780 Mechanism of Action HFD feeding of C57BL/6J mice is known to induce gene expression variations in organs that respond to high ca- loric intake such as liver, fat, and muscle [12]. It was of great interest to observe the effects of UP780 treatment over HFD-induced changes in gene expressions. Micro- array gene expression variations were applied to the con- struction of a hypothesis for UP780 mechanism of action, based on the canonical metabolic and signaling pathway analysis, and taken into account of known gene functions [24,25]. The large volume of pathway analysis results were allocated to the supplemental materials. Only key genes involved in the interpretation of biological signi- ficance of UP780 were validated by QPCR (Table 1). An equivalent Table 2 was generated for WAT. Concordance between liver microarray and liver QPCR was good, 11 out of 14, when the genes loosely categorized as Sig- naling were not counted (Table 1) Concordance between WAT microarray and QPCR was excellent, 11 out of the 13 key genes tested (Table 2) The liver key gene list in Table 1 emphasized the me- tabolic pathways. Liver responds to the nutritional state of the body by modifying the enzyme/gene activities in- volved in metabolism, either by protein phosphorylation or by gene expression variation. With liver, genes encod- ing relevant members of metabolic pathways of fatty acid biosynthesis, fatty acid metabolism, glycollysis/glu- coneogenesis, and fat transport were all found to be stri- kingly up-regulated by HFD and down-regulated by UP780 (Table 1). The hypoglycemic effect of UP780 suggested a decreased gluconeogenesis pathway. Many genes in glycolysis/gluconeogenesis pathway were up- regulated by HFD and down-regulated by UP780 (Table 1, Supplement Figure 5 and Supplement Table 1). While this may suggest a decrease of gluconeogenesis by UP780, close examination of the functions of the genes involved indicated contradictions that cannot be resolved by gene expression data alone. In particular, phosphoe- nolpyruvate carboxykinase (PEPCK) is a rate-limiting enzyme for gluconeogenesis. The cytosolic PEPCK1 was up-regulated by HFD/UP780, opposing gluconeogenesis as a mechanism of hypoglycemic control. Effect of UP780 on carbohydrate metabolism in liver will need further studies. Strong evidence of UP780-modulated metabolic path- ways in support of UP780 insulin-sensitiziing effect was Copyright © 2013 SciRes. OPEN ACCESS  J. Tseng-Crank et al. / Open Journal of Genetics 3 (2013) 9-86 Copyright © 2013 SciRes. 11 OPEN ACCESS Table 1. Liver gene expression variations from microarray and QPCR. For microarray, up-regulations ≥ 0.8 and with a p-value <0.05 are highlighted with red and marked with “ +”, down-regulations ≤−0.8 and with a p-value < 0.05 are high- lighted with green and marked by “ -”. For QPCR, up- and down-regulations over 2 fold difference are highlighted with red and green, respectively. Con- cordances in between microarray and QPCR are marked with ●. Microarray (Fold Change) QPCR (Relative Expression) Genes Description LUP-LVLUP-LCLV-LCLC LV LUP Fatty Acid Biosynthesis ACC1 ACACA, Acetyl-CoA carboxylase 1 −1.80 −1.36 +1.32 ACC2 ACACB, Acetyl-CoA carboxylase 2 −3.11 −2.82 +1.101.00 ± 0.13 0.81 ± 0.06 0.33 ± 0.16● ACSL3 Acyl-CoA synthetase long chain 3 −1.77 −1.43 +1.24 FASN Fatty acid synthase −3.89 −2.53 +1.541.00 ± 0.02 0.93 ± 0.03 0.35 ± 0.01● FADS1 Fatty acid desaturase 1 −1.90 −1.32 +1.43 FADS2 Fatty acid desaturase 2 −3.48 −1.32 +2.79 SCD1 Stearyl-CoA desaturase −4.50 −4.25 +1.071.00 ± 0.00 0.98 ± 0.02 0.26 ± 0.01● ELOV5 Elongation of long chain fatty acids 5 −2.44 −1.34 +1.83 ELOV6 Elongation of long chain fatty acids 6 −2.89 −2.39 +1.25 Fatty Acid Metabolism ACOX1 Acyl-CoA oxidase 1, palmitoyl −1.87 −1.15 +1.621.00 ± 0.01 1.12 ± 0.02 0.92 ± 0.02 ACOT1 Acyl-CoA thioesterase 1, peroxisome −6.42 −3.26 +2.53 CPT1A Carnitine palmitoyl transferase 1A −1.78 +1.21 +2.161.00 ± 0.04 1.43 ± 0.04 1.06 ± 0.05● CRAT Carnitine acetyltransferase −2.41 −1.10 +2.18 HAO2 Hydroxyacid oxidase 2, peroxisome −2.33 −1.15 +2.03 Steroid Biosynthesis FDPS Farnesyl diphosphate synthase −1.39 −1.99 −1.43 HMGCR 3-Hydroxy-3-methylglutaryl-CoA reductase −1.19 −2.26 −1.90 1.00 ± 0.03 0.41 ± 0.01 0.47 ± 0.01● MVD Mevalonate decarboxylase −2.70 −2.51 +1.07 Bile Acid Biosynthesis CYP7A1 Cytochrome P450 7A1 +2.77 −2.45 −4.89 1.06 ± 0.42 0.07 ± 0.03 0.97 ± 0.02● CYP7B1 Cytochrome P450 7B1 +2.76 +2.30 −1.22 1.00 ± 0.50 0.56 ± 0.02 2.53 ± 0.08● Fat Transport APOA4 Apolipoprotein A4, chylomicron −3.48 +2.41 +8.40 CD36 Fat transporter −3.29 −1.34 +2.451.00 ± 0.07 1.98 ± 0.08 0.98 ± 0.04● FABP4 Fatty acid binding protein 4 +1.07 +2.70 +2.521.00 ± 0.04 0.54 ± 0.08 2.77 ± 0.03 FABP5 Fatty acid binding protein 5 +2.63 −1.49 −3.91 1.00 ± 0.06 0.08 ± 0.01 0.64 ± 0.14● LDLR LDL receptor −2.75 −1.54 +1.67 Glycolysis/Gluconeogenesis ALDH1B1 Aldehyde dehydrogenase 1B1 −3.04 −1.77 +1.72 GCK Glucokinase, MODY2 −2.29 +1.13 +2.04 GYS2 Glycogen synthase 2 −1.40 +1.05 +1.471.00 ± 0.09 1.08 ± 0.06 1.14 ± 0.03 HK1 Hexokinase 1 −2.55 −1.77 −1.39 PDK4 Pyruvate dehydrogenase kinase 4 −2.59 −1.41 +1.831.03 ± 0.32 1.70 ± 0.44 0.11 ± 0.04● PKLR Pyruvate kinase, liver & RBC −2.26 −1.54 +1.62 PEPCK1 PCK1, Phosphoenolpyruvate carboxykinase 1 +1.09 +2.34 +2.231.00 ± 0.04 1.73 ± 0.05 2.72 ± 0.08● Signaling AMPKα2 PRKAA2, AMP-activated kinase α2 −1.60 −1.49 +1.071.00 ± 0.02 0.85 ± 0.13 0.96 ± 0.03 AMPKγ2 PRKAG2, AMP-activated kinaseγ2 −1.40 −1.38 −1.01 1.00 ± 0.05 0.79 ± 0.11 0.75 ± 0.01 SLC2A2 GLUT2, solute carrier family 2, member 2 −1.50 −1.37 +1.091.00 ± 0.02 0.84 ± 0.06 0.77 ± 0.04 HNF4A Hepatocyte nuclear factor 4α −1.18 −1.27 −1.07 1.00 ± 0.04 0.74 ± 0.04 1.06 ± 0.04 mTOR FRAP1, FK506 binding protein 12, rapamycin- associated protein 1 −1.10 +1.18 +1.431.00 ± 0.06 0.93 ± 0.01 0.88 ± 0.04 PGC1A PPARγ coactivator 1A −1.66 −1.45 +1.221.46 ± 1.46 1.13 ± 0.79 2.53 ± 0.54 PGC1B PPARγ coactivator 1B −2.32 −1.59 +1.461.08 ± 0.55 1.05 ± 0.26 1.32 ± 0.07 PPARα Peroxisome proliferator-activated receptor −2.41 +1.07 +2.251.00 ± 0.09 1.42 ± 0.03 1.44 ± 0.05 PPARδ Peroxisome proliferators-activated receptor −1.11 +1.07 +1.221.00 ± 0.05 1.12 ± 0.08 0.99 ± 0.14 SREBF1 Sterol regulatory element binding factor 1 −2.40 −1.58 +1.521.00 ± 0.09 0.92 ± 0.04 0.88 ± 0.09 LUP: Livers from UP780 treated DIO mice. LV: Livers from high fat diet, HFD, treated DIO mice. LC: Livers from lean control mice.  J. Tseng-Crank et al. / Open Journal of Genetics 3 (2013) 9-86 12 Table 2. WAT gene expression variations from microarray and QPCR. For microarray, up-regulations ≥ 0.8 and with a p-value < 0.05 are highlighted with red and marked with “ +”, down-regulations ≤−0.8 and with a p-value < 0.05 are highlighted with green and marked with “ -”. For QPCR, up- and down-regulations over 2 fold difference are highlighted with red and green, respectively. Concordances in between microarray and QPCR are marked with ●. Microarray (Fold Change) QPCR (Relative Expression) Gene Description FUP/FVFUP/FCFV/FCFC FV FUP Insulin Receptor Signaling EIF4EBP1 Eeukaryotic translation initiation factor 4E +2.16 +1.02 −2.23 binding protein 1 FOXO1 Forkhead box O1 +1.58 −1.25 −1.97 FRAP1 FK506 binding protein 12-rapamycin associated protein 1, mTOR −1.77 −1.10 +1.92 GYS1 Glycogen synthase 1 (muscle) +2.14 −1.17 −2.50 GYS2 Glycogen synthase 2 (liver) −3.18 +1.75 +5.58 IGF1R Insulin-like growth factor 1 receptor +1.68 −1.21 −2.03 INSR Insulin receptor +1.59 −1.21 −1.92 1.00 ± 0.07 0.24 ± 0.07 0.30 ± 0.22● IRS1 Insulin receptor substrate 1 +2.62 −1.60 −4.19 1.01 ± 0.18 0.58 ± 0.05 1.06 ± 0.08● PIK3CA Phosphoinositide-3-kinase, catalytic, p110 +1.56 −1.19 −1.76 PIK3R1 Phosphoinositide-3-kinase, regulatory 1, p85 +1.55 −1.62 −2.64 PRKCH Protein kinase C, eta −1.67 +2.00 +3.02 SLC2A4 GLUT4, solute carrier family 2, member 4 +2.58 −1.31 −2.31 1.00 ± 0.06 0.64 ± 0.05 0.87 ± 0.05● STXBP4 Syntaxin binding protein 4 +1.81 −1.08 −1.96 VAMP2 Synaptobrevin 2 +1.38 −1.38 −1.90 Cell Cycle BRCA1 Breast cancer 1, early onset −3.30 +1.79 +5.91 CCNB1 Cyclin B1 −2.97 +2.32 +6.89 CCNB2 Cyclin B2 −2.87 +2.43 +6.97 CCNE1 Cyclin E1 −1.59 +1.44 +2.29 CDC2 Cell division cycle 2, G1 to S and G2 to M −2.63 +2.38 +6.27 CDK6 Cyclin-dependent kinase 6 −1.70 +1.55 +2.31 CDKN1A Cyclin-dependent kinase inhibitor 1A (p21, Cip1) −1.60 +2.77 +4.43 CDKN1B Cyclin-dependent kinase inhibitor 1B (p27, Kip1) +1.31 −1.35 −1.77 CDKN2B Cyclin-dependent kinase inhibitor 2B (p15, inhibits CDK4) −2.02 +1.02 +2.06 E2F1 E2F transcription factor 1 −1.28 +1.58 +1.87 E2F6 E2F transcription factor 6 −2.24 +2.08 +4.66 RB1 Retinoblastoma 1 (including osteosarcoma) −1.57 +1.40 +2.19 SIRT1 Sirtuin +1.28 −1.37 −1.75 TOP2A Topoisomerase (DNA) II alpha 170 kDa −2.89 +2.12 +6.12 Metabolism ACACA ACC1, acetyl-Coenzyme A carboxylase alpha +1.84 −4.20 −3.32 1.04 ± 0.32 0.04 ± 0.01 0.51 ± 0.10● Copyright © 2013 SciRes. OPEN ACCESS  J. Tseng-Crank et al. / Open Journal of Genetics 3 (2013) 9-86 Copyright © 2013 SciRes. 13 OPEN ACCESS Continued ACACB ACC2, acetyl-Coenzyme A carboxylase beta +2.24 +1.04 −2.15 ADIPOQ Adiponectin +1.15 −1.03 −1.18 1.00 ± 0.120.63 ± 0.15 1.01 ± 0.17 ALDOB Aldolase B, fructose bisphosphate +2.74 −2.76 −7.57 1.00 ± 0.100.006 ± 0.003 0.016 ± 0.004● CPT1A Carnitine palmitoyltransferase 1A (liver) +1.05 +1.49 +1.42 FABP4 Fatty acid binding protein 4 +3.41 −1.19 −4.05 1.00 ± 0.031.21 ± 0.26 1.41 ± 0.29 FASN Fatty acid synthase +1.14 −1.39 −1.59 1.00 ± 0.020.54 ± 0.13 0.64 ± 0.14 ● LEP Leptin −1.17 +1.59 +1.511.05 ± 0.362.84 ± 0.13 1.77 ± 0.15 ● PEPCK1 PCK1, Phosphoenolpyruvate carboxykinase 1 +4.57 +1.13 −4.69 1.00 ± 0.060.25 ± 0.11 1.46 ± 0.11 ● SLC27A1 FATP1, fatty acid transporter +1.76 +1.54 −1.14 UCP2 Uncoupling protein 2 −1.45 +1.79 +2.581.03 ± 0.291.78 ± 0.18 1.49 ± 0.22 ● Nuclear Receptors AR Androgen receptor +1.82 −1.36 −2.48 ESR1 Estrogen receptor 1 +1.43 −1.47 −2.10 NR3C1 Glucocorticoid receptor +3.97 −1.46 −2.721.02 ± 0.210.60 ± 0.04 0.98 ± 0.29 ● NCOR1 Nuclear receptor co-repressor 1 +1.82 −1.51 −2.19 THRA Throid hormone receptor alpha +1.41 −1.47 −2.07 PGC1A PPARγ coactivator 1A +1.16 −1.37 −1.77 PGC1B PPARγ coactivator 1B +1.14 −1.70 −1.68 PPARγ Peroxisome proliferator-activated receptor +1.18 −1.43 −1.68 1.00 ± 0.080.68 ± 0.14 0.80 ± 0.13 ● Immunity/inflammation CCL3 Chemokine (C-C motif) ligand 3 −2.49 +2.84 +7.07 CCL13 Chemokine (C-C motif) ligand 13 −2.69 +3.21 +8.63 CERK Ceramide kinase −1.40 +1.61 +2.25 CXCL3 Chemokine (C-X-C motif) ligand 3 +1.04 +2.68 +2.57 CXCR4 Chemokine (C-X-C motif) ligand 4 −1.32 +1.74 +2.29 FOS v-fos FBJ viral oncogen homolog −2.13 +1.65 +3.51 IL1R2 Interleukin 1 receptor, type II −2.74 +1.24 +3.38 IL1RN Interleukin 1 receptor antagonist −3.49 +9.85 +24.08 SPHK1 Sphingosine kinase 1 −2.25 +1.59 +3.58 FUP: Fat tissues from UP780 treated DIO mice. FV: Fat tissues from high fat diet, HFD, treated DIO mice. FC: Fat tissues from lean control mice. found in lipid biosynthesis (Figure 1). First, the fatty acid biosynthesis depends on two major cytoplasmic enzymes, acetyl-CoA carboxylase (ACC1) and fatty acid synthase (FASN). Both ACC1 and FASN were decreased by UP780 (Table 1 and Figure 1). Second, the pentose phosphate pathway, which produces NADPH for fatty acid biosynthesis, was also down-regulated by UP780 (Supplement Table 1). Third, fatty acid desaturases (SCD1 and FADS1/2) and fatty acid elongases (ELOV5/ 6) were decreased by UP780, strongly supporting the mechanism that UP780 decreased liver fatty acid and tri- glyceride biosyntheses (Table 1 and Figure 1). Free fatty acid infusion in human induced systemic insulin resis- tance [26], UP780 could enhance systemic insulin sen- sitivity by a reduced lipotoxicity, resulting in enhanced blood glucose control. Pathway analysis also suggested a cholesterol lower- ing effect by UP780, by 1) decreasing the rate-limiting enzyme HMG-CoA reductase (HMGCR) for cholesterol biosynthesis, 2) increasing the bile acid biosynthesis en- zymes CYP7A1 and CYP7B1 for increased elimination of cholesterol through gut, and 3) decreasing apolipo- protein B for decreased LDL level (Table 1 and Figure 1).  J. Tseng-Crank et al. / Open Journal of Genetics 3 (2013) 9-86 14 Figure 1. Liver metabolism modulated by UP780 over high fat diet. A schematic diagram is constructed to illustrate the influences exerted by UP780 to the metabolism of carbohy- drates and lipids in liver. Increased mitochondrial β-oxidation is a prominent mechanism of glycemic control [27]. The rate-limiting enzyme for mitochondrial fatty acid β-oxidation, car- nitine palmitoyl transferase 1A (CPT1A), was decreased from HFD-elevated level (2-fold) by UP780 to lean con- trol level, suggesting decreased β-oxidation. CPT1A ac- tivity is regulated by the feedback metabolite malonyl- CoA. Malonyl-CoA concentration in mitochondria de- pends on the mitochondrial ACC2. ACC2 expression in UP780 liver was ~3-fold lower than in HFD, suggest- ing increased β-oxidation (Table 1). The overall activity of fatty acid β-oxidation in liver might well be increased; a mechanism that will support a role of UP780 in better lipid metabolism control but will need further study (Ta- ble 1 and Figure 1). Microarray analysis of WAT gene expression offered a clear explanation for the insulin sensitizing effect by UP780. Key genes in the insulin receptor signaling path- way were globally decreased by HFD and globally in- creased by UP780 (Table 2 and Supplement Figure 6). Among these key genes, insulin receptor (INSR), IRS-1, and glucose transporter 4 (GLUT4) were validated by QPCR (Table 2). With DIO mouse model, HFD feeding was known to induce insulin resistance [12]. Insulin ac- tivates INSR tyrosine kinase, which by phosphorylation of the IRS proteins, transduces insulin signal through protein kinases to the translocation of GLUTs to plasma membrane, thereafter increases glucose uptake. This in- creased glucose uptake from blood in WAT increases the usage of glucose for lipid biosynthesis and energy stor- age [28]. Lowered plasma glucose enhances systemic in- sulin sensitivity. The concerted down-regulation of in- sulin signaling pathway by HFD and opposing upre- gu- lation by UP780 strongly pointed to a reversal of in- su- lin-resistance as an important mechanism underlying the UP780 normalization of glycemic control and insulin sensitivity. Two more categories in WAT gene list were regulated similarly to the insulin receptor pathway: those involved in metabolism and nuclear receptor/co-activator/co-rep- ressor. Again, multiple gene expression variations were confirmed by QPCR (Table 2). Of note was adiponectin (ADIPOQ) gene expression, reduced by HFD and re- stored to control level by UP780 (Table 2 QPCR). HFD is also known to induce adipose tissue inflamma- tion and secretion of inflammatory cytokines such as TNF-α [29]. Many inflammatory genes were among the highest of up-regulated genes by HFD, with UP780 re- ducing these gene expressions (Table 2). Similarly, many genes in the cell cycle pathway were up-regulated by HFD and decreased by UP780 (Table 2). 3.2. Functional Validation Quantification at mRNA levels, although powerful in ge- nerating a global pattern of UP780 mechanism of action, is limited in depicting protein levels. Western blotting therefore was used to validate at the protein level for liver FASN (Figure 2(a), upper). After normalization with β-actin loading control (Figure 2(a), lower) to lean con- trol = 1, HFD decreased FASN to 0.7, UP780 further decreased FASN to 0.5, and GW1929 to 0.6. Therefore liver FASN protein levels by Western blot correlated to microarray and QPCR data (Table 1 and Figure 2(a)). Figure 2. Western blotting for protein ex- pression levels modified by UP780. (A) Liver proteins were probed with a mouse mono- clonal anti-FASN antibody. A fulllength 270 kD FASN and a smaller 60 kD degradation fragment were reproducible in Western blots. The blot was re-probed with anti-α-actin anti- body for protein loading control. (B) WAT Wes- tern blot was probed for IRS-1 protein levels and re-probed for α-actin loading control. Three protein bands 132 kD and up were re- producibly observed. Positions of molecular weight markers are either shown in A or mar- ked in B at the left. Copyright © 2013 SciRes. OPEN ACCESS  J. Tseng-Crank et al. / Open Journal of Genetics 3 (2013) 9-86 15 For WAT, IRS-1 protein level in the insulin signaling pathway was validated by Western blot (Figure 2(b)) IRS-1 proteins were dramatically decreased by HFD, much more than the 42% reduction by QPCR (Figure 2(b) and Table 2). UP780 restored some of the IRS-1 proteins (Figure 2(b), upper). Quantification was not attempted even though β-actin loading control was avail- able (Figure 2(b), lower) due to background interfer- ence. Liver triglyceride and cholesterol levels were meas- ured from liver lipid extracts to validate the UP780 me- chanism of action. HFD increased liver triglyceride level 12-fold above lean control. UP780 treatment decreased liver triglyceride level to 60% of HFD (Figure 3(a)) with statistical significance of P = 0.029 by T-test. Liver cho- lesterol levels were not dramatically changed by HFD over lean control. HFD increased liver cholesterol 25% over lean control. In correlation to microarray pathway analysis, UP780 decreased liver cholesterol to 65% of HFD with statistical significance of P = 0.016 by T-test (Figure 3(b)). Morphology of hepatosteatosis was examined (Figure 4). In lean control liver, lipid droplet was not visible. Vast amount of lipid droplets (black arrowheads) were ob- served in HFD liver sections. The liver functional unit of liver parenchyma is centered around the central vein (in- dicated in Figure 4) with nutrient supply from hepatic artery and portal vein reaching first to the hepatocytes distal from the central vein [30]. It was clear from Fig- ure 4 that in HFD liver more lipid droplets and balloon- ing were observed in hepatocytes distal from central vein than proximal. Lipid droplets disappeared almost com- pletely in the UP780-treated livers. When observed, the number of lipid droplets per cell in UP780 livers was much lower than HFD. Lymphocytes (white arrowhead) 0.00 0.05 0.10 0.15 0.20 0.25 0.30 Lean HFD UP7 80 GW1929 0 2 4 6 8 10 12 Lean HFD UP780 GW1929 Trigly ceride (mg/mg protein) Cholesterol (g/mg protein) ** ** 0.00 0.05 0.10 0.15 0.20 0.25 0.30 Lean HFD UP7 80 GW1929 0 2 4 6 8 10 12 Lean HFD UP780 GW1929 Trigly ceride (mg/mg protein) Cholesterol (g/mg protein) 0.00 0.05 0.10 0.15 0.20 0.25 0.30 Lean HFD UP7 80 GW1929 0 2 4 6 8 10 12 Lean HFD UP780 GW1929 Trigly ceride (mg/mg protein) Cholesterol (g/mg protein) ** ** (a) (b) Figure 3. UP780 decreased liver triglyceride and cholesterol over HFD. Total lipids extracted from liver were used for (a) triglyceride and (b) cholesterol assays. Liver triglyceride and liver cholesterol were assayed in replicates and in dilutions, and independently multiple times. Representative assays were dis- played. *indicated T-test P value < 0.05 compared to HFD. Figure 4. Liver steatosis. Formalin-fixed liver thin sec- tions were stained with hematoxylin-eosin. Liver steatosis analyses were done for individual animals for each treat- ment group. Representative photomicrographs were shown. Black arrowheads, lipid droplets and ballooning. White ar- rowhead, inflammation. Central vein was indicated on the HFD liver, and existed in lean control and UP780 liver sections. Scale bars, 50 μm. infiltration into liver was observed in HFD liver, not in lean control liver, and infrequently in UP780 liver (not shown). Improvement of insulin sensitivity should be accom- panied by decreased fasting plasma insulin levels; there- fore fasting plasma insulin levels were measured for baseline, week-7 and week-10. In Figure 5, data were plotted by individual animals within the treatment groups. Lean control fasting plasma insulin levels were similarly low at baseline, week-7, and week-10. For HFD, week-7 showed higher fasting plasma insulin levels, but by week-10, two animals showed decreased fasting plasma insulin levels. After 18 weeks of high fat feeding, these two animals probably developed pancreatic islet degen- eration. GW1929 was as expected. For the UP780 group, plasma insulin levels were decreased by week-7, and trended to decrease further at week-10 (Figure 5). Two- way ANOVA statistical analysis indicated that UP780 significantly decreased fasting plasma insulin compared to HFD, with P = 0.05, and GW1929 with P = 4.67E-6. 4. DISCUSSION Microarray pathway analysis and validation indicated the mechanism of the UP780 effects in increasing insulin sensitivity and decreasing plasma glucose [18] by de- creasing liver fatty acid and triglyceride biosynthesis, increasing liver mitochondria fatty acid α-oxidation (pos- sibly), and increasing WAT insulin signaling pathway (therefore increasing insulin sensitivity). UP780 was discovered by high throughput screening of differentiated 3T3-L1 adipocytes that identified bo- tanic substances capable of increasing adiponectin secre- tio [18]. Adiponectin together with leptin, another adi- n Copyright © 2013 SciRes. OPEN ACCESS  J. Tseng-Crank et al. / Open Journal of Genetics 3 (2013) 9-86 Copyright © 2013 SciRes. 16 Figure 5. Fasting plasma insulin. Plasma insulin levels were plotted by individual animals per treatment groups of week-0, week-7 and week-10 plasma samples, using SigmaPlot. The animal numbers indicated were from experimental assignments. The treatment groups of lean control, HFD, UP780, and GW1929 were indicated in the plots. Each plasma sample was as- sayed in dilutions and in duplicates, and sometimes in repeats, therefore each data point con- tained >2 individual measurements. Statistical analysis was by 2-way ANOVA comparing UP780/GW groups to HFD group, with *indicate P ≤ 0.05 and **indicated P ≤ 0.01. pokine, in an insulin-resistant lipoatrophic mouse model completely reversed insulin resistance, but only partially by adiponectin or leptin alone [31]. In obese and diabetic rodents and humans, adiponectin levels were decreased, which were reversed with weight loss and diabetic treat- ments [31]. Adiponectin, together with adiponectin re- ceptors AdipoR1 and AdipoR2, sensitizes tissues to in- sulin through regulation of glucose and fatty acid me- tabolism, activation of AMP-activated protein kinase (AMPK), activation of PPARα signaling pathway, and conversion of the toxic ceramide to beneficial sphin- gosine through a ceramidase domain in AdipoR1/2 [32, 33]. This UP780 nutrigenomic study was successful in demonstrating decreased liver fatty acid biosynthesis and increased WAT insulin sensitivity, in line with adipo- nectin mechanism. Activation of AMPK by aloe, further- more, was demonstrated by western blots of AMPK phosphorylation in WAT of DIO model [34]. Increased adiponectin gene expression in WAT by UP780 (Table 2) correlated with its discovery by screening. Multiple animal/human studies agreed on the hypo- glycemic effect of aloe [5,13-17,19,35-39] but not the li- pid-lowering effects. A double-blind, placebo-controll- ed pilot clinic trial by Devaraj et al. showed significant cholesterol/LDL reduction by Qmatrix® but not trigly- ceride, while UP780 caused no change to either blood triglyceride or cholesterol level [19]. Clinic trial by Hu- seini et al. claimed that aloe gel reduced both blood cho- lesterol and triglyceride, but the conclusion should be dismissed due to faulty statistical data analysis [38]. Cli- nic trial by Yagi et al. showed reduced blood triglyce- ride, but not cholesterol, by a high molecular weight fra- ction of Aloe vera gel. The Yagi study was not blinded and was without placebo control [39]. The Yongchai- yudha et al./Bunyapraphatsara et al. clinic studies of Aloe vera juice also showed reduced blood triglyceride, but not cholesterol; the studies were single-blinded and pla- cebo-controlled [36,37]. OPEN ACCESS  J. Tseng-Crank et al. / Open Journal of Genetics 3 (2013) 9-86 17 In UP780 DIO studies [18], blood triglyceride levels could be significantly reduced in one experiment but not another, including the experiment that livers were col- lected for triglyceride and cholesterol assays (Figure 3) and for liver steatosis photomicrography (Figure 4). Such was the variation observed for animal DIO model where diet was strictly controlled. Fasting blood trigly- ceride and cholesterol levels are influenced by diet and additional environmental factors, which is difficult to control in clinic trials. Compounded with the variations in aloe preparations and the human genomes, modifica- tion of Aloe vera gel to blood lipid levels may have too much variation to be detected reliably. Perhaps, future clinic studies of Aloe vera gel effect to liver steatosis will achieve more uniform results. 5. ACKNOWLEDGEMENTS The authors thank Mr. William Lee, the owner of Unigen, Inc., who supported the research. The authors thank Dr. Cannon for critical read- ing of this manuscript. The authors thank Dr. Yuan Zhao, Ms. Julia Foo, and Ms. Mei Hong for the screening of Unigen plant extract library. REFERENCES [1] CDC (2011) National diabetes factsheet. http://www.cdc.gov/diabetes/pubs/factsheet11.htm [2] WHO (2011) Diabetes: Fact sheet. http://www.who.int/mediacentre/factsheets/fs312/en/inde x.html [3] Reaven, G.M. (1988) Banting lecture 1988. Role of insu- lin resistance in human disease. Diabetes, 37, 1595-1607. doi:10.2337/diabetes.37.12.1595 [4] Kahn, S.E., Hull, R.L. and Utzschneider, K.M. (2006) Me- chanisms linking obesity to insulin resistance and type 2 diabetes. Nature, 444, 840-846. doi:10.1038/nature05482 [5] Kim, K., Kim, H., Kwon, J., Lee, S., Kong, H., Im, S.A., Lee, Y.H., Lee, Y.R., Oh, S.T., Jo, T.H., Park, Y.I. and Lee, C.K. (2009) Hypoglycemic and hypolipidemic effects of processed Aloe vera gel in a mouse model of non-insu- lin-dependent diabetes mellitus. Phytomedicine, 16, 856- 863. doi:10.1016/j.phymed.2009.02.014 [6] Zhang, X., Zhao, Y., Zhang, M., Pang, X., Xu, J., Kang, C., Li, M., Zhang, C., Zhang, Z., Zhang, Y., Li, X., Ning, G. and Zhao, L. (2012) Structural changes of gut micro- biota during berberine-mediated prevention of obesity and insulin resistance in high-fat diet-fed rats. PLoS One, 7, e42529. doi:10.1371/journal.pone.0042529 [7] Zhao, H.L, Sui, Y., Qiao, C.F., Yip, K.Y., Leung, R.K., Tsui, S.K., Lee, H.M., Wong, H.K., Zhu, X., Siu, J.J., He, L., Guan, J., Liu, L.Z., Xu, H.X., Tong, P.C. and Chan, J.C. (2012) Sustained antidiabetic effects of a berberi- ne-containing Chinese herbal medicine through regula- tion of hepatic gene expression. Diabetes, 61, 933-943. doi:10.2337/db11-1164 [8] Chen, Q., Chan, L.L. and Li, E.T. (2003) Bitter melon (Momordica charantia) reduces adiposity, lowers serum insulin and normalizes glucose tolerance in rats fed a high fat diet. Journal of Nutrition, 133, 1088-1093. [9] Xiong, Y., Shen, L., Liu, K.J., Tso, P., Wang, G., Woods, S.C. and Liu, M. (2010) Antiobesity and antihyperglyce- mic effects of ginsenoside Rb1 in rats. Diabetes, 59, 2505-2512. doi:10.2337/db10-0315 [10] Liu, D., Zhen, W., Yang, Z., Carter, J.D., Si, H. and Rey- nolds, K.A. (2006) Genistein acutely stimulates insulin secretion in pancreatic beta-cells through a cAMP-de- pendent protein kinase pathway. Diabetes, 55, 1043- 1050. doi:10.2337/diabetes.55.04.06.db05-1089 [11] Dugoua, J.J., Seely, D., Perri, D., Cooley, K., Forelli, T., Mills, E. and Koren, G. (2007) From type 2 diabetes to antioxidant activity: A systematic review of the safety and efficacy of common and cassia cinnamon bark. Canadian Journal of Physiology and Pharmacology, 85, 837-847. doi:10.1139/Y07-080 [12] Baur, J.A., Pearson, K.J., Price, N.L., Jamieson, H.A., Le- rin, C., Kalra, A, Prabhu, V.V., Allard, J.S., Lopez-Lluch, G., Lewis, K., Pistell, P.J., Poosala, S., Becker, K.G., Boss, O., Gwinn, D., Wang, M., Ramaswamy, S., Fishbein, K.W., Spencer, R.G., Lakatta, E.G., Le Couteur, D., Shaw, R.J., Navas, P., Puigserver, P., Ingram, D.K., de Cabo, R. and Sinclair, D.A. (2006) Resveratrol improves health and survival of mice on a high-calorie diet. Nature, 444, 337-342. doi:10.1038/nature05354 [13] Ajabnoor, M.A. (1990) Effect of aloes on blood glucose levels in normal and alloxan diabetic mice. Journal of Ethnopharmacology, 28, 215-220. doi:10.1016/0378-8741(90)90031-N [14] Ghannam, N., Kingston, M., Al-Meshaal, I.A., Tariq, M., Parman, N.S. and Woodhouse, N. (1986) The antidiabetic activity of aloes: Preliminary clinical and experimental ob- servations. Hormone Research, 24, 288-294. doi:10.1159/000180569 [15] Chacko, S., Sabatha, T. and Kuttan, R. (2008) Ameliora- tion of alloxan-induced hyperglycemia by Aloe arbore- scens Miller and its possible mechanism. Pharmacolo- gyonline, 2, 112-125. [16] Can, A., Akev, N., Ozsoy, N., Bolkent, S., Arda, B.P., Ya- nardag, R. and Okyar, A. (2004) Effect of Aloe vera leaf gel and pulp extracts on the liver in type-II diabetic rat models. Biological & Pharmaceutical Bulletin, 27, 694- 698. doi:10.1248/bpb.27.694 [17] Rajasekaran, S., Sivagnanam, K., Ravi, K. and Subrama- nian, S. (2004) Hypoglycemic effect of Aloe vera gel on streptozotocin-induced diabetes in experimental rats. Jour- nal of Medicinal Food, 7, 61-66. doi:10.1089/109662004322984725 [18] Yimam, M., Zhao, J., Corneliusen, B., Pantier, M., Brow- nell, L. and Jia, Q. (2013) UP780, a chromone enriched Aloe composition, improves insulin sensitivity. Metabolic Syndrome and Related Disorders, 10, 319-386. doi:10.1089/met.2012.0135 [19] Devaraj, S., Yimam, M., Brownell, L., Jialal, I., Singh, S. and Jia, Q. (2012) Effects of aloe vera supplementation in subjects with pre-diabetes/metabolic syndrome. Metabo- lic Syndrome and Related Disorders, 10, 319-386. [20] Rajasekaran, S., Ravi, K., Sivagnanam, K. and Subrama- Copyright © 2013 SciRes. OPEN ACCESS  J. Tseng-Crank et al. / Open Journal of Genetics 3 (2013) 9-86 Copyright © 2013 SciRes. 18 OPEN ACCESS nian, S. (2006) Beneficial effects of aloe vera leaf gel ex- tract on lipid profile status in rats with streptozotocin di- abetes. Clinical and Experimental Pharmacology and Phy- siology, 33, 232-237. doi:10.1111/j.1440-1681.2006.04351.x [21] Tanaka, M., Misawa, E., Ito, Y., Habara, N., Nomaguchi, K., Yamada, M., Toida, T., Hayasawa, H., Takase, M., Ina- gaki, M. and Higuchi, R. (2006) Identification of five phytosterols from Aloe vera gel as anti-diabetic com- pounds. Biological & Pharmaceutical Bulletin, 29, 1418- 1422. doi:10.1248/bpb.29.1418 [22] Hamman, J.H. (2008) Composition and applications of Aloe vera leaf gel. Molecules, 13, 1599-1616. doi:10.3390/molecules13081599 [23] Berger, J. and Moller, D.E. (2002) The mechanisms of action of PPARs. Annual Review of Medicine, 53, 409- 435. doi:10.1146/annurev.med.53.082901.104018 [24] OMIM’: Online mendelian inheritance in Man®. http://omim.org/ [25] Ingenuity pathway analysis. http://www.ingenuity.com/ [26] Shulman, G.I. (2004) Unraveling the cellular mechanism of insulin resistance in humans: New insights from mag- netic resonance spectroscopy. Physiology (Bet hesda), 19, 183-190. doi:10.1152/physiol.00007.2004 [27] Le Gouill, E., Jimenez, M., Binnert, C., Jayet, P.Y., Thal- mann, S., Nicod, P., Scherrer, U. and Vollenweider, P. (2007) Endothelial nitric oxide synthase (eNOS) knock- out mice have defective mitochondrial beta-oxidation. Di- abetes, 56, 2690-2696. doi:10.2337/db06-1228 [28] Saltiel, A.R. and Kahn, C.R. (2001) Insulin signalling and the regulation of glucose and lipid metabolism. Nature, 414, 799-806. doi:10.1038/414799a [29] Powell, K. (2007) Obesity: The two faces of fat. Nature, 447, 525-527. doi:10.1038/447525a [30] Anderson, N. and Borlak, J. (2008) Molecular mechani- sms and therapeutic targets in steatosis and steatohepatitis. Pharmacological Reviews, 60, 311-357. doi:10.1124/pr.108.00001 [31] Kadowaki, T. and Yamauchi, T. (2005) Adiponectin and adiponectin receptors. Endocrine Reviews, 26, 439-451. doi:10.1210/er.2005-0005 [32] Hardie, D.G. (2004) The AMP-activated protein kinase pathway—New players upstream and downstream. Jour- nal of Cell Science, 117, 5479-5487. doi:10.1242/jcs.01540 [33] Holland, W.L., Miller, R.A., Wang, Z.V., Sun, K., Barth, B.M., Bui, H.H., Davis, K.E., Bikman, B.T., Halberg, N., Rutkowski, J.M., Wade, M.R., Tenorio, V.M., Kuo, M.S, Brozinick, J.T., Zhang, B.B., Birnbaum, M.J., Summers, S.A. and Scherer, P.E. (2011) Receptor-mediated activa- tion of ceramidase activity initiates the pleiotropic actions of adiponectin. Nature Medicine, 17, 55-63. doi:10.1038/nm.2277 [34] Shin, E., Shin, S., Kong, H., Lee, S., Do, S.G., Jo, T.H., Park, Y.I., Lee, C.K., Hwang, I.K. and Kim, K. (2011) Di- etary aloe reduces adipogenesis via the activation of AMPK and suppresses obesity-related inflammation in obese mice. Immune Netw, 11, 107-113. doi:10.4110/in.2011.11.2.107 [35] Ngo, M.Q., Nguyen, N.N. and Shah, S.A. (2010) Oral aloe vera for treatment of diabetes mellitus and dyslipi- demia. American Journal of Health-System Pharmacy, 67, 1804-1808. [36] Yongchaiyudha, S., Rungpitarangsi, V., Bunyapraphatsara, N. and Chokechaijaroenporn, O. (1996) Antidiabetic acti- vity of aloe vera L. juice. I. Clinical trial in new cases of diabetes mellitus. Phytomedicine, 3, 241-243. doi:10.1016/S0944-7113(96)80060-2 [37] Bunyapraphatsara, N., Yongchaiyudha, S., Rungpitarang- si, V. and Chokechaijaroenporn, O. (1996) Antidiabetic activity of Aloe vera L. juice. II. Clinical trial in diabetes mellitus patients in combination with glibenclamide. Phy- tomedicine, 3, 245-248. doi:10.1016/S0944-7113(96)80061-4 [38] Huseini, H.F., Kianbakht, S., Hajiaghaee, R. and Dabag- hian, F.H. (2011) Anti-hyperglycemic and anti-hypercho- lesterolemic effects of Aloe vera leaf gel in hyperlipi- demic type 2 diabetic patients: A randomized double- blind placebo-controlled clinical trial. Planta Medica, 78, 311-316. doi:10.1055/s-0031-1280474 [39] Yagi, A., Hegazy, S., Kabbash, A. and Abd-El Wahab, E. (2009) Possible hypoglycemic effect of aloe vera L. high molecular weight fractions on type 2 diabetic patients. Saudi Pharmaceutical Journal, 17, 209-215. doi:10.1016/j.jsps.2009.08.007  J. Tseng-Crank et al. / Open Journal of Genetics 3 (2013) 9-86 19 SUPPLEMENTAL MATERIALS 1. MATERIALS AND METHODS 1.1. Tissue Collection from Dio Mouse Model DIO mice were as described in the companion paper [1]. Lean, HFD, UP780, and GW1929 fasting blood samples were taken before treatment (baseline), during treatment (7 weeks), and at the time of euthanasia (10 weeks). Mice were anesthetized with CO2; liver and visceral WAT tissues were collected within 5 minutes of euthana- sia. For RNA isolation, 5 mm tissue strips were preserv- ed in RNALater (Ambion). For Western blots, triglyce- ride and cholesterol assays, tissues were snap frozen in liquid nitrogen and stored at −80˚C. For histology, one lobe of the livers were fixed in 10% formalin/phosphate buffered saline (SIGMA) and stored at 4˚C. Fixed livers were thin sectioned and stained with hematoxylin-eosin for microscopic observations. 1.2. RNA Extraction For total RNA extraction, RNEasy kit was used for total liver RNA extraction, and RNEasy for Fatty Tissue kit was used for WAT RNA extraction (Qiagen). RNA quail- ties were determined with glyoxal agarose gel electro- phoresis (Ambion). When genomic DNA was observed, a second extraction was carried out. 1.3. Microarray Affymetrix mouse genome 430 2.0 array was used for microarray analysis of liver and WAT gene expression. Microarray procedures followed the standard protocol of Affymetrix GeneChip one-cycle target preparation [2]. The mouse samples were coded LC, LV, and LUP for livers of lean-control, HFD, and UP780, respectively, and FC, FV, and FUP for WAT. Three mice per treatment group, 3 treatment groups, and 2 tissues, in total 18 mi- croarray chips were used. All microarray datasets passed quality controls, including GCOS [3] and Bioconductor package affy [4] (Supplement Figures 1 and 2). Details of microarray data analysis followed published proce- dures [5,6]. 1.4. Pathway Analysis Analysis of microarray data, in the range of 45,000 probe sets, benefited greatly from the Ingenuity pathway analy- sis (IPA) software to develop a sense of the biological significance. The microarray analysis results by Biocon- ductor of eBayes-adjusted p-values, log2 fold changes, and log2 expression values were uploaded into the IPA server. Cutoff criteria of p ≤ 0.05, log2 fold change ≥ 0.8, and log2 intensity ≥ 3.5 were applied. Furthermore, due to multiple probe sets per gene minimal p-value was set to resolve among multiple probe sets. IPA results of ca- nonical pathways were further analyzed in detail. Infor- mation of gene functions were from IPA and OMIM da- tabases [7,8]. 1.5. Real-Time QPCR Total RNAs in excess of the needs for microarray were LC1.CEL 68101214 -5 05 Median: 0.0144 IQR: 0.329 681012 14 -5 05 Median: -0.0601 IQR: 0.375 LC2 .CEL 681012 14 -5 05 Median: -0.0807 IQR: 0.34LC4.CEL p ot (a) Copyright © 2013 SciRes. OPEN ACCESS  J. Tseng-Crank et al. / Open Journal of Genetics 3 (2013) 9-86 20 LV1.CEL 6810 1214 -10 -505 Median: 0.0566 IQR: 0.322 681012 14 -10 -505 Median: 0.144 IQR: 0.342 LV2.CEL 681012 14 -10 -50510 Median: 0.0952 IQR: 0.342LV40.CEL MVA p lot (b) LUP214.CEL 6810 12 14 -505 10 Median: 0 IQR: 0.368 68101214 -505 10 M e dia n: -0 .1 8 6 IQR: 0.346 LUP215.CEL 68101214 -5 05 Median: -0.194 IQ R : 0 .3 2 9LUP25.CEL MVA plot (c) Supplement Figure 1. Microarray data quality control plots for the nine liver microarray chips. Probe level data/object (before gcrma, affy preprocessing of background subtrac- tion, normalization, and summarization of intensities) from the Bioconductor affy pack- age was used for quality control plots. MVA plots were used for assessing the three bio- logical replicates each for A. lean control (LC1, LC2, and LC4), B. HFD (LV1, LV2, and LV40), and C. HFD + UP780 (LUP25, LUP214, and LUP215) chips. The MVA plots of all pairwise comparisons were particularly useful in diagnosing problems in replicate sets of arrays. The plots indicated tight correlation among the replicate sets of arrays. Based on these quality control plots, the nine liver microarray chips were judged to be of good quality. Copyright © 2013 SciRes. OPEN ACCESS  J. Tseng-Crank et al. / Open Journal of Genetics 3 (2013) 9-86 21 FC1.CEL 6810 12 14 -10 -50510 Median: 0.125 IQR: 0.323 68101214 -505 10 Median: 0.117 IQR: 0.390 FC2.CEL 6810 12 14 -50510 Median: 0 IQR: 0 .4 3 1FC4.CEL MVA pl o t (a) FV1.CEL 6810 12 14 -10 -50510 Median: 0.173 IQR: 0.559 6810 1214 -10 -50510 Median: 0.189 IQR: 0.523 FV2.CEL 681012 14 -10 -50510 Median: 0.00394 IQR : 0 .34 4FV40.CEL MVA pl o t (b) Copyright © 2013 SciRes. OPEN ACCESS  J. Tseng-Crank et al. / Open Journal of Genetics 3 (2013) 9-86 Copyright © 2013 SciRes. 22 (c) Supplement Figure 2. Microarray data quality control plots for the nine WAT microarray chips. Probe level data/object from affy package (before gcrma preprocessing of back- ground subtraction, normalization, and summarization of intensities), the Bioconductor affy package was used for quality control plots. MVA plots were used for assessing the three biological replicates each for A. lean control (FC1, FC2, and FC4), B. HFD (FV1, FV2, and FV40), and C. HFD + UP780 (FUP25, FUP214, and FUP215) chips. The MVA plots of all pairwise comparisons were particularly useful in diagnosing problems in replicate sets of arrays. The plots indicated tight correlation among the replicate sets of arrays. Based on these quality control plots, the nine WAT microarray chips were judged to be of good qual- ity. combined for QPCR. Superscript III reverse transcriptase (Invitrogen) was used for cDNA synthesis. The ABI TaqMan Gene Expression assays for the selected genes were confirmed by RefSeq accession numbers before use, to ensure the sequences used by the Affymetrix mouse genome 430 2.0 array and the ABI TaqMan Gene Ex- pression assays were compatible. Thermal cycling and fluorescence detection was performed by an ABI 7700 Sequence Detector. The relative quantification method of ΔΔCT was used for data analysis. Most QPCR runs were multiplex reactions and each plate contained at least one control cDNA (the lean control) and each well contained the GAPDH internal control. Singleplex QPCR was used for abundant transcripts such as adiponectin with GAPDH controls in separate wells. QPCR reactions were run in triplicates and results expressed as mean ± S.D. 1.6. Western Blot Mouse liver and WAT were homogenized in RIPA buffer (50 mM Tris.HCl pH 7.4, 150 mM NaCl, 1% Triton X-100, 0.25% deoxycholate, supplemented with a prote- ase inhibitor cocktail (Roche) and a phosphatase inhibi- tor cocktail (Pierce)) and debris removed by centrifuga- tion at 5000 g for 5 min. Protein concentrations were determined by BCA protein assay (Pierce). Twenty five μg of liver proteins and 50 μg of WAT proteins were used per lane for 4% - 12% Bis-Tris gel electrophoresis (Invi- trogen). The proteins were electroporated onto PVDF OPEN ACCESS  J. Tseng-Crank et al. / Open Journal of Genetics 3 (2013) 9-86 23 membranes and immunoblotted: mouse monoclonal an- tibody specific for fatty acid synthase (FASN) at 1:1000 dilution, rabbit polyclonal antibody specific for insulin receptor substrate-1 (IRS-1) at 1:200 dilution, and secon- dary HRP-conjugated antibodies at 1:3000 dilution for anti- mouse IgG and 1:5000 dilution for anti-rabbit IgG (Santa Cruz); detected with ECL-Plus chemiluminescence solu- tion and ECL film (GE Healthcare). For quantification, ECL films were scanned and the band intensities analy- zed with NIH ImageJ software. 1.7. Liver Triglyceride and Cholesterol Assays Liver homogenates and protein BCA assay were as de- scribed for Western blot. Liver homogenates were mixed with two volumes of methanol and chloroform (1:3, by volume) and shook vigorously for 10 minutes, then cen- trifuged for 15 minutes at 14,000 rpm. The organic layers were transferred to clean tubes. Extraction was repeated and the two organic fractions combined. The organic frac- tions were dried under N2 gas, then resuspended in eth- anol. The extracted lipids were assayed in duplicate us- ing triglyceride assay kits (Cayman Chemicals and Sig- ma-Aldrich) and a cholesterol assay kit (Cayman Che- micals). Each assay plate included a standard curve (Cay- man Chemicals). Several dilutions for each sample were tested. The total liver triglyceride and cholesterol con- centrations were normalized by protein concentrations in the initial liver homogenates, and expressed as mean ± S.D. Statistical analysis used T-test. 1.8. Insulin ELISA Assay Plasma samples collected at baseline, week-7 and week- 10 of treatments were used for mouse insulin ELISA (Crystal Chem). A standard curve was included in every assay plate and all samples were assayed in duplicates. For assay results that fell outside the range of the stan- dard curves, ELISA assays were repeated with dilutions. SigmaPlot was used for standard curve-fitting (logistic 4-parameter) and X-Y conversion. Results were express- ed as mean ± S.D. Statistical analysis used 2-way ANOVA (SigmaStat). 2. RESULTS AND DISCUSSIONS 2.1. Microarray Data Analysis The nine-chip datasets from tissue samples (liver or WAT) were read-in together using the Bioconductor affy pack- age [5] as one object, so that the subsequent preprocess- ing steps could be conducted as one experiment. The pre- processing steps of background correction, normalization, and summarization of the expression values were carried out using the gcrma package, taking advantage of the background adjustment feature with probe GC-content sequence information [9]. The expression values gene- rated by gcrma were summarized as log2 transformed expression values. Statistical analyses for differential ex- pressions by Student’s T-test were calculated by using the linear model as implemented in the limma package [6]. Three contrasts, HFD + UP780 vs. HFD, HFD + UP780 vs. lean control, and HFD vs. lean control, were compu- ted using the lmfit function, followed by the eBayes func- tion to adjust the standard errors of the log2-fold changes for the 3 contrasts, or false discovery rate (FDR) [6]. The analysis results of adjusted p-values, log2 fold changes, and log2 expression values were uploaded to the Inge- nuity IPA [8] website for pathway analysis. Global views of gene expression variations influenced by HFD and by UP780 on top of HFD were extracted from the results of limma linear model fits [6]. In Sup- plement Figures 3(a) and (b), Venn diagrams show the number of significant gene expression variations scored by limma and the number of overlapping genes shared by the comparisons between lean control (LC and FC), HFD (LV and FV), and HFD+UP780 (LUP and FUP). The dis- tributions of up- or down-regulations are plotted in Sup- plement Figure 3(c) for liver and Supplement Figure 3(d) for WAT. Among the 729 LUP-LC significant genes, 425 were up-regulated and 304 were down regulated. Among the 661 LV-LC significant genes, 486 were up- regulated and 175 were down regulated (Supplement Fig- ure 3(c)). Apparently in liver, HFD tends to induce gene expression levels and UP780 tends to reduce gene ex- pression levels. This trend became clear when indivi- dual genes in significant metabolic and signaling path- ways were examined (Table 1 and Supplement Tables 1 and 2). From WAT far more genes were scored significant, and had larger fold-changes as compared to liver (Sup- plement Figure 3(c) and (d)). Among the 660 FUP-FC significant genes, 278 were up-regulated and 382 were down-regulated. Among the 2705 significant FV-FC genes, 1025 were up-regulated and 1680 were down-regulated (Supplement Figure 3(d)). The large gene number dif- ference between FUP-FC and FV-FC suggested that in WAT, HFD caused wide-spread and strong gene expres- sion regulations, and UP780 treatment decreased glob- ally these gene expression regulations to be closer to the lean control. 2.2. IPA Pathway Analysis The pathways were ranked by right-tailed Fisher’s exact test for the significance of changes between two con- trasts, taken into consideration 1) the number of genes that passed the cutoff and were also in the pathway, 2) Copyright © 2013 SciRes. OPEN ACCESS  J. Tseng-Crank et al. / Open Journal of Genetics 3 (2013) 9-86 Copyright © 2013 SciRes. 24 (a) (b) Gene Index 010000 20000 30000 40000 Log2 Fold-Change -4 -2 0 2 4 6 LV-LC LUP-LC LC-LC (c) Gene Index 010000 20000 30000 40000 Log2 Fold-Change -6 -4 -2 0 2 4 6 8 FV-FC FUP-FC FC-FC (b) Supplement Figure 3. Gene Expression variations by linear model fit. Significant gene expression varia- tions were data exported from limma linear model fit. Venn diagrams show the numbers of genes with dif- ferential expression from the three comparisons and the gene numbers of overlapping distribution be- tween and among the three comparisons, A liver, B WAT. The differentially expressed genes in individual comparisons of Venn diagrams were plotted to show the distribution of up- or down-regulated genes in- fluenced by HFD and by HFD + UP780, using the lean controls as the baseline, C liver, D WAT. Gene in- dex was numbered according to the gene-ID list of the Affymetrix mouse genome 430.2 chip. OPEN ACCESS 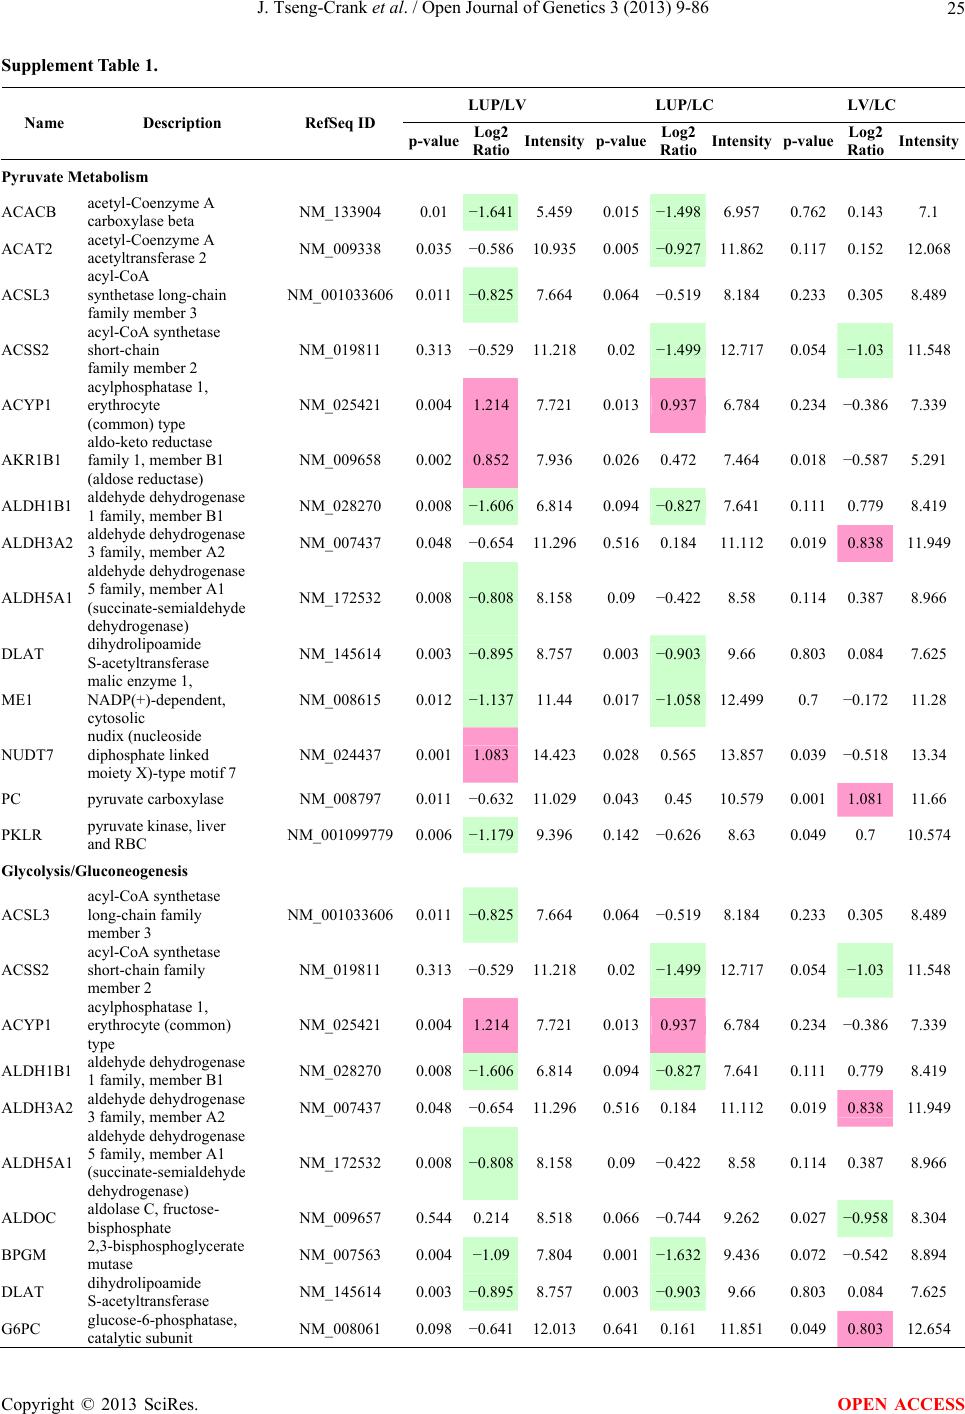 J. Tseng-Crank et al. / Open Journal of Genetics 3 (2013) 9-86 25 Supplement Table 1. LUP/LV LUP/LC LV/LC Name Description RefSeq ID p-value Log2 Ratio Intensity p-valueLog2 Ratio Intensity p-value Log2 Ratio Intensity Pyruvate Metabolism ACACB acetyl-Coenzyme A carboxylase beta NM_133904 0.01 −1.6415.459 0.015−1.4986.957 0.762 0.1437.1 ACAT2 acetyl-Coenzyme A acetyltransferase 2 NM_009338 0.035−0.58610.9350.005 −0.92711.862 0.117 0.15212.068 ACSL3 acyl-CoA synthetase long-chain family member 3 NM_0010336060.011 −0.8257.664 0.064−0.5198.184 0.233 0.3058.489 ACSS2 acyl-CoA synthetase short-chain family member 2 NM_019811 0.313−0.52911.2180.02 −1.49912.717 0.054 −1.0311.548 ACYP1 acylphosphatase 1, erythrocyte (common) type NM_025421 0.0041.2147.721 0.0130.9376.784 0.234 −0.3867.339 AKR1B1 aldo-keto reductase family 1, member B1 (aldose reductase) NM_009658 0.0020.8527.936 0.0260.4727.464 0.018 −0.5875.291 ALDH1B1 aldehyde dehydrogenase 1 family, member B1 NM_028270 0.008−1.6066.814 0.094−0.8277.641 0.111 0.7798.419 ALDH3A2 aldehyde dehydrogenase 3 family, member A2 NM_007437 0.048−0.65411.2960.5160.18411.112 0.019 0.838 11.949 ALDH5A1 aldehyde dehydrogenase 5 family, member A1 (succinate-semialdehyde dehydrogenase) NM_172532 0.008−0.8088.158 0.09 −0.4228.58 0.114 0.3878.966 DLAT dihydrolipoamide S-acetyltransferase NM_145614 0.003−0.8958.757 0.003−0.9039.66 0.803 0.0847.625 ME1 malic enzyme 1, NADP(+)-dependent, cytosolic NM_008615 0.012−1.13711.44 0.017−1.05812.499 0.7 −0.17211.28 NUDT7 nudix (nucleoside diphosphate linked moiety X)-type motif 7 NM_024437 0.0011.08314.423 0.0280.56513.857 0.039 −0.51813.34 PC pyruvate carboxylase NM_008797 0.011−0.63211.0290.0430.45 10.579 0.001 1.08111.66 PKLR pyruvate kinase, liver and RBC NM_0010997790.006 −1.1799.396 0.142−0.6268.63 0.049 0.7 10.574 Glycolysis/Gluconeogenesis ACSL3 acyl-CoA synthetase long-chain family member 3 NM_0010336060.011 −0.8257.664 0.064−0.5198.184 0.233 0.3058.489 ACSS2 acyl-CoA synthetase short-chain family member 2 NM_019811 0.313−0.52911.2180.02 −1.49912.717 0.054 −1.0311.548 ACYP1 acylphosphatase 1, erythrocyte (common) type NM_025421 0.0041.2147.721 0.0130.9376.784 0.234 −0.3867.339 ALDH1B1 aldehyde dehydrogenase 1 family, member B1 NM_028270 0.008−1.6066.814 0.094−0.8277.641 0.111 0.7798.419 ALDH3A2 aldehyde dehydrogenase 3 family, member A2 NM_007437 0.048−0.65411.2960.5160.18411.112 0.019 0.838 11.949 ALDH5A1 aldehyde dehydrogenase 5 family, member A1 (succinate-semialdehyde dehydrogenase) NM_172532 0.008−0.8088.158 0.09 −0.4228.58 0.114 0.3878.966 ALDOC aldolase C, fructose- bisphosphate NM_009657 0.5440.2148.518 0.066−0.7449.262 0.027 −0.9588.304 BPGM 2,3-bisphosphoglycerate mutase NM_007563 0.004−1.097.804 0.001−1.6329.436 0.072 −0.5428.894 DLAT dihydrolipoamide S-acetyltransferase NM_145614 0.003−0.8958.757 0.003−0.9039.66 0.803 0.0847.625 G6PC glucose-6-phosphatase, catalytic subunit NM_008061 0.098−0.64112.013 0.6410.16111.851 0.049 0.803 12.654 Copyright © 2013 SciRes. OPEN ACCESS 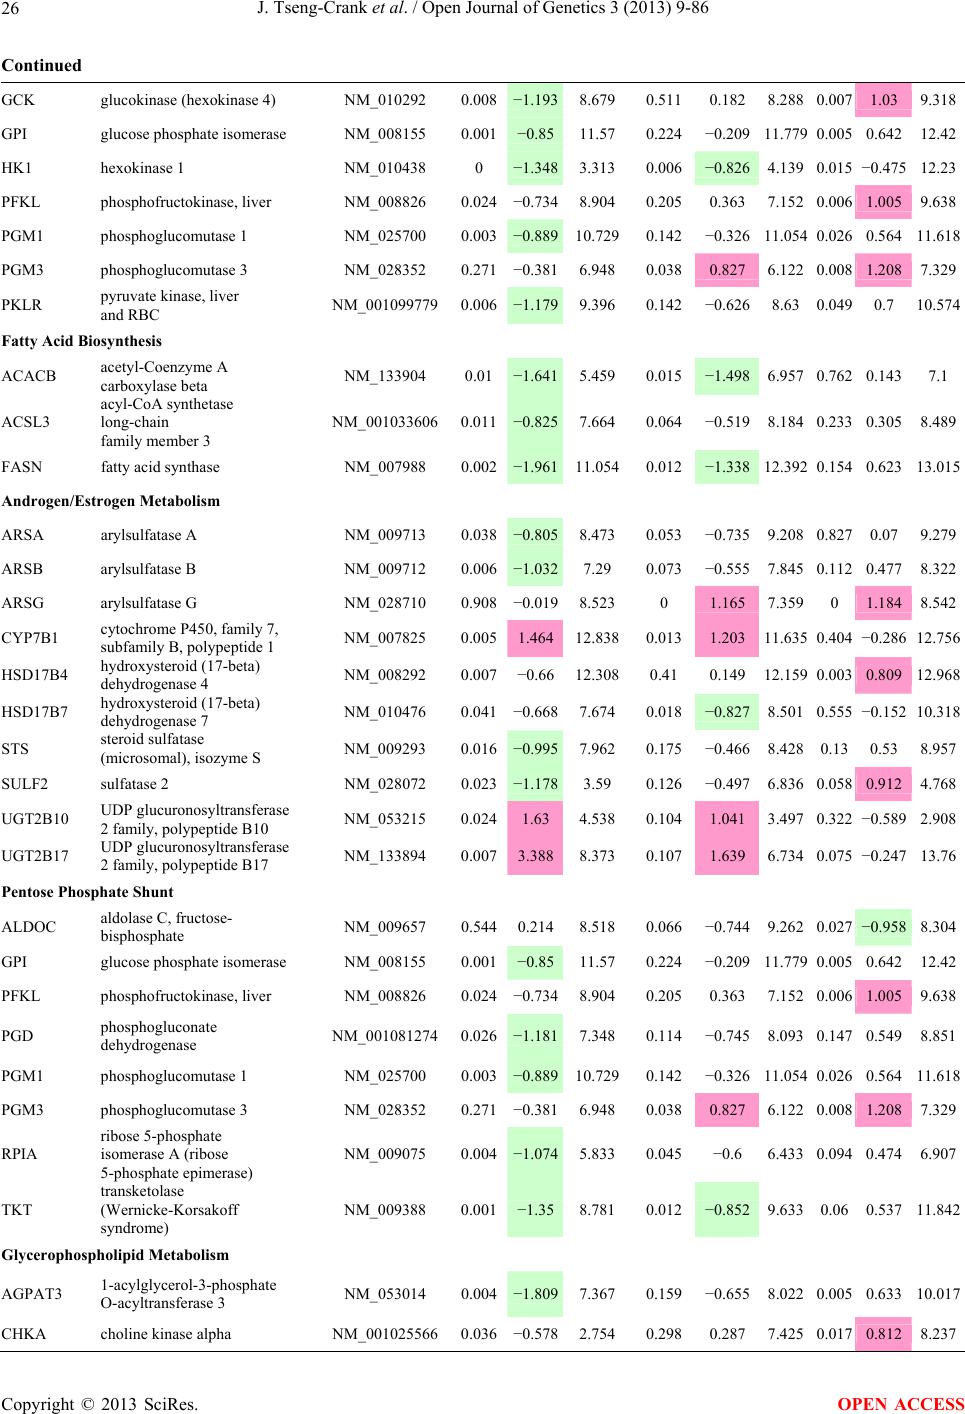 J. Tseng-Crank et al. / Open Journal of Genetics 3 (2013) 9-86 26 Continued GCK glucokinase (hexokinase 4) NM_010292 0.008−1.1938.679 0.5110.182 8.288 0.007 1.03 9.318 GPI glucose phosphate isomerase NM_008155 0.001−0.8511.57 0.224−0.209 11.779 0.005 0.64212.42 HK1 hexokinase 1 NM_010438 0 −1.3483.313 0.006−0.826 4.139 0.015 −0.475 12.23 PFKL phosphofructokinase, liver NM_008826 0.024−0.7348.904 0.2050.363 7.152 0.006 1.005 9.638 PGM1 phosphoglucomutase 1 NM_025700 0.003−0.889 10.7290.142−0.326 11.054 0.026 0.564 11.618 PGM3 phosphoglucomutase 3 NM_028352 0.271−0.3816.948 0.0380.827 6.122 0.008 1.208 7.329 PKLR pyruvate kinase, liver and RBC NM_0010997790.006 −1.1799.396 0.142−0.626 8.63 0.049 0.7 10.574 Fatty Acid Biosynthesis ACACB acetyl-Coenzyme A carboxylase beta NM_133904 0.01 −1.6415.459 0.015−1.498 6.957 0.762 0.1437.1 ACSL3 acyl-CoA synthetase long-chain family member 3 NM_0010336060.011 −0.8257.664 0.064−0.519 8.184 0.233 0.305 8.489 FASN fatty acid synthase NM_007988 0.002−1.961 11.0540.012−1.338 12.392 0.154 0.623 13.015 Androgen/Estrogen Metabolism ARSA arylsulfatase A NM_009713 0.038−0.8058.473 0.053−0.735 9.208 0.827 0.079.279 ARSB arylsulfatase B NM_009712 0.006−1.0327.29 0.073−0.555 7.845 0.112 0.477 8.322 ARSG arylsulfatase G NM_028710 0.908−0.0198.523 0 1.165 7.359 0 1.184 8.542 CYP7B1 cytochrome P450, family 7, subfamily B, polypeptide 1 NM_007825 0.0051.46412.8380.0131.203 11.635 0.404 −0.286 12.756 HSD17B4 hydroxysteroid (17-beta) dehydrogenase 4 NM_008292 0.007−0.6612.3080.41 0.149 12.159 0.003 0.809 12.968 HSD17B7 hydroxysteroid (17-beta) dehydrogenase 7 NM_010476 0.041−0.6687.674 0.018−0.827 8.501 0.555 −0.152 10.318 STS steroid sulfatase (microsomal), isozyme S NM_009293 0.016−0.9957.962 0.175−0.466 8.428 0.13 0.538.957 SULF2 sulfatase 2 NM_028072 0.023−1.1783.59 0.126−0.497 6.836 0.058 0.912 4.768 UGT2B10 UDP glucuronosyltransferase 2 family, polypeptide B10 NM_053215 0.0241.634.538 0.1041.041 3.497 0.322 −0.5892.908 UGT2B17 UDP glucuronosyltransferase 2 family, polypeptide B17 NM_133894 0.0073.3888.373 0.1071.639 6.734 0.075 −0.247 13.76 Pentose Phosphate Shunt ALDOC aldolase C, fructose- bisphosphate NM_009657 0.5440.2148.518 0.066−0.744 9.262 0.027 −0.958 8.304 GPI glucose phosphate isomerase NM_008155 0.001−0.8511.57 0.224−0.209 11.779 0.005 0.64212.42 PFKL phosphofructokinase, liver NM_008826 0.024−0.7348.904 0.2050.363 7.152 0.006 1.005 9.638 PGD phosphogluconate dehydrogenase NM_0010812740.026−1.1817.348 0.114−0.745 8.093 0.147 0.5498.851 PGM1 phosphoglucomutase 1 NM_025700 0.003−0.889 10.7290.142−0.326 11.054 0.026 0.564 11.618 PGM3 phosphoglucomutase 3 NM_028352 0.271−0.3816.948 0.0380.827 6.122 0.008 1.208 7.329 RPIA ribose 5-phosphate isomerase A (ribose 5-phosphate epimerase) NM_009075 0.004−1.0745.833 0.045 −0.6 6.433 0.094 0.4746.907 TKT transketolase (Wernicke-Korsakoff syndrome) NM_009388 0.001−1.358.781 0.012−0.852 9.633 0.06 0.53711.842 Glycerophospholipid Metabolism AGPAT3 1-acylglycerol-3-phosphate O-acyltransferase 3 NM_053014 0.004−1.8097.367 0.159−0.655 8.022 0.005 0.63310.017 CHKA choline kinase alpha NM_0010255660.036−0.5782.754 0.2980.287 7.425 0.017 0.812 8.237 Copyright © 2013 SciRes. OPEN ACCESS 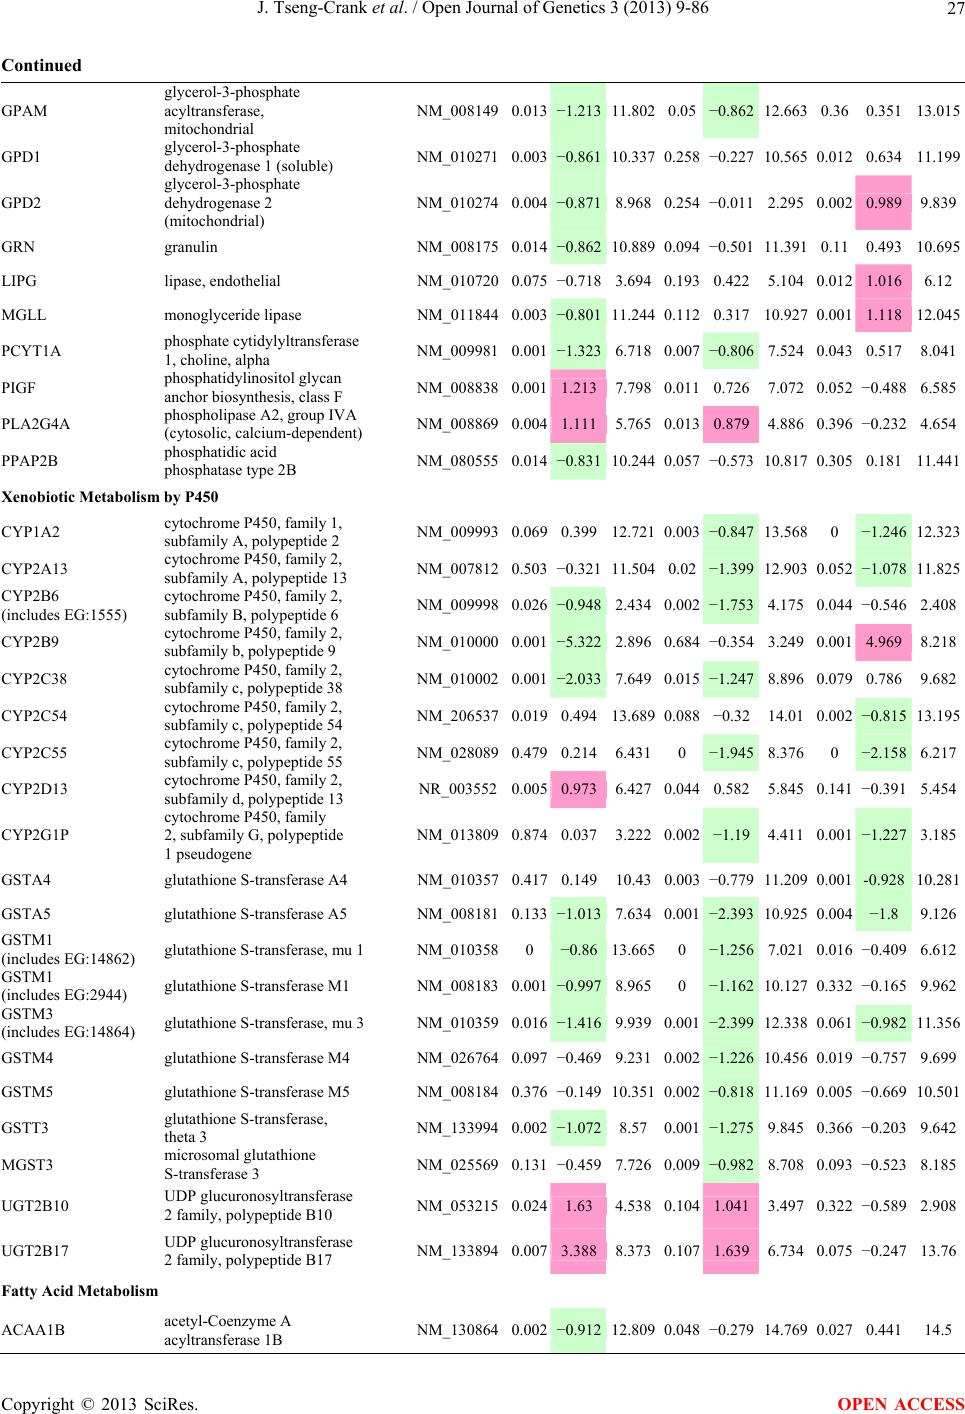 J. Tseng-Crank et al. / Open Journal of Genetics 3 (2013) 9-86 27 Continued GPAM glycerol-3-phosphate acyltransferase, mitochondrial NM_0081490.013 −1.21311.8020.05−0.862 12.663 0.36 0.35113.015 GPD1 glycerol-3-phosphate dehydrogenase 1 (soluble) NM_0102710.003 −0.861 10.337 0.258 −0.227 10.565 0.012 0.63411.199 GPD2 glycerol-3-phosphate dehydrogenase 2 (mitochondrial) NM_0102740.004 −0.8718.9680.254 −0.011 2.295 0.002 0.989 9.839 GRN granulin NM_0081750.014−0.862 10.889 0.094 −0.501 11.391 0.11 0.49310.695 LIPG lipase, endothelial NM_0107200.075−0.7183.6940.1930.422 5.104 0.012 1.016 6.12 MGLL monoglyceride lipase NM_0118440.003−0.80111.2440.1120.317 10.927 0.001 1.118 12.045 PCYT1A phosphate cytidylyltransferase 1, choline, alpha NM_0099810.001 −1.3236.7180.007 −0.806 7.524 0.043 0.5178.041 PIGF phosphatidylinositol glycan anchor biosynthesis, class F NM_008838 0.001 1.213 7.7980.0110.726 7.072 0.052 −0.488 6.585 PLA2G4A phospholipase A2, group IVA (cytosolic, calcium-dependent) NM_008869 0.004 1.1115.765 0.0130.879 4.886 0.396 −0.232 4.654 PPAP2B phosphatidic acid phosphatase type 2B NM_0805550.014 −0.831 10.244 0.057 −0.573 10.817 0.305 0.18111.441 Xenobiotic Metabolism by P450 CYP1A2 cytochrome P450, family 1, subfamily A, polypeptide 2 NM_0099930.0690.39912.721 0.003 −0.847 13.568 0 −1.246 12.323 CYP2A13 cytochrome P450, family 2, subfamily A, polypeptide 13 NM_0078120.503 −0.321 11.5040.02−1.399 12.903 0.052 −1.078 11.825 CYP2B6 (includes EG:1555) cytochrome P450, family 2, subfamily B, polypeptide 6 NM_0099980.026 −0.9482.4340.002 −1.753 4.175 0.044 −0.546 2.408 CYP2B9 cytochrome P450, family 2, subfamily b, polypeptide 9 NM_0100000.001 −5.3222.8960.684 −0.354 3.249 0.001 4.969 8.218 CYP2C38 cytochrome P450, family 2, subfamily c, polypeptide 38 NM_0100020.001 −2.0337.6490.015 −1.247 8.896 0.079 0.7869.682 CYP2C54 cytochrome P450, family 2, subfamily c, polypeptide 54 NM_2065370.0190.49413.689 0.088−0.32 14.01 0.002 −0.815 13.195 CYP2C55 cytochrome P450, family 2, subfamily c, polypeptide 55 NM_0280890.4790.2146.4310 −1.945 8.376 0 −2.158 6.217 CYP2D13 cytochrome P450, family 2, subfamily d, polypeptide 13 NR_0035520.005 0.973 6.4270.0440.582 5.845 0.141 −0.391 5.454 CYP2G1P cytochrome P450, family 2, subfamily G, polypeptide 1 pseudogene NM_013809 0.874 0.0373.222 0.002−1.19 4.411 0.001 −1.227 3.185 GSTA4 glutathione S-transferase A4 NM_0103570.4170.14910.430.003−0.779 11.209 0.001 -0.928 10.281 GSTA5 glutathione S-transferase A5 NM_0081810.133−1.0137.6340.001 −2.393 10.925 0.004 −1.8 9.126 GSTM1 (includes EG:14862) glutathione S-transferase, mu 1 NM_0103580 −0.8613.6650 −1.256 7.021 0.016 −0.409 6.612 GSTM1 (includes EG:2944) glutathione S-transferase M1 NM_0081830.001−0.9978.9650 −1.162 10.127 0.332 −0.1659.962 GSTM3 (includes EG:14864) glutathione S-transferase, mu 3 NM_0103590.016−1.4169.9390.001 −2.399 12.338 0.061 −0.98211.356 GSTM4 glutathione S-transferase M4 NM_0267640.097−0.4699.2310.002 −1.226 10.456 0.019 −0.757 9.699 GSTM5 glutathione S-transferase M5 NM_0081840.376−0.14910.351 0.002 −0.818 11.169 0.005 −0.66910.501 GSTT3 glutathione S-transferase, theta 3 NM_1339940.002 −1.0728.570.001−1.275 9.845 0.366 −0.203 9.642 MGST3 microsomal glutathione S-transferase 3 NM_0255690.131 −0.4597.7260.009 −0.982 8.708 0.093 −0.523 8.185 UGT2B10 UDP glucuronosyltransferase 2 family, polypeptide B10 NM_053215 0.0241.634.538 0.104 1.041 3.497 0.322 −0.589 2.908 UGT2B17 UDP glucuronosyltransferase 2 family, polypeptide B17 NM_133894 0.007 3.3888.373 0.107 1.639 6.734 0.075 −0.247 13.76 Fatty Acid Metabolism ACAA1B acetyl-Coenzyme A acyltransferase 1B NM_1308640.002 −0.91212.809 0.048 −0.279 14.769 0.027 0.44114.5 Copyright © 2013 SciRes. OPEN ACCESS 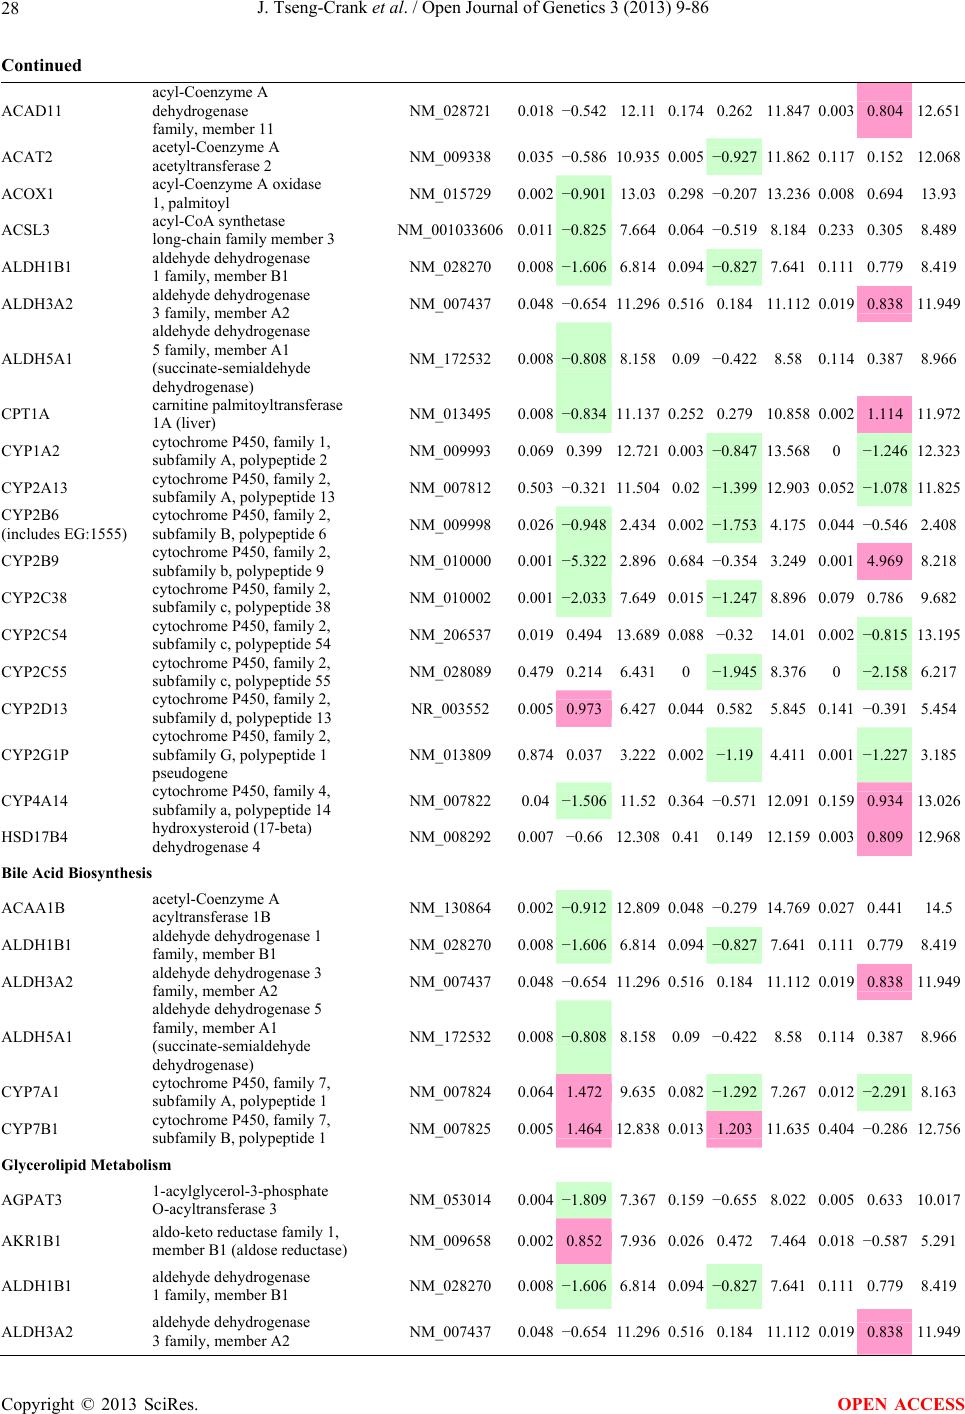 J. Tseng-Crank et al. / Open Journal of Genetics 3 (2013) 9-86 28 Continued ACAD11 acyl-Coenzyme A dehydrogenase family, member 11 NM_028721 0.018−0.54212.110.1740.262 11.847 0.003 0.80412.651 ACAT2 acetyl-Coenzyme A acetyltransferase 2 NM_009338 0.035−0.58610.935 0.005 −0.927 11.862 0.117 0.15212.068 ACOX1 acyl-Coenzyme A oxidase 1, palmitoyl NM_015729 0.002−0.90113.030.298−0.207 13.236 0.008 0.69413.93 ACSL3 acyl-CoA synthetase long-chain family member 3 NM_0010336060.011 −0.8257.6640.064 −0.519 8.184 0.233 0.3058.489 ALDH1B1 aldehyde dehydrogenase 1 family, member B1 NM_028270 0.008−1.6066.8140.094 −0.827 7.641 0.111 0.7798.419 ALDH3A2 aldehyde dehydrogenase 3 family, member A2 NM_007437 0.048−0.65411.2960.5160.184 11.112 0.019 0.838 11.949 ALDH5A1 aldehyde dehydrogenase 5 family, member A1 (succinate-semialdehyde dehydrogenase) NM_172532 0.008−0.808 8.1580.09 −0.422 8.58 0.114 0.387 8.966 CPT1A carnitine palmitoyltransferase 1A (liver) NM_013495 0.008−0.83411.1370.2520.279 10.858 0.002 1.11411.972 CYP1A2 cytochrome P450, family 1, subfamily A, polypeptide 2 NM_009993 0.0690.39912.7210.003−0.847 13.568 0 −1.246 12.323 CYP2A13 cytochrome P450, family 2, subfamily A, polypeptide 13 NM_007812 0.503−0.321 11.5040.02−1.399 12.903 0.052 −1.078 11.825 CYP2B6 (includes EG:1555) cytochrome P450, family 2, subfamily B, polypeptide 6 NM_009998 0.026−0.9482.4340.002 −1.753 4.175 0.044 −0.546 2.408 CYP2B9 cytochrome P450, family 2, subfamily b, polypeptide 9 NM_010000 0.001−5.3222.8960.684 −0.354 3.249 0.001 4.969 8.218 CYP2C38 cytochrome P450, family 2, subfamily c, polypeptide 38 NM_010002 0.001−2.0337.6490.015 −1.247 8.896 0.079 0.7869.682 CYP2C54 cytochrome P450, family 2, subfamily c, polypeptide 54 NM_206537 0.0190.49413.6890.088−0.32 14.01 0.002 −0.815 13.195 CYP2C55 cytochrome P450, family 2, subfamily c, polypeptide 55 NM_028089 0.4790.2146.431 0 −1.945 8.376 0 −2.158 6.217 CYP2D13 cytochrome P450, family 2, subfamily d, polypeptide 13 NR_003552 0.0050.973 6.4270.0440.582 5.845 0.141 −0.391 5.454 CYP2G1P cytochrome P450, family 2, subfamily G, polypeptide 1 pseudogene NM_013809 0.8740.0373.2220.002−1.19 4.411 0.001 −1.227 3.185 CYP4A14 cytochrome P450, family 4, subfamily a, polypeptide 14 NM_007822 0.04−1.50611.520.364 −0.571 12.091 0.159 0.934 13.026 HSD17B4 hydroxysteroid (17-beta) dehydrogenase 4 NM_008292 0.007−0.6612.3080.410.149 12.159 0.003 0.80912.968 Bile Acid Biosynthesis ACAA1B acetyl-Coenzyme A acyltransferase 1B NM_130864 0.002−0.91212.809 0.048 −0.279 14.769 0.027 0.44114.5 ALDH1B1 aldehyde dehydrogenase 1 family, member B1 NM_028270 0.008−1.6066.8140.094 −0.827 7.641 0.111 0.7798.419 ALDH3A2 aldehyde dehydrogenase 3 family, member A2 NM_007437 0.048−0.65411.2960.5160.184 11.112 0.019 0.83811.949 ALDH5A1 aldehyde dehydrogenase 5 family, member A1 (succinate-semialdehyde dehydrogenase) NM_172532 0.008−0.808 8.1580.09 −0.422 8.58 0.114 0.387 8.966 CYP7A1 cytochrome P450, family 7, subfamily A, polypeptide 1 NM_007824 0.0641.4729.6350.082 −1.292 7.267 0.012 −2.291 8.163 CYP7B1 cytochrome P450, family 7, subfamily B, polypeptide 1 NM_007825 0.0051.46412.838 0.0131.203 11.635 0.404 −0.28612.756 Glycerolipid Metabolism AGPAT3 1-acylglycerol-3-phosphate O-acyltransferase 3 NM_053014 0.004−1.8097.3670.159 −0.655 8.022 0.005 0.633 10.017 AKR1B1 aldo-keto reductase family 1, member B1 (aldose reductase) NM_009658 0.0020.852 7.9360.0260.472 7.464 0.018 −0.587 5.291 ALDH1B1 aldehyde dehydrogenase 1 family, member B1 NM_028270 0.008−1.6066.8140.094 −0.827 7.641 0.111 0.7798.419 ALDH3A2 aldehyde dehydrogenase 3 family, member A2 NM_007437 0.048−0.65411.2960.5160.184 11.112 0.019 0.838 11.949 Copyright © 2013 SciRes. OPEN ACCESS  J. Tseng-Crank et al. / Open Journal of Genetics 3 (2013) 9-86 29 Continued ALDH5A1 aldehyde dehydrogenase 5 family, member A1 (succinate-semialdehyde dehydrogenase) NM_172532 0.008−0.808 8.1580.09−0.422 8.58 0.114 0.387 8.966 GPAM glycerol-3-phosphate acyltransferase, mitochondrial NM_008149 0.013−1.213 11.8020.05−0.862 12.663 0.36 0.35113.015 LIPG lipase, endothelial NM_010720 0.075−0.7183.6940.1930.422 5.104 0.012 1.016 6.12 MGLL monoglyceride lipase NM_011844 0.003−0.80111.2440.1120.317 10.927 0.001 1.118 12.045 MOGAT1 monoacylglycerol O-acyltransferase 1 NM_026713 0.074−1.1783.0380.6540.259 2.779 0.038 1.438 4.217 PPAP2B phosphatidic acid phosphatase type 2B NM_080555 0.014−0.831 10.244 0.057 −0.573 10.817 0.305 0.18111.441 Aminosugar Metabolism CYB561 cytochrome b-561 NM_007805 0.036−0.6665.1220.2720.303 4.819 0.008 0.969 5.788 CYB5R3 cytochrome b5 reductase 3 NM_029787 0.009−0.809 11.9750.03−0.605 12.58 0.231 0.23513.42 GCK glucokinase (hexokinase 4) NM_010292 0.008−1.1938.6790.5110.182 8.288 0.007 1.03 9.318 GFPT1 glutamine-fructose-6- phosphate transaminase 1 NM_013528 0.024−0.8096.7240.2720.001 2.286 0.044 0.1692.533 HK1 hexokinase 1 NM_010438 0 −1.3483.3130.006 −0.826 4.139 0.015 −0.47512.23 NQO1 NAD(P)H dehydrogenase, quinone 1 NM_008706 0.064−0.8833.7050.035 −1.056 4.761 0.677 −0.172 4.589 PDE2A phosphodiesterase 2A, cGMP-stimulated NM_0010085480.001 −1.4264.7730.002 −1.319 6.092 0.653 0.1169.205 PDE4B phosphodiesterase 4B, cAMP-specific (phosphodiesterase E4 dunce homolog, Drosophila) NM_019840 0.004−0.9672.6810.254 −0.007 2.321 0.009 0.8083.647 PDE7B phosphodiesterase 7B NM_013875 0.002−0.826 5.3050.07 −0.349 5.655 0.023 0.4766.131 PGM3 phosphoglucomutase 3 NM_028352 0.271−0.381 6.9480.038 0.827 6.122 0.008 1.208 7.329 Sphingolipid Metabolism ARSA arylsulfatase A NM_009713 0.038−0.8058.4730.053 −0.735 9.208 0.827 0.079.279 ARSB arylsulfatase B NM_009712 0.006−1.0327.290.073 −0.555 7.845 0.112 0.4778.322 ARSG arylsulfatase G NM_028710 0.908−0.0198.5230 1.165 7.359 0 1.184 8.542 CYP26A1 cytochrome P450, family 26, subfamily A, polypeptide 1 NM_007811 0.022−1.991 5.192 0.001 −3.72 8.911 0.037 −1.729 7.183 PPAP2B phosphatidic acid phosphatase type 2B NM_080555 0.014−0.831 10.244 0.057 −0.573 10.817 0.305 0.18111.441 SULF2 sulfatase 2 NM_028072 0.023−1.1783.590.126 −0.497 6.836 0.058 0.912 4.768 VNN1 vanin 1 NM_011704 0.059−0.8829.3650.0860.764 10.887 0.004 1.658 10.247 Glutathione Metabolism ACSS2 acyl-CoA synthetase short-chain family member 2 NM_019811 0.313−0.529 11.2180.02−1.499 12.717 0.054 −1.03 11.548 GSTA4 glutathione S-transferase A4 NM_010357 0.4170.14910.430.003−0.779 11.209 0.001 −0.928 10.281 GSTA5 glutathione S-transferase A5 NM_008181 0.133−1.0137.6340.001 −2.393 10.925 0.004 −1.8 9.126 GSTM1 (includes EG:14862) glutathione S-transferase, mu 1 NM_010358 0 −0.8613.6650 −1.256 7.021 0.016 −0.4096.612 GSTM1 (includes EG:2944) glutathione S-transferase M1 NM_008183 0.001−0.9978.9650 −1.162 10.127 0.332 −0.165 9.962 GSTM3 (includes EG:14864) glutathione S-transferase, mu 3 NM_010359 0.016−1.4169.9390.001 −2.399 12.338 0.061 −0.982 11.356 Copyright © 2013 SciRes. OPEN ACCESS  J. Tseng-Crank et al. / Open Journal of Genetics 3 (2013) 9-86 30 Continued GSTM4 glutathione S-transferase M4 NM_026764 0.097−0.4699.2310.002−1.226 10.456 0.019 −0.757 9.699 GSTM5 glutathione S-transferase M5 NM_008184 0.376−0.149 10.3510.002 −0.818 11.169 0.005 −0.669 10.501 GSTT3 glutathione S-transferase, theta 3 NM_133994 0.002−1.0728.570.001 −1.275 9.845 0.366 −0.2039.642 MGST3 microsomal glutathione S-transferase 3 NM_025569 0.131−0.4597.7260.009 −0.982 8.708 0.093 −0.5238.185 PGD phosphogluconate dehydrogenase NM_0010812740.026 −1.1817.3480.114−0.745 8.093 0.147 0.5498.851 Biosynthesis of Steroid CYP26A1 cytochrome P450, family 26, subfamily A, polypeptide 1 NM_138656 0.022−1.9915.192 0.001 −3.72 8.911 0.037 −1.7297.183 CYP7B1 cytochrome P450, family 7, subfamily B, polypeptide 1 NM_007811 0.0051.46412.8380.0131.203 11.635 0.404 −0.286 12.756 DHCR7 7-dehydrocholesterol reductase NM_146006 0.085−0.6769.6890.022−1.006 10.694 0.289 0 2.285 FDPS farnesyl diphosphate synthase (farnesyl pyrophosphate synthetase, dimethylallyltranstransferase, geranyltranstransferase) NM_007825 0.072−0.476 11.3310.004 −0.996 12.327 0.055 −0.52 11.807 HMGCR 3-hydroxy-3-methylglutaryl- Coenzyme A reductase NM_134469 0.428−0.2546.790.007 −1.179 7.969 0.02 −0.925 7.044 IDI1 isopentenyl-diphosphate delta isomerase 1 NM_008706 0.140.56110.5190.226−0.446 10.965 0.022 −1.0079.958 LSS lanosterol synthase (2,3-oxidosqualene- lanosterol cyclase) NM_145360 0.4120.042.4690.023−1.037 6.498 0.04 −0.889 5.609 MVD mevalonate (diphospho) decarboxylase NM_008255 0.005−1.4316.1810.008 −1.329 7.51 0.776 0.102 7.613 NQO1 NAD(P)H dehydrogenase, quinone 1 NM_026784 0.064−0.8833.7050.035−1.056 4.761 0.677 −0.1724.589 PMVK phosphomevalonate kinase NM_007856 0.9410.0268.5980.041−0.87 9.467 0.037 −0.896 8.571 Tryptophan Metabolism ACAT2 acetyl-Coenzyme A acetyltransferase 2 NM_009338 0.035−0.586 10.9350.005 −0.927 11.862 0.117 0.15212.068 AFMID arylformamidase NM_027827 0.0080.5276.5360.001−0.78 8.825 0 −1.084 6.009 ALDH1B1 aldehyde dehydrogenase 1 family, member B1 NM_028270 0.008−1.6066.8140.094−0.827 7.641 0.111 0.7798.419 ALDH3A2 aldehyde dehydrogenase 3 family, member A2 NM_007437 0.048−0.65411.2960.5160.184 11.112 0.019 0.838 11.949 ALDH5A1 aldehyde dehydrogenase 5 family, member A1 (succinate-semialdehyde dehydrogenase) NM_172532 0.008−0.8088.1580.09 −0.422 8.58 0.114 0.387 8.966 CYP1A2 cytochrome P450, family 1, subfamily A, polypeptide 2 NM_009993 0.0690.39912.7210.003−0.847 13.568 0 −1.246 12.323 CYP2A13 cytochrome P450, family 2, subfamily A, polypeptide 13 NM_007812 0.503−0.32111.5040.02−1.399 12.903 0.052 −1.078 11.825 CYP2B6 (includes EG:1555) cytochrome P450, family 2, subfamily B, polypeptide 6 NM_009998 0.026−0.9482.4340.002 −1.753 4.175 0.044 −0.5462.408 CYP2B9 cytochrome P450, family 2, subfamily b, polypeptide 9 NM_010000 0.001−5.3222.8960.684 −0.354 3.249 0.001 4.969 8.218 CYP2C38 cytochrome P450, family 2, subfamily c, polypeptide 38 NM_010002 0.001−2.0337.6490.015 −1.247 8.896 0.079 0.7869.682 CYP2C54 cytochrome P450, family 2, subfamily c, polypeptide 54 NM_206537 0.0190.49413.6890.088−0.32 14.01 0.002 −0.815 13.195 CYP2C55 cytochrome P450, family 2, subfamily c, polypeptide 55 NM_028089 0.4790.2146.4310 −1.945 8.376 0 −2.1586.217 CYP2D13 cytochrome P450, family 2, subfamily d, polypeptide 13 NR_003552 0.0050.973 6.4270.0440.582 5.845 0.141 −0.3915.454 CYP2G1P cytochrome P450, family 2, subfamily G, polypeptide 1 pseudogene NM_013809 0.8740.0373.2220.002−1.19 4.411 0.001 −1.227 3.185 Copyright © 2013 SciRes. OPEN ACCESS  J. Tseng-Crank et al. / Open Journal of Genetics 3 (2013) 9-86 31 Continued CYP7B1 cytochrome P450, family 7, subfamily B, polypeptide 1 NM_007825 0.0051.46412.838 0.0131.203 11.635 0.404 −0.286 12.756 DHCR24 24-dehydrocholesterol reductase NM_053272 0.007−1.058 11.196 0.037 −0.704 11.9 0.231 0.35412.254 HSD17B4 hydroxysteroid (17-beta) dehydrogenase 4 NM_008292 0.007−0.6612.3080.410.149 12.159 0.003 0.809 12.968 NEDD4 neural precursor cell expressed, developmentally down-regulated 4 NM_010890 0.003−1.5867.5410.021 −1.061 8.602 0.127 0.433 11.085 SYVN1 synovial apoptosis inhibitor 1, synoviolin NM_028769 0.031−1.0768.0320.790.104 7.534 0.031 1.079 9.109 Linoleic Acid Metabolism CYP1A2 cytochrome P450, family 1, subfamily A, polypeptide 2 NM_009993 0.0690.39912.7210.003−0.847 13.568 0 −1.246 12.323 CYP2A13 cytochrome P450, family 2, subfamily A, polypeptide 13 NM_007812 0.503−0.321 11.5040.02−1.399 12.903 0.052 −1.07811.825 CYP2B6 (includes EG:1555) cytochrome P450, family 2, subfamily B, polypeptide 6 NM_009998 0.026−0.9482.4340.002 −1.753 4.175 0.044 −0.546 2.408 CYP2B9 cytochrome P450, family 2, subfamily b, polypeptide 9 NM_010000 0.001−5.3222.8960.684 −0.354 3.249 0.001 4.9698.218 CYP2C38 cytochrome P450, family 2, subfamily c, polypeptide 38 NM_010002 0.001−2.0337.6490.015 −1.247 8.896 0.079 0.7869.682 CYP2C54 cytochrome P450, family 2, subfamily c, polypeptide 54 NM_206537 0.0190.49413.6890.088−0.32 14.01 0.002 −0.815 13.195 CYP2C55 cytochrome P450, family 2, subfamily c, polypeptide 55 NM_028089 0.4790.2146.4310 −1.945 8.376 0 −2.158 6.217 CYP2D13 cytochrome P450, family 2, subfamily d, polypeptide 13 NR_003552 0.0050.973 6.4270.0440.582 5.845 0.141 −0.391 5.454 CYP2G1P cytochrome P450, family 2, subfamily G, polypeptide 1 pseudogene NM_013809 0.8740.0373.2220.002−1.19 4.411 0.001 −1.227 3.185 FADS1 fatty acid desaturase 1 NM_146094 0.005−0.92412.4360.106 −0.405 12.841 0.051 0.51913.36 FADS2 fatty acid desaturase 2 NM_019699 0.001−1.79810.5490.243 −0.399 10.947 0.002 1.482 11.893 GRN granulin NM_008175 0.014−0.86210.8890.094 −0.501 11.391 0.11 0.49310.695 PLA2G4A phospholipase A2, group IVA (cytosolic, calcium-dependent) NM_008869 0.0041.1115.765 0.013 0.879 4.886 0.396 -0.2324.654 Butanoate Metabolism AACS acetoacetyl-CoA synthetase NM_030210 0.007−1.2157.4160.002 −1.513 8.93 0.254 −0.082 2.284 ACAT2 acetyl-Coenzyme A acetyltransferase 2 NM_009338 0.035−0.58610.9350.005 −0.927 11.862 0.117 0.15212.068 ALDH1B1 aldehyde dehydrogenase 1 family, member B1 NM_028270 0.008−1.6066.8140.094 −0.827 7.641 0.111 0.7798.419 ALDH3A2 aldehyde dehydrogenase 3 family, member A2 NM_007437 0.048−0.65411.2960.5160.184 11.112 0.019 0.838 11.949 ALDH5A1 aldehyde dehydrogenase 5 family, member A1 (succinate-semialdehyde dehydrogenase) NM_172532 0.008−0.808 8.1580.09−0.422 8.58 0.114 0.387 8.966 BDH1 3-hydroxybutyrate dehydrogenase, type 1 NM_001122683/// NM_175177 0.008 −0.9511.4880.0240.646 7.796 0.001 1.1888.984 HSD17B4 hydroxysteroid (17-beta) dehydrogenase 4 NM_008292 0.007−0.6612.3080.410.149 12.159 0.003 0.809 12.968 Galactose Metabolism AKR1B1 aldo-keto reductase family 1, member B1 (aldose reductase) NM_009658 0.0020.852 7.9360.0260.472 7.464 0.018 −0.587 5.291 G6PC glucose-6-phosphatase, catalytic subunit NM_008061 0.098−0.64112.0130.6410.161 11.851 0.049 0.803 12.654 GCK glucokinase (hexokinase 4) NM_010292 0.008−1.1938.6790.5110.182 8.288 0.007 1.03 9.318 HK1 hexokinase 1 NM_010438 0 −1.3483.3130.006 −0.826 4.139 0.015 −0.475 12.23 Copyright © 2013 SciRes. OPEN ACCESS  J. Tseng-Crank et al. / Open Journal of Genetics 3 (2013) 9-86 32 Continued PFKL phosphofructokinase, liver NM_0088260.024−0.7348.9040.2050.363 7.152 0.006 1.0059.638 PGM1 phosphoglucomutase 1 NM_0257000.003−0.88910.729 0.142 −0.326 11.054 0.026 0.56411.618 PGM3 phosphoglucomutase 3 NM_0283520.271−0.3816.948 0.038 0.827 6.122 0.008 1.2087.329 Nicotinate Nicotinamide Metabolism PRPF4B PRP4 pre-mRNA processing factor 4 homolog B (yeast) NM_009873 0.039 1.332 6.1440.2540.007 2.284 0.218 −0.704 4.812 NMNAT1 nicotinamide nucleotide adenylyltransferase 1 NM_009874 0.003 0.9446.3870.004 0.875 5.512 0.736 −0.069 5.443 PRKCE protein kinase C, epsilon NM_1334350.003−0.7844.5090.003 −0.802 5.311 0.254 0.0032.287 CDK6 cyclin-dependent kinase 6 NM_0087950.003−1.25.3020.015 −0.841 6.143 0.202 0.3596.501 PCTK3 PCTAIRE protein kinase 3 NM_0111040.001−1.3435.8720.005 −0.883 6.756 0.065 0.467.216 CDK7 cyclin-dependent kinase 7 NM_0169790.0060.7928.0310.0050.807 7.224 0.254 −0.047 2.306 PRKX protein kinase, X-linked NM_0138300.001−1.1873.9650.004−0.887 4.851 0.184 0.3 5.152 Arachidonic Acid Metabolism ACSS2 acyl-CoA synthetase short-chain family member 2 NM_0198110.313 −0.52911.2180.02−1.499 12.717 0.054 −1.03 11.548 CYP1A2 cytochrome P450, family 1, subfamily A, polypeptide 2 NM_0099930.0690.39912.721 0.003 −0.847 13.568 0 −1.246 12.323 CYP2A13 cytochrome P450, family 2, subfamily A, polypeptide 13 NM_0078120.503 −0.32111.5040.02−1.399 12.903 0.052 −1.078 11.825 CYP2B6 (includes EG:1555) cytochrome P450, family 2, subfamily B, polypeptide 6 NM_0099980.026 −0.9482.4340.002−1.753 4.175 0.044 −0.546 2.408 CYP2B9 cytochrome P450, family 2, subfamily b, polypeptide 9 NM_0100000.001 −5.3222.8960.684 −0.354 3.249 0.001 4.9698.218 CYP2C38 cytochrome P450, family 2, subfamily c, polypeptide 38 NM_0100020.001 −2.0337.6490.015 −1.247 8.896 0.079 0.7869.682 CYP2C54 cytochrome P450, family 2, subfamily c, polypeptide 54 NM_2065370.0190.49413.689 0.088−0.32 14.01 0.002 −0.815 13.195 CYP2C55 cytochrome P450, family 2, subfamily c, polypeptide 55 NM_0280890.4790.2146.4310 −1.945 8.376 0 −2.158 6.217 CYP2G1P cytochrome P450, family 2, subfamily G, polypeptide 1 pseudogene NM_013809 0.8740.0373.222 0.002 −1.19 4.411 0.001 −1.227 3.185 PLA2G4A phospholipase A2, group IVA (cytosolic, calcium-dependent) NM_008869 0.004 1.1115.7650.013 0.879 4.886 0.396 −0.232 4.654 Inositol Phosphate Metabolism CDK6 cyclin-dependent kinase 6 NM_0098730.003−1.25.3020.015 −0.841 6.143 0.202 0.3596.501 CDK7 cyclin-dependent kinase 7 NM_0098740.0060.7928.0310.0050.807 7.224 0.254 −0.047 2.306 PCTK3 PCTAIRE protein kinase 3 NM_0087950.001−1.3435.8720.005 −0.883 6.756 0.065 0.467.216 PRKCE protein kinase C, epsilon NM_0111040.003−0.7844.5090.003 −0.802 5.311 0.254 0.0032.287 PRKX protein kinase, X-linked NM_0169790.001−1.1873.9650.004−0.887 4.851 0.184 0.3 5.152 PTEN phosphatase and tensin homolog (mutated in multiple advanced cancers 1) NM_0089600.005 −0.48910.369 0.026 −0.982 10.268 0.124 0.20410.859 Taurine Hypotaurine Metabolism ACSS2 acyl-CoA synthetase short-chain family member 2 NM_0198110.313 −0.52911.2180.02−1.499 12.717 0.054 −1.03 11.548 CSAD cysteine sulfinic acid decarboxylase NM_1449420.4090.31510.032 0.002 −1.786 11.818 0.001 −2.101 9.717 Copyright © 2013 SciRes. OPEN ACCESS  J. Tseng-Crank et al. / Open Journal of Genetics 3 (2013) 9-86 33 Supplement Table 2. LUP/LV LUP/LC LV/LC Name Description RefSeq ID p-value Log2 Ratio Intensityp-valueLog2 Ratio Intensity p-value Log2 Ratio Intensity LPS/IL-1 Mediated Inhibition of RXR Function ALDH3A2 aldehyde dehydrogenase 3 family, member A2 NM_0074370.048 −0.65411.2960.5160.184 11.112 0.019 0.838 11.949 FABP5L2 fatty acid binding protein 5-like 2 NM_0106340.055 1.24312.1680.383−0.575 10.635 0.017 −1.969 8.666 GSTA4 glutathione S-transferase A4 NM_0103570.4170.14910.430.003 −0.779 11.209 0.001 −0.928 10.281 ACOX1 acyl-Coenzyme A oxidase 1, palmitoyl NM_0157290.002 −0.90113.030.298−0.207 13.236 0.008 0.69413.93 GSTM1 (includes EG:2944) glutathione S-transferase M1 NM_0081830.001 −0.9978.9650 −1.162 10.127 0.332 −0.1659.962 CD14 CD14 molecule NM_0098410.0451.0276.3150.1150.755 5.56 0.534 −0.272 5.288 HS6ST1 heparan sulfate 6-O-sulfotransferase 1 NM_0158180.013−0.9977.5510.185−0.433 7.983 0.098 0.5658.548 JUN jun oncogene NM_0105910.003−1.2055.0810.390.233 4.849 0.001 1.438 6.287 FMO1 flavin containing monooxygenase 1 NM_0102310 −1.137 10.0330.004−0.751 10.784 0.063 0.38611.171 SOD3 superoxide dismutase 3, extracellular NM_0114350 −0.896.4290.088 −0.258 6.687 0.002 0.6317.319 FABP2 fatty acid binding protein 2, intestinal NM_0079800.594−0.14512.1650.0350.693 11.471 0.017 0.839 12.31 SLCO1A2 solute carrier organic anion transporter family, member 1A2 NM_0306870.034 −1.5398.0120.025−1.668 9.68 0.828 −0.1299.551 glutathione S-transferase A5 NM_0081810.133−1.0137.6340.001−2.393 10.925 0.004 −1.89.126GSTA5 GSTM5 glutathione S-transferase M5 NM_0081840.376 −0.149 10.3510.002−0.818 11.169 0.005 −0.669 10.501 CYP2A13 cytochrome P450, family 2, subfamily A, polypeptide 13 NM_0078120.503 −0.321 11.5040.02−1.399 12.903 0.052 −1.078 11.825 CYP4A14 cytochrome P450, family 4, subfamily a, polypeptide 14 NM_0078220.04−1.50611.520.364−0.571 12.091 0.159 0.93413.026 FABP4 fatty acid binding protein 4, adipocyte NM_0244060.254 0.0992.3830.001 1.431 6.908 0.004 1.333 9.273 GSTM4 glutathione S-transferase M4 NM_0267640.097−0.4699.2310.002−1.226 10.456 0.019 −0.757 9.699 GALNAC4S-6ST B cell RAG associated protein NM_0299350.004−0.6484.7480.001−0.814 5.562 0.29 −0.1665.396 sterol regulatory element binding transcription factor 1 NM_0114800.003 −1.26511.290.043−0.663 11.952 0.06 0.60212.555SREBF1 GSTM3 (includes EG:14864) glutathione S-transferase, mu 3 NM_0103590.016−1.4169.9390.001−2.399 12.338 0.061 −0.982 11.356 NDST1 N-deacetylase/ N-sulfotransferase (heparan glucosaminyl) 1 NM_0083060.003 −1.331 6.3960.02−0.872 7.268 0.152 0.4587.726 ATP-binding cassette, sub-familyC (CFTR/MRP), member3 NM_0296000.021 −1.024 9.4960.048−0.82 10.315 0.227 −0.1262.463ABCC3 cytochrome P450, family 7, subfamily A, polypeptide 1 NM_0078240.0641.4729.6350.082−1.292 7.267 0.012 −2.2918.163CYP7A1 MGST3 microsomal glutathione S-transferase 3 NM_0255690.131 −0.4597.7260.009−0.982 8.708 0.093 −0.5238.185 GSTM1 (includes EG:14862) glutathione S-transferase, mu 1 NM_0103580 −0.8613.6650 −1.256 7.021 0.016 −0.4096.612 IL1R1 interleukin 1 receptor, type I NM_0011233820.0291.579 7.2920.07 1.228 6.064 0.555 −0.3515.713 PPARA peroxisome proliferator- activated receptor alpha NM_0011134180.008 −1.2699.6220.7570.095 9.613 0.012 1.168 10.89 IL1B interleukin 1, beta NM_0083610.0061.6426.5060.0111.447 5.06 0.645 −0.195 4.865 Copyright © 2013 SciRes. OPEN ACCESS  J. Tseng-Crank et al. / Open Journal of Genetics 3 (2013) 9-86 34 Continued SULT1C2 sulfotransferase family, cytosolic, 1C, member 2 NM_026935 0.027−0.8736.3470.137 −0.52 6.867 0.289 0.3537.22 NR0B2 nuclear receptor subfamily 0, group B, member 2 NM_011850 0.012−1.3959.0290.062 −0.913 9.942 0.275 0.482 10.424 FMO5 flavin containing monooxygenase 5 NM_010232 0.001−0.88711.336 0.038−0.37 11.706 0.006 0.695 10.173 FABP7 fatty acid binding protein 7, brain NM_021272 0.0020.876 7.3980.3870.161 7.237 0.005 −0.7156.521 ALDH1B1 aldehyde dehydrogenase 1 family, member B1 NM_028270 0.008−1.6066.8140.094−0.827 7.641 0.111 0.7798.419 ACSL3 acyl-CoA synthetase long-chain family member 3 NM_0010336060.011 −0.8257.6640.064 −0.519 8.184 0.233 0.3058.489 ALDH5A1 aldehyde dehydrogenase 5 family, member A1 (succinate-semialdehyde dehydrogenase) NM_172532 0.008−0.8088.1580.09 −0.422 8.58 0.114 0.387 8.966 PLTP phospholipid transfer protein NM_011125 0.027−1.2019.9970.011−1.493 11.49 0.51 −0.29211.198 CPT1A carnitine palmitoyltransferase 1A (liver) NM_013495 0.008−0.83411.1370.2520.279 10.858 0.002 1.11411.972 Aryl Hydrocarbon Receptor Signaling ALDH1B1 aldehyde dehydrogenase 1 family, member B1 NM_028270 0.008−1.6066.8140.094−0.827 7.641 0.111 0.7798.419 ALDH3A2 aldehyde dehydrogenase 3 family, member A2 NM_007437 0.048−0.65411.2960.5160.184 11.112 0.019 0.838 11.949 ALDH5A1 aldehyde dehydrogenase 5 family, member A1 (succinate-semialdehyde dehydrogenase) NM_172532 0.008−0.8088.1580.09 −0.422 8.58 0.114 0.387 8.966 BAX BCL2-associated X protein NM_007527 0.003−0.8446.9690.173 −0.28 7.248 0.02 0.564 7.812 CCND1 cyclin D1 NM_007631 0 −1.5995.0050 −1.239 6.244 0.041 0.3557.465 CCND2 cyclin D2 NM_009829 0.001−0.6064.1750.001−0.944 5.89 0.132 −0.1752.597 CDK6 cyclin-dependent kinase 6 NM_009873 0.003−1.25.3020.015−0.841 6.143 0.202 0.3596.501 CYP1A2 cytochrome P450, family 1, subfamily A, polypeptide 2 NM_009993 0.0690.39912.7210.003−0.847 13.568 0 −1.246 12.323 ESR1 estrogen receptor 1 NM_007956 0.012−0.862 8.2440.02 −0.763 9.007 0.622 −0.111 4.922 FASN fatty acid synthase NM_007988 0.002−1.96111.054 0.012 −1.338 12.392 0.154 0.62313.015 GSTA4 glutathione S-transferase A4 NM_010357 0.4170.14910.430.003−0.779 11.209 0.001 −0.92810.281 GSTA5 glutathione S-transferase A5 NM_008181 0.133−1.0137.6340.001−2.393 10.925 0.004 −1.89.126 GSTM1 (includes EG:14862) glutathione S-transferase, mu 1 NM_010358 0 −0.8613.6650 −1.256 7.021 0.016 −0.4096.612 GSTM1 (includes EG:2944) glutathione S-transferase M1 NM_008183 0.001−0.9978.9650 −1.162 10.127 0.332 −0.165 9.962 GSTM3 (includes EG:14864) glutathione S-transferase, mu 3 NM_010359 0.016−1.4169.9390.001−2.399 12.338 0.061 −0.98211.356 GSTM4 glutathione S-transferase M4 NM_026764 0.097−0.4699.2310.002−1.226 10.456 0.019 −0.757 9.699 GSTM5 glutathione S-transferase M5 NM_008184 0.376−0.14910.351 0.002 −0.818 11.169 0.005 −0.66910.501 IL1B interleukin 1, beta NM_008361 0.0061.6426.5060.011 1.447 5.06 0.645 −0.195 4.865 JUN jun oncogene NM_010591 0.003−1.2055.0810.390.233 4.849 0.001 1.4386.287 MGST3 microsomal glutathione S-transferase 3 NM_025569 0.131−0.4597.7260.009−0.982 8.708 0.093 −0.523 8.185 NFIA nuclear factor I/A NM_0011229520.008−1.2347.9550.026 −0.941 8.896 0.09 0.2752.694 Copyright © 2013 SciRes. OPEN ACCESS  J. Tseng-Crank et al. / Open Journal of Genetics 3 (2013) 9-86 35 Continued NFIB nuclear factor I/B NM_0011132090.001−0.88.030.005 −0.622 8.652 0.064 0.593.579 NFIC nuclear factor I/C (CCAAT-binding transcription factor) NM_008688 0.002−2.1532.8940.067 −1.007 10.325 0.009 1.4886.18 NFIX nuclear factor I/X (CCAAT-binding transcription factor) NM_0010819810.013 −0.8399.7420.049 −0.287 4.334 0.261 0.3 10.581 NQO1 NAD(P)H dehydrogenase, quinone 1 NM_008706 0.064−0.8833.7050.035 −1.056 4.761 0.677 −0.172 4.589 NR0B2 nuclear receptor subfamily 0, group B, member 2 NM_011850 0.012−1.3959.0290.062 −0.913 9.942 0.275 0.482 10.424 NRIP1 nuclear receptor interacting protein 1 NM_173440 0.003−1.2215.9190.031 −0.715 6.634 0.095 0.5067.14 SMARCA4 SWI/SNF related, matrix associated, actin dependent regulator of chromatin, subfamily a, member 4 NM_011417 0.003−1.2417.7870.363 −0.302 5.462 0.004 1.198 9.028 LXR/RXR Activation APOA4 apolipoprotein A-IV NM_007468 0.003−1.811.795 0.0141.271 10.524 0 3.071 13.595 CD14 CD14 molecule NM_009841 0.0451.0276.3150.1150.755 5.56 0.534 −0.272 5.288 CD36 CD36 molecule (thrombospondin receptor) NM_007643 0.014−1.725.2530.432 −0.427 5.68 0.042 1.2936.973 CYP7A1 cytochrome P450, family 7, subfamily A, polypeptide 1 NM_007824 0.0641.4729.6350.082 −1.292 7.267 0.012 −2.291 8.163 FASN fatty acid synthase NM_007988 0.002−1.96111.054 0.012 −1.338 12.392 0.154 0.62313.015 HMGCR 3-hydroxy-3-methylglutaryl- Coenzyme A reductase NM_008255 0.428−0.2546.790.007 −1.179 7.969 0.02 −0.925 7.044 IL1B interleukin 1, beta NM_008361 0.0061.6426.506 0.0111.447 5.06 0.645 −0.195 4.865 IL1R1 interleukin 1 receptor, type I NM_0011233820.0291.5797.292 0.07 1.228 6.064 0.555 −0.3515.713 LDLR low density lipoprotein receptor (familial hypercholesterolemia) NM_010700 0.005−1.4579.0680.121 −0.625 9.692 0.043 0.7433.31 MSR1 macrophage scavenger receptor 1 NM_0011133260.0011.0876.7780.0140.588 6.19 0.027 −0.4995.691 PLTP phospholipid transfer protein NM_011125 0.027−1.2019.9970.011 −1.493 11.49 0.51 −0.292 11.198 SCD stearoyl-CoA desaturase (delta-9-desaturase) NM_009127 0.003−2.1699.6940.003 −2.087 11.781 0.596 0.10115.081 SREBF1 sterol regulatory element binding transcription factor 1 NM_011480 0.003−1.26511.290.043 −0.663 11.952 0.06 0.60212.555 Xenobiotic Metabolism Signaling ABCC3 ATP-binding cassette, sub-familyC (CFTR/MRP), member3 NM_029600 0.021−1.0249.496 0.048 −0.82 10.315 0.227 −0.126 2.463 ALDH1B1 aldehyde dehydrogenase 1 family, member B1 NM_028270 0.008−1.6066.8140.094 −0.827 7.641 0.111 0.7798.419 ALDH3A2 aldehyde dehydrogenase 3 family, member A2 NM_007437 0.048−0.65411.2960.5160.184 11.112 0.019 0.838 11.949 ALDH5A1 aldehyde dehydrogenase 5 family, member A1 (succinate-semialdehyde dehydrogenase) NM_172532 0.008−0.808 8.1580.09−0.422 8.58 0.114 0.387 8.966 CAMK1D calcium/calmodulin- dependent protein kinase ID NM_177343 0.04−0.7026.781 0.006 −1.12 7.901 0.172 −0.418 7.483 CES1 (includes EG:12623) carboxylesterase 1 NM_021456 0.159−0.509 9.8470.02−0.988 10.835 0.182 −0.478 10.357 CES2 (includes EG:234671) carboxylesterase 2 NM_145603 0.2070.33810.0190.037−0.632 10.651 0.006 −0.97 9.681 CREBBP CREB binding protein (Rubinstein-Taybi syndrome) NM_0010254320.005 −1.3635.9110.161 −0.511 6.422 0.018 0.0272.313 Copyright © 2013 SciRes. OPEN ACCESS  J. Tseng-Crank et al. / Open Journal of Genetics 3 (2013) 9-86 36 Continued CYP1A2 cytochrome P450, family 1, subfamily A, polypeptide 2 NM_009993 0.0690.39912.7210.003−0.847 13.568 0 −1.246 12.323 EIF2AK3 eukaryotic translation initiation factor 2-alpha kinase 3 NM_010121 0.014−0.8055.1430.817 −0.058 5.2 0.019 0.7485.948 FMO1 flavin containing monooxygenase 1 NM_010231 0 −1.13710.033 0.004 −0.751 10.784 0.063 0.38611.171 FMO5 flavin containing monooxygenase 5 NM_010232 0.001−0.88711.336 0.038−0.37 11.706 0.006 0.695 10.173 GALNAC4S -6ST B cell RAG associated protein NM_029935 0.004−0.6484.7480.001 −0.814 5.562 0.29 −0.1665.396 GSTA4 glutathione S-transferase A4 NM_010357 0.4170.14910.430.003−0.779 11.209 0.001 −0.928 10.281 GSTA5 glutathione S-transferase A5 NM_008181 0.133−1.0137.6340.001 −2.393 10.925 0.004 −1.89.126 GSTM1 (includes EG:14862) glutathione S-transferase, mu 1 NM_010358 0 −0.8613.6650 −1.256 7.021 0.016 −0.4096.612 GSTM1 (includes EG:2944) glutathione S-transferase M1 NM_008183 0.001−0.9978.9650 −1.162 10.127 0.332 −0.165 9.962 GSTM3 (includes EG:14864) glutathione S-transferase, mu 3 NM_010359 0.016−1.4169.9390.001 −2.399 12.338 0.061 −0.982 11.356 GSTM4 glutathione S-transferase M4 NM_026764 0.097−0.4699.2310.002−1.226 10.456 0.019 −0.757 9.699 GSTM5 glutathione S-transferase M5 NM_008184 0.376−0.14910.351 0.002 −0.818 11.169 0.005 −0.66910.501 HS6ST1 heparan sulfate 6-O-sulfotransferase 1 NM_015818 0.013−0.9977.5510.185 −0.433 7.983 0.098 0.5658.548 IL1B interleukin 1, beta NM_008361 0.0061.6426.5060.011 1.447 5.06 0.645 −0.1954.865 KEAP1 kelch-like ECH-associated protein 1 NM_001110305 ///NM_001110306 /// NM_001110307 /// NM_016679 0.005 −0.9775.1510.041 −0.593 5.744 0.054 0.269.147 MAF v-maf musculoaponeurotic fibrosarcoma oncogene homolog (avian) NM_001025577 0.007−0.8524.2640.001 −1.235 5.499 0.081 −0.334 5.989 MGST3 microsomal glutathione S-transferase 3 NM_025569 0.131−0.4597.7260.009 −0.982 8.708 0.093 −0.523 8.185 NDST1 N-deacetylase/N-sulfotransferase (heparan glucosaminyl) 1 NM_008306 0.003−1.3316.3960.02−0.872 7.268 0.152 0.4587.726 NQO1 NAD(P)H dehydrogenase, quinone 1 NM_008706 0.064−0.8833.7050.035 −1.056 4.761 0.677 −0.172 4.589 NRIP1 nuclear receptor interacting protein 1 NM_173440 0.003−1.2215.9190.031−0.715 6.634 0.095 0.5067.14 PIK3R1 phosphoinositide-3-kinase, regulatory subunit 1 (alpha) NM_001024955 0.001−1.1246.4170.061 −0.437 3.074 0.003 0.891 7.234 PPP2R5E protein phosphatase 2, regulatory subunit B', epsilon isoform NM_012024 0 −0.9057.1870 −0.59 7.777 0.001 0.314 8.091 PRKCE protein kinase C, epsilon NM_011104 0.003−0.7844.5090.003 −0.802 5.311 0.254 0.0032.287 SOD3 superoxide dismutase 3, extracellular NM_011435 0 −0.896.4290.088 −0.258 6.687 0.002 0.6317.319 SULT1C2 sulfotransferase family, cytosolic, 1C, member 2 NM_026935 0.027−0.873 6.3470.137 −0.52 6.867 0.289 0.3537.22 UGT2B10 UDP glucuronosyltransferase 2 family, polypeptide B10 NM_053215 0.0241.634.538 0.104 1.041 3.497 0.322 −0.5892.908 UGT2B17 UDP glucuronosyltransferase 2 family, polypeptide B17 NM_133894 0.0073.3888.3730.107 1.639 6.734 0.075 −0.247 13.76 NRF2-mediated Oxidative Stress Response ACTG1 actin, gamma 1 NM_009609 0.002−0.94511.9350.880.028 11.907 0.001 0.97312.88 GSTA4 glutathione S-transferase A4 NM_010357 0.4170.14910.430.003−0.779 11.209 0.001 −0.928 10.281 GSTM1 (includes EG:2944) glutathione S-transferase M1 NM_008183 0.001−0.9978.9650 −1.162 10.127 0.332 −0.165 9.962 Copyright © 2013 SciRes. OPEN ACCESS  J. Tseng-Crank et al. / Open Journal of Genetics 3 (2013) 9-86 37 Continued DNAJC15 DnaJ (Hsp40) homolog, subfamily C, member 15 NM_025384 0.0010.81711.0750.0130.51 10.565 0.082 −0.306 10.258 JUN jun oncogene NM_010591 0.003−1.2055.0810.390.233 4.849 0.001 1.4386.287 FMO1 flavin containing monooxygenase 1 NM_010231 0 −1.13710.033 0.004 −0.751 10.784 0.063 0.38611.171 SOD3 superoxide dismutase 3, extracellular NM_011435 0 −0.896.4290.088−0.258 6.687 0.002 0.6317.319 GSTA5 glutathione S-transferase A5 NM_008181 0.133−1.0137.6340.001−2.393 10.925 0.004 −1.89.126 GSTM5 glutathione S-transferase M5 NM_008184 0.376−0.14910.351 0.002 −0.818 11.169 0.005 −0.66910.501 VCP valosin-containing protein NM_009503 0.001−0.82111.941 0.361 −0.144 12.085 0.003 0.67712.762 NQO1 NAD(P)H dehydrogenase, quinone 1 NM_008706 0.064−0.8833.7050.035−1.056 4.761 0.677 −0.172 4.589 GSTM4 glutathione S-transferase M4 NM_026764 0.097−0.4699.2310.002−1.226 10.456 0.019 −0.757 9.699 GSTM3 (includes EG:14864) glutathione S-transferase, mu 3 NM_010359 0.016−1.4169.9390.001−2.399 12.338 0.061 −0.98211.356 DNAJB14 DnaJ (Hsp40) homolog, subfamily B, member 14 XM_0014731730.003 −1.2254.7 0.216−0.361 5.062 0.016 0.8645.925 MAF v-maf musculoaponeurotic fibrosarcoma oncogene homolog (avian) NM_0010255770.007 −0.8524.2640.001 −1.235 5.499 0.081 −0.334 5.989 CREBBP CREB binding protein (Rubinstein-Taybi syndrome) NM_0010254320.005 −1.3635.9110.161 −0.511 6.422 0.018 0.0272.313 PRKCE protein kinase C, epsilon NM_011104 0.003−0.7844.5090.003 −0.802 5.311 0.254 0.0032.287 PIK3R1 phosphoinositide-3-kinase, regulatory subunit 1 (alpha) NM_0010249550.001 −1.1246.4170.061 −0.437 3.074 0.003 0.891 7.234 ATF4 activating transcription factor 4 (tax-responsive enhancer element B67) NM_009716 0.0110.8699.160.0170.784 8.377 0.734 −0.07610.489 MGST3 microsomal glutathione S-transferase 3 NM_025569 0.131−0.4597.7260.009 −0.982 8.708 0.093 −0.5238.185 GSTM1 (includes EG:14862) glutathione S-transferase, mu 1 NM_010358 0 −0.8613.6650 −1.256 7.021 0.016 −0.409 6.612 JUND jun D proto-oncogene NM_010592 0.002−0.8329.3210.115−0.309 9.63 0.02 0.52310.153 EIF2AK3 eukaryotic translation initiation factor 2-alpha kinase 3 NM_010121 0.014−0.8055.1430.817−0.058 5.2 0.019 0.7485.948 BACH1 BTB and CNC homology 1, basic leucine zipper t ranscription factor 1 NM_007520 0.009−0.7614.050.004−0.915 4.965 0.038 −0.575 8.737 KEAP1 kelch-like ECH-associated protein 1 NM_0011103050.005 −0.9775.1510.041 −0.593 5.744 0.054 0.269.147 GSK3B glycogen synthase kinase 3 beta NM_019827 0.003−1.354.3920.027 −0.818 5.21 0.108 0.627 6.711 PXR/RXR Activation ABCC3 ATP-binding cassette, sub-familyC (CFTR/MRP), member3 NM_029600 0.021−1.0249.4960.048 −0.82 10.315 0.227 −0.1262.463 ALDH3A2 aldehyde dehydrogenase 3 family, member A2 NM_007437 0.048−0.65411.2960.5160.184 11.112 0.019 0.83811.949 CPT1A carnitine palmitoyltransferase 1A (liver) NM_013495 0.008−0.83411.1370.2520.279 10.858 0.002 1.11411.972 CYP1A2 cytochrome P450, family 1, subfamily A, polypeptide 2 NM_009993 0.0690.39912.7210.003−0.847 13.568 0 −1.24612.323 CYP2B6 (includes EG:1555) cytochrome P450, family 2, subfamily B, polypeptide 6 NM_009998 0.026−0.9482.4340.002−1.753 4.175 0.044 −0.546 2.408 CYP7A1 cytochrome P450, family 7, subfamily A, polypeptide 1 NM_007824 0.0641.4729.6350.082−1.292 7.267 0.012 −2.291 8.163 FOXO3 forkhead box O3 NM_019740 0.01−0.8587.2860.043−0.591 7.877 0.091 −0.294.357 Copyright © 2013 SciRes. OPEN ACCESS  J. Tseng-Crank et al. / Open Journal of Genetics 3 (2013) 9-86 38 Continued G6PC glucose-6-phosphatase, catalytic subunit NM_008061 0.098−0.64112.0130.6410.161 11.851 0.049 0.80312.654 GSTA5 glutathione S-transferase A5 NM_008181 0.133−1.0137.6340.001 −2.393 10.925 0.004 −1.8 9.126 GSTM1 (includes EG:14862) glutathione S-transferase, mu 1 NM_010358 0 −0.8613.6650 −1.256 7.021 0.016 −0.4096.612 GSTM1 (includes EG:2944) glutathione S-transferase M1 NM_008183 0.001−0.9978.9650 −1.162 10.127 0.332 −0.165 9.962 NR0B2 nuclear receptor subfamily 0, group B, member 2 NM_011850 0.012−1.3959.0290.062 −0.913 9.942 0.275 0.482 10.424 PPARA peroxisome proliferator- activated receptor alpha NM_0011134180.008−1.2699.6220.7570.095 9.613 0.012 1.16810.89 PRKACA protein kinase, cAMP- dependent, catalytic, alpha NM_008854 0.001−0.8376.1490.164 −0.235 6.384 0.006 0.6036.986 SCD stearoyl-CoA desaturase (delta-9-desaturase) NM_009127 0.003−2.1699.6940.003 −2.087 11.781 0.596 0.10115.081 FXR/RXR Activation ABCB4 ATP-binding cassette, sub-family B (MDR/TAP), member 4 NM_008830 0.131−0.34511.3910.0160.651 10.74 0.002 0.996 11.736 APOB apolipoprotein B (including Ag(x) antigen) NM_009693 0.025−1.829.830.701 −0.068 13.11 0.015 2.06411.65 CREBBP CREB binding protein (Rubinstein-Taybi syndrome) NM_0010254320.005−1.3635.9110.161 −0.511 6.422 0.018 0.0272.313 CYP7A1 cytochrome P450, family 7, subfamily A, polypeptide 1 NM_007824 0.0641.4729.6350.082 −1.292 7.267 0.012 −2.291 8.163 FASN fatty acid synthase NM_007988 0.002−1.96111.054 0.012 −1.338 12.392 0.154 0.62313.015 G6PC glucose-6-phosphatase, catalytic subunit NM_008061 0.098−0.64112.0130.6410.161 11.851 0.049 0.80312.654 IL1B interleukin 1, beta NM_008361 0.0061.6426.5060.011 1.447 5.06 0.645 −0.195 4.865 NR0B2 nuclear receptor subfamily 0, group B, member 2 NM_011850 0.012−1.3959.0290.062 −0.913 9.942 0.275 0.482 10.424 OSTBETA organic solute transporter beta NM_178933 0 0.8033.9510 0.834 3.117 0.692 0.0313.148 PKLR pyruvate kinase, liver and RBC NM_0010997790.006−1.1799.3960.142 −0.626 8.63 0.049 0.7 10.574 PLTP phospholipid transfer protein NM_011125 0.027−1.2019.9970.011 −1.493 11.49 0.51 −0.29211.198 PPARA peroxisome proliferator- activated receptor alpha NM_0011134180.008−1.2699.6220.7570.095 9.613 0.012 1.16810.89 SLC22A7 solute carrier family 22 (organic anion transporter), member 7 NM_144856 0.3040.50210.3840.0141.509 8.875 0.064 1.0079.882 SREBF1 sterol regulatory element binding transcription factor 1 NM_011480 0.003−1.26511.290.043 −0.663 11.952 0.06 0.60212.555 VLDLR very low density lipoprotein receptor NM_013703 0.032−1.1593.5480.1−0.816 4.363 0.09 0.4812.856 PPARa/RXRa Activation ACOX1 acyl-Coenzyme A oxidase 1, palmitoyl NM_015729 0.002−0.90113.030.298 −0.207 13.236 0.008 0.69413.93 CD36 CD36 molecule (thrombospondin receptor) NM_007643 0.014−1.725.2530.432 −0.427 5.68 0.042 1.2936.973 CREBBP CREB binding protein (Rubinstein-Taybi syndrome) NM_0010254320.005−1.3635.9110.161 −0.511 6.422 0.018 0.0272.313 CYP2C38 cytochrome P450, family 2, subfamily c, polypeptide 38 NM_010002 0.001−2.0337.6490.015 −1.247 8.896 0.079 0.7869.682 CYP2C54 cytochrome P450, family 2, subfamily c, polypeptide 54 NM_206537 0.0190.49413.6890.088−0.32 14.01 0.002 −0.815 13.195 CYP2C55 cytochrome P450, family 2, subfamily c, polypeptide 55 NM_028089 0.4790.2146.4310 −1.945 8.376 0 −2.158 6.217 FASN fatty acid synthase NM_007988 0.002−1.96111.054 0.012 −1.338 12.392 0.154 0.62313.015 Copyright © 2013 SciRes. OPEN ACCESS  J. Tseng-Crank et al. / Open Journal of Genetics 3 (2013) 9-86 39 Continued GNAQ guanine nucleotide binding protein (G protein), q polypeptide NM_008139 0.001−0.9235.9570.011−0.605 6.563 0.043 0.5146.285 GPD1 glycerol-3-phosphate dehydrogenase 1 (soluble) NM_010271 0.003−0.86110.337 0.258 −0.227 10.565 0.012 0.63411.199 GPD2 glycerol-3-phosphate dehydrogenase 2 (mitochondrial) NM_010274 0.004−0.8718.9680.254−0.011 2.295 0.002 0.989 9.839 IL1B interleukin 1, beta NM_008361 0.0061.6426.5060.011 1.447 5.06 0.645 −0.1954.865 IL1R1 interleukin 1 receptor, type I NM_001123382 0.0291.5797.292 0.07 1.228 6.064 0.555 −0.3515.713 ITGB5 integrin, beta 5 NM_010580 0.003−0.949.0490.075 −0.432 9.482 0.032 0.4749.953 JUN jun oncogene NM_010591 0.003−1.2055.0810.390.233 4.849 0.001 1.438 6.287 NR0B2 nuclear receptor subfamily 0, group B, member 2 NM_011850 0.012−1.3959.0290.062−0.913 9.942 0.275 0.482 10.424 PPARA peroxisome proliferator- activated receptor alpha NM_001113418 /// NM_011144 0.008 −1.2699.6220.7570.095 9.613 0.012 1.168 10.89 PRKACA protein kinase, cAMP- dependent, catalytic, alpha NM_008854 0.001−0.8376.1490.164 −0.235 6.384 0.006 0.6036.986 SMAD3 SMAD family member 3 NM_016769 0.005−0.994.4390.105−0.438 4.877 0.052 0.5525.429 Integrin Signaling ACTG1 actin, gamma 1 NM_009609 0.002−0.94511.9350.880.028 11.907 0.001 0.973 12.88 ARF3 ADP-ribosylation factor 3 NM_007478 0.003−0.8058.1650.181 −0.288 6.881 0.014 0.5868.97 ARHGAP26 Rho GTPase activating protein 26 NM_175164 0.0230.7427.5740.0070.98 6.594 0.1 0.4764.812 CAPN8 calpain 8 NM_130890 0.0231.1484.2580.009 1.428 2.83 0.491 0.283.11 CAV1 caveolin 1, caveolae protein, 22 kDa NM_007616 0.0180.8727.1710.008 1.046 6.125 0.549 0.1746.3 GSK3B glycogen synthase kinase 3 beta NM_019827 0.003−1.354.3920.027 −0.818 5.21 0.108 0.627 6.711 ITGB5 integrin, beta 5 NM_010580 0.003−0.949.0490.075 −0.432 9.482 0.032 0.4749.953 MYL9 (includes EG:98932) myosin, light polypeptide 9, regulatory XM_485171 0.008−0.851 3.7260.005 −0.95 4.676 0.67 −0.14.577 PIK3R1 phosphoinositide-3-kinase, regulatory subunit 1 (alpha) NM_001024955 0.001−1.1246.4170.061 −0.437 3.074 0.003 0.891 7.234 PTEN phosphatase and tensin homolog (mutated in multiple advanced cancers 1) NM_008960 0.005−0.48910.369 0.026 −0.982 10.268 0.124 0.20410.859 PXN paxillin NM_011223 0.002−1.1469.1790.031 −0.633 9.812 0.064 0.513 10.325 RAP1B RAP1B, member of RAS oncogene family NM_024457 0.0011.046 9.9140.020.595 9.319 0.055 −0.4518.868 RAPGEF1 Rap guanine nucleotide exchange factor (GEF) 1 NM_001039086 0.031−0.8554.5580.586 −0.178 4.736 0.069 0.6775.413 RHOJ ras homolog gene family, member J NM_023275 0.001−1.5534.1050.011 −0.882 4.987 0.033 0.6715.658 RHOU ras homolog gene family, member U NM_133955 0 −1.2218.9330.021 −0.436 9.368 0.001 0.785 10.154 RND2 Rho family GTPase 2 NM_009708 0.009−0.5837.4850.001−0.859 8.343 0.128 −0.2768.067 VCL vinculin NM_009502 0.007−0.8527.9540.158 −0.352 8.305 0.061 0.5018.806 WAS Wiskott-Aldrich syndrome (eczema-thrombocytopenia) NM_009515 0.0220.8074.520.0640.597 3.923 0.46 −0.213.713 WASL (includes EG:8976) Wiskott-Aldrich syndrome-like NM_028459 0.001−0.8086.7960.016 −0.251 9.173 0.007 0.5497.604 ZYX zyxin NM_011777 0.003−1.2796.5490.007−1.097 7.646 0.538 0.1827.828 RXR Activation Copyright © 2013 SciRes. OPEN ACCESS  J. Tseng-Crank et al. / Open Journal of Genetics 3 (2013) 9-86 40 Continued CCNH cyclin H NM_023243 0.0030.911 7.3310.0520.479 6.852 0.043 −0.306 8.953 CDK7 cyclin-dependent kinase 7 NM_009874 0.0060.7928.0310.0050.807 7.224 0.254 −0.047 2.306 CREBBP CREB binding protein (Rubinstein-Taybi syndrome) NM_0010254320.005 −1.3635.9110.161 −0.511 6.422 0.018 0.0272.313 CSNK2A1 casein kinase 2, alpha 1 polypeptide NM_007788 0.001−1.0877.1110.015 −0.604 7.715 0.036 0.4838.198 CYP26A1 cytochrome P450, family 26, subfamily A, polypeptide 1 NM_007811 0.022−1.9915.1920.001 −3.72 8.911 0.037 −1.729 7.183 DUSP1 dual specificity phosphatase 1 NM_013642 0.005−1.4267.3980.5860.197 7.201 0.003 1.623 8.824 JUN jun oncogene NM_010591 0.003−1.2055.0810.390.233 4.849 0.001 1.4386.287 NR2F2 nuclear receptor subfamily 2, group F, member 2 NM_009697 0.004−0.8857.7920.01 −0.725 8.518 0.067 0.1012.422 NRIP1 nuclear receptor interacting protein 1 NM_173440 0.003−1.2215.9190.031 −0.715 6.634 0.095 0.5067.14 PIK3R1 phosphoinositide-3-kinase, regulatory subunit 1 (alpha) NM_0010249550.001 −1.1246.4170.061 −0.437 3.074 0.003 0.8917.234 PRKACA protein kinase, cAMP- dependent, catalytic, alpha NM_008854 0.001−0.8376.1490.164 −0.235 6.384 0.006 0.6036.986 PRKCE protein kinase C, epsilon NM_011104 0.003−0.7844.5090.003 −0.802 5.311 0.254 0.0032.287 PTEN phosphatase and tensin homolog (mutated in multiple advanced cancers 1) NM_008960 0.005−0.48910.369 0.026 −0.982 10.268 0.124 0.20410.859 RDH11 retinol dehydrogenase 11 (all-trans/9-cis/11-cis) NM_021557 0.697−0.143 8.3210.02 −1.089 9.41 0.034 −0.945 8.464 RDH16 (includes EG:19683) retinol dehydrogenase 16 NM_009040 0.031−0.9788.0010.066 −0.783 8.784 0.6 0.1958.979 SMAD3 SMAD family member 3 NM_016769 0.005−0.994.4390.105 −0.438 4.877 0.052 0.5525.429 SMAD6 SMAD family member 6 NM_008542 0.015−0.9064.7420.069 −0.595 5.337 0.294 0.3115.647 SMARCA2 SWI/SNF related, matrix associated, actin dependent regulator of chromatin, subfamily a, member 2 NM_011416 0.023−0.8894.8370.4360.004 2.325 0.063 0.6745.726 SMARCA4 SWI/SNF related, matrix associated, actin dependent regulator of chromatin, subfamily a, member 4 NM_011417 0.003−1.2417.7870.363 −0.302 5.462 0.004 1.1989.028 STAT5A signal transducer and activator of transcription 5A NM_011488 0.009−0.682.8560.1160.493 5.449 0.003 0.83 3.536 P53 Signaling BAX BCL2-associated X protein NM_007527 0.003−0.8446.9690.173 −0.28 7.248 0.02 0.564 7.812 CCND1 cyclin D1 NM_007631 0 −1.5995.0050 −1.239 6.244 0.041 0.3557.465 CCND2 cyclin D2 NM_009829 0.001−0.6064.1750.001−0.944 5.89 0.132 −0.175 2.597 FASN fatty acid synthase NM_007988 0.002−1.96111.054 0.012 −1.338 12.392 0.154 0.62313.015 GSK3B glycogen synthase kinase 3 beta NM_019827 0.003−1.354.3920.027 −0.818 5.21 0.108 0.627 6.711 HIPK2 homeodomain interacting protein kinase 2 NM_010433 0.013−1.5796.1490.105 −0.872 7.021 0.04 0.5715.961 JUN jun oncogene NM_010591 0.003−1.2055.0810.390.233 4.849 0.001 1.4386.287 PIK3R1 phosphoinositide-3-kinase, regulatory subunit 1 (alpha) NM_0010249550.001 −1.1246.4170.061 −0.437 3.074 0.003 0.8917.234 PLAGL1 pleiomorphic adenoma gene-like 1 NM_009538 0.002−1.833.9040.093 −0.729 4.633 0.023 1.1015.734 PTEN phosphatase and tensin homolog (mutated in multiple advanced cancers 1) NM_008960 0.005−0.48910.369 0.026 −0.982 10.268 0.124 0.20410.859 TP53BP2 tumor protein p53 binding protein, 2 NM_173378 0.001−0.8354.350.1690.145 6.649 0.003 0.695 5.185 Copyright © 2013 SciRes. OPEN ACCESS  J. Tseng-Crank et al. / Open Journal of Genetics 3 (2013) 9-86 41 Continued Nucleotide Excision Repair Pathway CCNH cyclin H NM_023243 0.0030.911 7.3310.0520.479 6.852 0.043 −0.3068.953 CDK7 cyclin-dependent kinase 7 NM_009874 0.0060.7928.0310.0050.807 7.224 0.254 −0.047 2.306 ERCC8 excision repair cross- complementing rodent repair deficiency, complementation group 8 NM_028042 0.0270.8555.1840.0550.703 4.481 0.133 −0.1523.782 POLR2A polymerase (RNA) II (DNA directed) polypeptide A, 220 kDa NM_009089 0.025−1.0225.640.618 −0.183 5.822 0.051 0.839 6.661 POLR2C polymerase (RNA) II (DNA directed) polypeptide C, 33 kDa NM_009090 0.0050.8569.0710.0580.467 8.604 0.1 −0.389 8.215 RPA3 replication protein A3, 14 kDa NM_026632 0.0121.0068.220.2280.387 7.833 0.074 −0.619 7.215 ERK/MAPK Signaling PPP1R14A protein phosphatase 1, regulatory (inhibitor) subunit 14A NM_026731 0.0140.8685.6720.0520.618 5.054 0.371 −0.25 4.805 YWHAG tyrosine 3-monooxygenase/ tryptophan 5-monooxygenase activation protein, gamma polypeptide NM_018871 0.001−0.9178.8570.032 −0.405 9.262 0.012 0.5129.774 MKNK2 MAP kinase interacting serine/threonine kinase 2 NM_021462 0.005−1.5829.2580.012 −1.316 10.574 0.323 0.3355.522 RAP1B RAP1B, member of RAS oncogene family NM_024457 0.0011.0469.9140.020.595 9.319 0.055 −0.451 8.868 DUSP1 dual specificity phosphatase 1 NM_013642 0.005−1.4267.3980.5860.197 7.201 0.003 1.623 8.824 PPP2R5E protein phosphatase 2, regulatory subunit B’, epsilon isoform NM_012024 0 −0.9057.1870 −0.59 7.777 0.001 0.314 8.091 RAPGEF1 Rap guanine nucleotide exchange factor (GEF) 1 NM_0010390860.031 −0.8554.5580.586 −0.178 4.736 0.069 0.6775.413 PRKCE protein kinase C, epsilon NM_011104 0.003−0.7844.5090.003−0.802 5.311 0.254 0.0032.287 PRKACA protein kinase, cAMP- dependent, catalytic, alpha NM_008854 0.001−0.8376.1490.164−0.235 6.384 0.006 0.6036.986 PIK3R1 Phosphoinositide-3-kinase, regulatory subunit 1 (alpha) NM_0010249550.001 −1.1246.4170.061 −0.437 3.074 0.003 0.891 7.234 ESR1 estrogen receptor 1 NM_007956 0.012−0.8628.2440.02 −0.763 9.007 0.622 −0.1114.922 PXN paxillin NM_011223 0.002−1.1469.1790.031 −0.633 9.812 0.064 0.513 10.325 MAP2K1IP1 mitogen-activated protein kinase kinase 1 interacting protein 1 NM_019920 0.010.8059.7960.0530.53 9.265 0.263 −0.275 8.991 ATF4 activating transcription factor 4 (tax-responsive enhancer element B67) NM_009716 0.0110.8699.160.0170.784 8.377 0.734 −0.076 10.489 MYCN v-myc myelocytomatosis viral related oncogene, neuroblastoma derived (avian) NM_008709 0.127−0.7684.1130.234 −0.054 2.357 0.035 1.167 4.881 PLA2G4A phospholipase A2, group IVA (cytosolic, calcium-dependent) NM_008869 0.0041.1115.765 0.013 0.879 4.886 0.396 −0.232 4.654 ELK3 ELK3, ETS-domain protein (SRF accessory protein 2) NM_013508 0.01−0.6035.5670.002 −0.849 6.415 0.033 0.4554.877 RPS6KA1 ribosomal protein S6 kinase, 90 kDa, polypeptide 1 NM_009097 0.007−1.0495.9430.209 −0.369 6.312 0.04 0.6816.993 PPP1R3C protein phosphatase 1, regulatory (inhibitor) subunit 3C NM_016854 0.292−0.27611.7890.0630.63 7.723 0.014 0.805 12.065 Hepatic Cholestasis Copyright © 2013 SciRes. OPEN ACCESS  J. Tseng-Crank et al. / Open Journal of Genetics 3 (2013) 9-86 42 Continued ABCB4 ATP-binding cassette, sub- family B (MDR/TAP), member 4 NM_008830 0.131−0.34511.3910.0160.651 10.74 0.002 0.996 11.736 ABCC3 ATP-binding cassette, sub-familyC (CFTR/MRP), member3 NM_029600 0.021−1.0249.496 0.048 −0.82 10.315 0.227 −0.1262.463 CD14 CD14 molecule NM_009841 0.0451.0276.3150.1150.755 5.56 0.534 −0.2725.288 CYP7A1 cytochrome P450, family 7, subfamily A, polypeptide 1 NM_007824 0.0641.4729.6350.082 −1.292 7.267 0.012 −2.291 8.163 CYP7B1 cytochrome P450, family 7, subfamily B, polypeptide 1 NM_007825 0.0051.46412.838 0.0131.203 11.635 0.404 −0.28612.756 ESR1 estrogen receptor 1 NM_007956 0.012−0.862 8.2440.02−0.763 9.007 0.622 −0.111 4.922 IL1B interleukin 1, beta NM_008361 0.0061.6426.506 0.011 1.447 5.06 0.645 −0.195 4.865 IL1R1 interleukin 1 receptor, type I NM_0011233820.029 1.5797.292 0.07 1.228 6.064 0.555 −0.351 5.713 JUN jun oncogene NM_010591 0.003−1.2055.0810.390.233 4.849 0.001 1.4386.287 NR0B2 nuclear receptor subfamily 0, group B, member 2 NM_011850 0.012−1.3959.0290.062 −0.913 9.942 0.275 0.48210.424 PPARA peroxisome proliferator- activated receptor alpha NM_0011134180.008 −1.2699.6220.7570.095 9.613 0.012 1.168 10.89 PRKACA protein kinase, cAMP- dependent, catalytic, alpha NM_008854 0.001−0.8376.1490.164 −0.235 6.384 0.006 0.6036.986 PRKCE protein kinase C, epsilon NM_011104 0.003−0.7844.5090.003 −0.802 5.311 0.254 0.0032.287 SLC22A7 solute carrier family 22 (organic anion transporter), member 7 NM_144856 0.3040.50210.3840.0141.509 8.875 0.064 1.007 9.882 SLCO1A2 solute carrier organic anion transporter family, member 1A2 NM_030687 0.034−1.5398.0120.025 −1.668 9.68 0.828 −0.129 9.551 SREBF1 sterol regulatory element binding transcription factor 1 NM_011480 0.003−1.26511.290.043 −0.663 11.952 0.06 0.60212.555 Glucocorticoid Receptor Signaling AR androgen receptor (dihydrotestosterone receptor; testicular feminization; spinal and bulbar muscular atrophy; Kennedy disease) NM_013476 0.007−0.933.522 0.002 −1.25 4.772 0.061 −0.626 5.533 CCL5 chemokine (C-C motif) ligand 5 NM_013653 0.6030.1254.0880.008−0.878 4.965 0.004 −1.003 3.963 CCNH cyclin H NM_023243 0.0030.911 7.3310.0520.479 6.852 0.043 −0.306 8.953 CDK7 cyclin-dependent kinase 7 NM_009874 0.0060.7928.0310.0050.807 7.224 0.254 −0.047 2.306 CREBBP CREB binding protein (Rubinstein-Taybi syndrome) NM_0010254320.005 −1.3635.9110.161 −0.511 6.422 0.018 0.0272.313 DUSP1 dual specificity phosphatase 1 NM_013642 0.005−1.4267.3980.5860.197 7.201 0.003 1.623 8.824 ESR1 estrogen receptor 1 NM_007956 0.012−0.862 8.2440.02−0.763 9.007 0.622 −0.111 4.922 FCGR1A Fc fragment of IgG, high affinity Ia, receptor (CD64) NM_010186 0.0031 6.6980.10.421 6.276 0.037 −0.5795.698 GTF2A2 general transcription factor IIA, 2, 12 kDa NM_0010395190.0031.047 9.8990.0480.562 9.337 0.077 −0.485 8.852 HSPA4 heat shock 70 kDa protein 4 NM_008300 0.011−0.4249.2 0.15−0.194 9.394 0.016 1.2517.18 IL1B interleukin 1, beta NM_008361 0.0061.6426.506 0.011 1.447 5.06 0.645 −0.195 4.865 JUN jun oncogene NM_010591 0.003−1.2055.0810.390.233 4.849 0.001 1.4386.287 NRIP1 nuclear receptor interacting protein 1 NM_173440 0.003−1.2215.9190.031 −0.715 6.634 0.095 0.5067.14 PBX1 pre-B-cell leukemia homeobox 1 NM_008783 0.004−1.1185.6350.042 −0.63 6.265 0.093 0.488 6.753 Copyright © 2013 SciRes. OPEN ACCESS  J. Tseng-Crank et al. / Open Journal of Genetics 3 (2013) 9-86 43 Continued PIK3R1 phosphoinositide-3-kinase, regulatory subunit 1 (alpha) NM_001024955 0.001−1.1246.417 0.061−0.437 3.074 0.003 0.891 7.234 POLR2A polymerase (RNA) II (DNA directed) polypeptide A, 220 kDa NM_009089 0.025−1.0225.640.618 −0.183 5.822 0.051 0.839 6.661 POLR2C polymerase (RNA) II (DNA directed) polypeptide C, 33 kDa NM_009090 0.0050.8569.0710.0580.467 8.604 0.1 −0.389 8.215 PRKACA protein kinase, cAMP- dependent, catalytic, alpha NM_008854 0.001−0.8376.149 0.164−0.235 6.384 0.006 0.6036.986 SMAD3 SMAD family member 3 NM_016769 0.005−0.994.439 0.105−0.438 4.877 0.052 0.5525.429 SMARCA2 SWI/SNF related, matrix associated, actin dependent regulator of chromatin, subfamily a, member 2 NM_011416 0.023−0.8894.8370.436 0.004 2.325 0.063 0.674 5.726 SMARCA4 SWI/SNF related, matrix associated, actin dependent regulator of chromatin, subfamily a, member 4 NM_011417 0.003−1.2417.787 0.363−0.302 5.462 0.004 1.198 9.028 STAT5A signal transducer and activator of transcription 5A NM_011488 0.009−0.682.8560.116 0.493 5.449 0.003 0.833.536 TBP TATA box binding protein NM_013684 0.0040.8636.324 0.0020.98 5.344 0.576 0.1175.461 NFkB Signaling CARD10 caspase recruitment domain family, member 10 NM_130859 0 −1.275.419 0.001−0.993 6.413 0.142 0.2766.689 CREBBP CREB binding protein (Rubinstein-Taybi syndrome) NM_001025432 0.005−1.3635.911 0.161−0.511 6.422 0.018 0.0272.313 CSNK2A1 casein kinase 2, alpha 1 polypeptide NM_007788 0.001−1.0877.111 0.015−0.604 7.715 0.036 0.4838.198 EGFR epidermal growth factor receptor (erythroblastic leukemia viral (v-erb-b) oncogene homolog, avian) NM_007912 0.0091.05310.54 0.0351.053 9.481 0.039 −0.733 9.487 GSK3B glycogen synthase kinase 3 beta NM_019827 0.003−1.354.392 0.027−0.818 5.21 0.108 0.627 6.711 IL1B interleukin 1, beta NM_008361 0.0061.6426.506 0.0111.447 5.06 0.645 −0.1954.865 IL1R1 interleukin 1 receptor, type I NM_001123382 0.0291.5797.2920.071.228 6.064 0.555 −0.351 5.713 KLK1B4 kallikrein 1-related pepidase b4 NM_010915 0.202−0.4114.4570.03−0.808 5.265 0.216 −0.397 4.869 PDGFRB platelet-derived growth factor receptor, beta polypeptide NM_008809 0 −1.1445.035 0.007−0.598 5.633 0.01 0.5466.179 PIK3R1 phosphoinositide-3-kinase, regulatory subunit 1 (alpha) NM_001024955 0.001−1.1246.417 0.061−0.437 3.074 0.003 0.891 7.234 PRKACA protein kinase, cAMP- dependent, catalytic, alpha NM_008854 0.001−0.8376.149 0.164−0.235 6.384 0.006 0.6036.986 TGFA transforming growth factor, alpha NM_031199 0.011−0.8916.539 0.051−0.604 7.143 0.254 −0.099 2.284 TRAF3 TNF receptor-associated factor 3 NM_001048206 0.018−1.5534.619 0.272−0.176 2.538 0.014 1.636 6.172 IL−10 Signaling BLVRA biliverdin reductase A NM_026678 0.0000.8409.0770.001 0.535 8.542 0.015 −0.305 8.237 CD14 CD14 molecule NM_009841 0.0451.027 6.3150.115 0.755 5.560 0.534 −0.272 5.288 FCGR2A Fc fragment of IgG, low affinity IIa, receptor (CD32) NM_010188 0.0011.3337.1160.038 0.542 6.574 0.008 −0.791 5.783 IL1B interleukin 1, beta NM_008361 0.0061.6426.506 0.0111.447 5.060 0.645 −0.195 4.865 IL1R1 interleukin 1 receptor, type I NM_001123382 /// NM_008362 0.029 1.5797.292 0.0701.228 6.064 0.555 −0.351 5.713 JUN jun oncogene NM_010591 0.003−1.2055.0810.390 0.233 4.849 0.001 1.438 6.287 SOCS3 suppressor of cytokine signaling 3 NM_007707 0.0060.9005.801 0.0001.482 4.318 0.039 0.5824.901 Copyright © 2013 SciRes. OPEN ACCESS  J. Tseng-Crank et al. / Open Journal of Genetics 3 (2013) 9-86 44 Continued PTEN Signaling BCL2L11 BCL2-like 11 (apoptosis facilitator) NM_009754 0.006−1.1033.9510.193−0.311 2.762 0.035 0.7155.053 CCND1 cyclin D1 NM_007631 0 −1.5995.0050 −1.239 6.244 0.041 0.3557.465 CSNK2A1 casein kinase 2, alpha 1 polypeptide NM_007788 0.001−1.0877.1110.015−0.604 7.715 0.036 0.4838.198 EGFR epidermal growth factor receptor (erythroblastic leukemia viral (v-erb-b) oncogene homolog, avian) NM_007912 0.0091.05310.54 0.0351.053 9.481 0.039 −0.7339.487 FOXO3 forkhead box O3 NM_019740 0.01−0.8587.2860.043 −0.591 7.877 0.091 −0.29 4.357 GSK3B glycogen synthase kinase 3 beta NM_019827 0.003−1.354.3920.027−0.818 5.21 0.108 0.627 6.711 INPPL1 inositol polyphosphate phosphatase-like 1 NM_0011227390.006 −0.9815.2240.058 −0.561 5.785 0.132 0.426.205 PDGFRB platelet-derived growth factor receptor, beta polypeptide NM_008809 0 −1.1445.0350.007 −0.598 5.633 0.01 0.5466.179 PIK3R1 phosphoinositide-3-kinase, regulatory subunit 1 (alpha) NM_0010249550.001 −1.1246.4170.061 −0.437 3.074 0.003 0.8917.234 PTEN phosphatase and tensin homolog (mutated in multiple advanced cancers 1) NM_008960 0.005−0.48910.3690.026 −0.982 10.268 0.124 0.20410.859 Estrogen Receptor Signaling CCNH cyclin H NM_023243 0.0030.911 7.3310.0520.479 6.852 0.043 −0.3068.953 CDK7 cyclin-dependent kinase 7 NM_009874 0.0060.7928.0310.0050.807 7.224 0.254 −0.0472.306 CREBBP CREB binding protein (Rubinstein-Taybi syndrome) NM_0010254320.005 −1.3635.9110.161−0.511 6.422 0.018 0.0272.313 ESR1 estrogen receptor 1 NM_007956 0.012−0.8628.2440.02 −0.763 9.007 0.622 −0.1114.922 G6PC glucose-6-phosphatase, catalytic subunit NM_008061 0.098−0.64112.0130.6410.161 11.851 0.049 0.80312.654 HNRPD heterogeneous nuclear ribonucleoprotein D (AU-rich element RNA binding protein 1, 37 kDa) NM_0010772650.004 −0.9187.3720.064 −0.283 4.374 0.064 0.4728.289 NR0B2 nuclear receptor subfamily 0, group B, member 2 NM_011850 0.012−1.3959.0290.062−0.913 9.942 0.275 0.482 10.424 NRIP1 nuclear receptor interacting protein 1 NM_173440 0.003−1.2215.9190.031−0.715 6.634 0.095 0.5067.14 POLR2A polymerase (RNA) II (DNA directed) polypeptide A, 220 kDa NM_009089 0.025−1.0225.640.618 −0.183 5.822 0.051 0.8396.661 POLR2C polymerase (RNA) II (DNA directed) polypeptide C, 33 kDa NM_009090 0.0050.8569.0710.0580.467 8.604 0.1 −0.389 8.215 SMARCA4 SWI/SNF related, matrix associated, actin dependent regulator of chromatin, subfamily a, member 4 NM_011417 0.003−1.2417.7870.363−0.302 5.462 0.004 1.1989.028 TBP TATA box binding protein NM_013684 0.0040.8636.324 0.0020.98 5.344 0.576 0.1175.461 14-3-3 mediated Signaling AKT1S1 AKT1 substrate 1 (proline-rich) NM_026270 0.013−1.1457.5360.155 −0.541 8.077 0.094 0.4645.732 BAX BCL2-associated X protein NM_007527 0.003−0.8446.9690.173 −0.28 7.248 0.02 0.564 7.812 EGFR epidermal growth factor receptor (erythroblastic leukemia viral (v-erb-b) oncogene homolog, avian) NM_007912 0.0091.05310.54 0.0351.053 9.481 0.039 −0.7339.487 GSK3B glycogen synthase kinase 3 beta NM_019827 0.003−1.354.3920.027−0.818 5.21 0.108 0.627 6.711 Copyright © 2013 SciRes. OPEN ACCESS  J. Tseng-Crank et al. / Open Journal of Genetics 3 (2013) 9-86 45 Continued JUN jun oncogene NM_010591 0.003−1.2055.0810.390.233 4.849 0.001 1.438 6.287 PDGFRB platelet-derived growth factor receptor, beta polypeptide NM_008809 0 −1.1445.0350.007 −0.598 5.633 0.01 0.5466.179 PIK3R1 phosphoinositide-3-kinase, regulatory subunit 1 (alpha) NM_0010249550.001 −1.1246.4170.061 −0.437 3.074 0.003 0.8917.234 PRKCE protein kinase C, epsilon NM_011104 0.003−0.7844.5090.003 −0.802 5.311 0.254 0.0032.287 RPS6KA1 ribosomal protein S6 kinase, 90 kDa, polypeptide 1 NM_009097 0.007−1.0495.9430.209 −0.369 6.312 0.04 0.6816.993 SNCA synuclein, alpha (non A4 component of amyloid precursor) NM_0010424510.022 −1.0438.3160.003 −1.596 9.912 0.126 −0.59 9.648 TUBB2A tubulin, beta 2A NM_009450 0 −1.3510.8680.4540.196 4.976 0 1.3212.219 YWHAG tyrosine 3-monooxygenase/ tryptophan 5-monooxygenase activation protein, gamma polypeptide NM_018871 0.001−0.9178.8570.032 −0.405 9.262 0.012 0.5129.774 PPAR Signaling CREBBP CREB binding protein (Rubinstein-Taybi syndrome) NM_0010254320.005 −1.3635.9110.161 −0.511 6.422 0.018 0.0272.313 IL1B interleukin 1, beta NM_008361 0.0061.6426.5060.011 1.447 5.06 0.645 −0.195 4.865 IL1R1 interleukin 1 receptor, type I NM_0011233820.0291.5797.292 0.07 1.228 6.064 0.555 −0.351 5.713 JUN jun oncogene NM_010591 0.003−1.2055.0810.390.233 4.849 0.001 1.438 6.287 NR0B2 nuclear receptor subfamily 0, group B, member 2 NM_011850 0.012−1.3959.0290.062 −0.913 9.942 0.275 0.482 10.424 NRIP1 nuclear receptor interacting protein 1 NM_173440 0.003−1.2215.9190.031 −0.715 6.634 0.095 0.5067.14 PDGFRB platelet-derived growth factor receptor, beta polypeptide NM_008809 0 −1.1445.0350.007 −0.598 5.633 0.01 0.5466.179 PPARA peroxisome proliferator- activated receptor alpha NM_0011134180.008 −1.2699.6220.7570.095 9.613 0.012 1.168 10.89 STAT5A signal transducer and activator of transcription 5A NM_011488 0.009−0.682.8560.1160.493 5.449 0.003 0.83 3.536 TR/RXR Activation CYP7A1 cytochrome P450, family 7, subfamily A, polypeptide 1 NM_007824 0.0641.4729.6350.082 −1.292 7.267 0.012 −2.291 8.163 DIO1 deiodinase, iodothyronine, type I NM_007860 0.110.41812.4320 1.671 10.761 0.001 1.253 12.014 FASN fatty acid synthase NM_007988 0.002−1.96111.054 0.012 −1.338 12.392 0.154 0.62313.015 G6PC Glucose-6-phosphatase, catalytic subunit NM_008061 0.098−0.64112.0130.6410.161 11.851 0.049 0.803 12.654 LDLR low density lipoprotein receptor (familial hypercholesterolemia) NM_010700 0.005−1.4579.0680.121 −0.625 9.692 0.043 0.7433.31 ME1 malic enzyme 1, NADP(+)-dependent, cytosolic NM_008615 0.012−1.13711.440.017 −1.058 12.499 0.7 −0.172 11.28 PIK3R1 Phosphoinositide-3-kinase, regulatory subunit 1 (alpha) NM_0010249550.001 −1.1246.4170.061 −0.437 3.074 0.003 0.8917.234 RCAN2 regulator of calcineurin 2 NM_030598 0 −2.6675.180.018 −0.922 6.101 0.001 1.7467.847 SLC2A1 solute carrier family 2 (facilitated glucose transporter), member 1 NM_011400 0.034−0.838 4.4090.04−0.799 5.208 0.693 0.094.814 SREBF1 sterol regulatory element binding transcription factor 1 NM_011480 0.003−1.26511.290.043 −0.663 11.952 0.06 0.60212.555 THRSP thyroid hormone responsive (SPOT14 homolog, rat) NM_009381 0.099−0.6713.337 0.042 −0.883 14.219 0.477 −0.35 11.878 UCP2 uncoupling protein 2 (mitochondrial, proton carrier) NM_011671 0.032−0.6086.7140.007 −0.881 7.595 0.26 −0.273 7.322 Cell Cycle: G1/S Checkpoint Regulation Copyright © 2013 SciRes. OPEN ACCESS  J. Tseng-Crank et al. / Open Journal of Genetics 3 (2013) 9-86 Copyright © 2013 SciRes. 46 OPEN ACCESS Continued CCND1 cyclin D1 NM_007631 0 −1.5995.0050 −1.239 6.244 0.041 0.3557.465 CCND2 cyclin D2 NM_009829 0.001−0.6064.175 0.001−0.944 5.89 0.132 −0.175 2.597 CDK6 Cyclin-dependent kinase 6 NM_009873 0.003−1.25.302 0.015−0.841 6.143 0.202 0.3596.501 GSK3B glycogen synthase kinase 3 beta NM_019827 0.003−1.354.392 0.027−0.818 5.21 0.108 0.6276.711 SMAD3 SMAD family member 3 NM_016769 0.005−0.994.439 0.105−0.438 4.877 0.052 0.5525.429 IL-2 Signaling CSNK2A1 casein kinase 2, alpha 1 polypeptide NM_007788 0.001−1.0877.111 0.015−0.604 7.715 0.036 0.4838.198 JUN jun oncogene NM_010591 0.003−1.2055.0810.390.233 4.849 0.001 1.438 6.287 PIK3R1 Phosphoinositide-3-kinase, regulatory subunit 1 (alpha) NM_0010249550.001 −1.1246.417 0.061−0.437 3.074 0.003 0.8917.234 STAT5A signal transducer and activator of transcription 5A NM_011488 0.009−0.682.8560.1160.493 5.449 0.003 0.83 3.536 JAK/Stat Signaling PIK3R1 Phosphoinositide-3-kinase, regulatory subunit 1 (alpha) NM_0010249550.001 −1.1246.417 0.061−0.437 3.074 0.003 0.8917.234 SOCS2 suppressor of cytokine signaling 2 NM_007706 0.0032.468.840.2540.074 2.291 0.005 −1.893 6.011 SOCS3 suppressor of cytokine signaling 3 NM_007707 0.0060.9 5.801 0 1.482 4.318 0.039 0.5824.901 STAT5A signal transducer and activator of transcription 5A NM_011488 0.009−0.682.8560.1160.493 5.449 0.003 0.83 3.536 IL-4 Signaling HLA-DMA major histocompatibility complex, class II, DM alpha NM_010386 0.0680.5325.7990.308−0.268 6.068 0.015 −0.8 5.268 HLA-DQB2 major histocompatibility complex, class II, DQ beta 2 NM_207105 0.793−0.1276.4240.025−1.355 7.779 0.036 −1.2286.551 HLA-DRB1 major histocompatibility complex, class II, DR beta 1 NM_010382 0.903−0.0688.855 0.045−1.327 10.182 0.054 −1.26 8.923 IL13RA1 interleukin 13 receptor, alpha 1 NM_133990 0.0071.0887.8980.0490.681 7.217 0.116 −0.452 7.264 INPPL1 inositol polyphosphate phosphatase-like 1 NM_0011227390.006 −0.9815.224 0.058−0.561 5.785 0.132 0.426.205 PIK3R1 Phosphoinositide-3-kinase, regulatory subunit 1 (alpha) NM_0010249550.001 −1.1246.417 0.061−0.437 3.074 0.003 0.8917.234 Antigen Presentation Pathway CD74 CD74 molecule, major histocompatibility complex, class II invariant chain NM_0010426050.219 −0.5119.262 0.017−1.202 10.464 0.112 −0.691 9.773 HLA-DMA major histocompatibility complex, class II, DM alpha NM_010386 0.0680.5325.7990.308−0.268 6.068 0.015 −0.8 5.268 HLA-DQB2 major histocompatibility complex, class II, DQ beta 2 NM_207105 0.793−0.1276.4240.025−1.355 7.779 0.036 −1.2286.551 HLA-DRB1 major histocompatibility complex, class II, DR beta 1 NM_010382 0.903−0.0688.855 0.045−1.327 10.182 0.054 −1.26 8.923 the total number of genes known to be associated with that pathway, 3) the total number of eligible genes in- cluded in the analysis, and 4) the total number of genes in the input data. Tables of −log(p-value), to rank the sig- nificance, were exported from IPA into JavaTreeView [10] to generate heatmaps (Supplement Figure 4). IPA presents pathway analysis data in part as interactive graphs. Pathway graphs deemed to be highly significant to UP780 mechanism of action are illustrated in the Supplement Figures 5 and 6. In addition, genes inclu- ded in the significant pathways from all three contrasts were exported to Excel as Supplement Tables 1-4. From the Ingenuity pathway analysis result of signifi- cant Canonical Pathways, the p-values derived from the evaluation of the pathways in association with the gene expression variations were −log10 transformed and plot- ted as heatmaps [10], for liver metabolic pathways (Sup- plement Figure 4(a)) and signaling pathways (Supple- ment Figure 4(b)) and for WAT metabolic pathways (Supplement Figure 4(c)) and signaling pathways (Sup- plement Figure 4(d)). The complete gene lists for indi- vidual pathways in Supplement Figure 4 are supplied as  J. Tseng-Crank et al. / Open Journal of Genetics 3 (2013) 9-86 47 (a) (b) (c) (d) Supplement Figure 4. Significant pathways with gene expression variations measured by microarrays. Heatmaps [10] were used to illustrate the metabolic and signaling canonical pathways that passed at least one of the IPA statistic tests at p < 0.05 for gene expres- sion variations in between contrasting RNA samples of HFD + UP780 vs. HFD, HFD + UP780 vs. lean control, and HFD vs. lean control. The color gradients correspond to the –log10 transformed p-values from the IPA pathway analysis of one-tailed Fisher’s exact tests, with yellow for the metabolic pathways and red for the signaling pathways, and black denoting missing values. A. liver meta- bolic pathways; B, liver signaling pathways; C, WAT metabolic pathways; and D, WAT signaling pathways. C is an exception in that the cutoff value for log2 ratio was set at 0.5 instead of 0.8 when conducting the IPA pathway analysis, as described in materials and methods. Copyright © 2013 SciRes. OPEN ACCESS  J. Tseng-Crank et al. / Open Journal of Genetics 3 (2013) 9-86 48 LUP-LV (a) LUP-LC (b) Copyright © 2013 SciRes. OPEN ACCESS  J. Tseng-Crank et al. / Open Journal of Genetics 3 (2013) 9-86 49 LV-LC (c) Supplement Figure 5. Liver canonical pathway of fatty acid biosynthesis. Fatty acid biosynthesis pathway figures for comparisons A, LUP-LV, B, LUP-LC, and C, LV-LC were overlaid with red (up- regulation) and green (down-regulation) according to the values of log2 ratio, with color gradient denoting the scale of up- or down-regulation. The figures were exported from the Ingenuity Pathway Analysis. (a) Copyright © 2013 SciRes. OPEN ACCESS  J. Tseng-Crank et al. / Open Journal of Genetics 3 (2013) 9-86 50 (b) (c) Supplement Figure 6. WAT canonical pathway of insulin receptor signaling. Insulin receptor signaling pathway figures for comparisons A, FUP-FV, B, FUP-FC, and C, FV-FC were overlaid with red (up-regu- lation) and green (down-regulation) according to the values of log2 ratio, with color gradient denoting the scale of up- or down-regulation. The figures were exported from the Ingenuity Pathway Analysis. Copyright © 2013 SciRes. OPEN ACCESS  J. Tseng-Crank et al. / Open Journal of Genetics 3 (2013) 9-86 51 Supplement Table 3. FUP/FV FUP/FC FV/FC Name Description RefSeq ID p-value Log Ratio Intensityp-valueLog Ratio Intensity p-value Log Ratio Intensity Propanoate Metabolism ACACA acetyl-Coenzyme A carboxylase alpha NM_133360 0.0340.83312.6560.009 −2.075.182 0.001 −1.73 11.823 ACACB acetyl-Coenzyme A carboxylase beta NM_133904 0.031.1649.508 0.8930.0599.449 0.036 −1.1068.344 ACAD10 acyl-Coenzyme A dehydrogenase family, member 10 NM_028037 0.0080.9068.3870.370.0682.183 0.003 −1.1 7.481 ACAD11 acyl-Coenzyme A dehydrogenase family, member 11 NM_028721 0.0090.58712.5080.3760.18513.851 0.03 −0.442 11.922 ACAD8 acyl-Coenzyme A dehydrogenase family, member 8 NM_025862 0.0050.5379.1940.004−0.5599.753 0 −1.097 8.657 ACADSB acyl-Coenzyme A dehydrogenase, short/branched chain NM_025826 0.0230.50512.4850.09−0.33812.823 0.002 −0.843 11.98 ACSM5 acyl-CoA synthetase medium-chain family member 5 NM_178758 0.0291.7816.6830.783−0.1816.864 0.019 −1.9634.901 ALDH2 aldehyde dehydrogenase 2 family (mitochondrial) NM_009656 0.0220.5338.2980.104−0.30213.448 0.003 −0.756 12.692 ALDH5A1 aldehyde dehydrogenase 5 family, member A1 (succinate-semialdehyde dehydrogenase) NM_172532 0.0120.80210.1080.459 −0.1810.288 0.004 −0.982 9.306 ALDH6A1 aldehyde dehydrogenase 6 family, member A1 NM_134042 0.0020.50312.5660.009−0.35912.925 0 −0.862 12.064 ALDH7A1 aldehyde dehydrogenase 7 family, member A1 NM_138600 0.0630.44812.2810.129−0.34612.627 0.006 −0.793 11.833 DHCR24 24-dehydrocholesterol reductase NM_053272 0.012−0.7888.527 0.8690.0398.489 0.009 0.827 9.315 ECHS1 enoyl Coenzyme A hydratase, short chain, 1, mitochondrial NM_053119 0.0410.41113.8740.457−0.12714.001 0.014 −0.539 13.463 EHHADH enoyl-Coenzyme A, hydratase/3-hydroxyacyl Coenzyme A dehydrogenase NM_023737 0.0440.60510.0520.570.1459.907 0.103 −0.469.447 GCDH glutaryl-Coenzyme A dehydrogenase NM_0010447440.0460.49110.4130.859 −0.03710.45 0.036 −0.5289.922 HIBCH 3-hydroxyisobutyryl- Coenzyme A hydrolase NM_146108 0.0410.50912.6050.496−0.3036.948 0.017 −0.641 12.096 IVD isovaleryl Coenzyme A dehydrogenase NM_019826 0.0130.84713.680.052 −0.5511.655 0.001 −1.253 10.402 LDHB lactate dehydrogenase B NM_008492 0.0780.39113.6270.192−0.27812.671 0.016 −0.608 13.236 MUT methylmalonyl Coenzyme A mutase NM_008650 0.0070.45513.3040.255−0.0032.125 0.004 −0.52712.849 PCCB propionyl Coenzyme A carboxylase, beta polypeptide NM_025835 0.0150.85212.850.714−0.09912.95 0.009 −0.951 11.999 SUCLG2 succinate-CoA ligase, GDP-forming, beta subunit NM_011507 0.0360.72910.320.106−0.32912.734 0.004 −0.77611.958 Valine, Leucine and Isoleucine Degradation 9330129D05RIK RIKEN cDNA 9330129D05 gene XM_488540 0.0031.0829.448 0.2980.26 9.188 0.011 −0.822 8.366 ACAA1B acetyl-Coenzyme A acyltransferase 1B NM_130864 0.138−0.28513.1070.0090.61712.489 0.001 0.902 13.391 ACAD10 acyl-Coenzyme A dehydrogenase family, member 10 NM_028037 0.0080.9068.3870.370.0682.183 0.003 −1.1 7.481 Copyright © 2013 SciRes. OPEN ACCESS  J. Tseng-Crank et al. / Open Journal of Genetics 3 (2013) 9-86 52 Continued ACAD11 acyl-Coenzyme A dehydrogenase family, member 11 NM_028721 0.0090.58712.5080.3760.185 13.851 0.03 −0.442 11.922 ACAD8 acyl-Coenzyme A dehydrogenase family, member 8 NM_025862 0.0050.5379.1940.004−0.559 9.753 0 −1.097 8.657 ACADSB acyl-Coenzyme A dehydrogenase, short/branched chain NM_025826 0.0230.50512.4850.09−0.338 12.823 0.002 −0.84311.98 ALDH2 aldehyde dehydrogenase 2 family (mitochondrial) NM_009656 0.0220.5338.2980.104−0.302 13.448 0.003 −0.756 12.692 ALDH5A1 aldehyde dehydrogenase 5 family, member A1 (succinate-semialdehyde dehydrogenase) NM_172532 0.0120.80210.108 0.459−0.18 10.288 0.004 −0.982 9.306 ALDH6A1 aldehyde dehydrogenase 6 family, member A1 NM_134042 0.0020.50312.5660.009−0.359 12.925 0 −0.86212.064 ALDH7A1 aldehyde dehydrogenase 7 family, member A1 NM_138600 0.0630.44812.2810.129−0.346 12.627 0.006 −0.793 11.833 BCAT1 branched chain aminotransferase 1, cytosolic NM_0010244680.448 −0.6187.920.018 0.877 3.754 0.007 1.091 4.845 BCAT2 branched chain aminotransferase 2, mitochondrial NM_009737 0.10.5138.9350.339−0.276 9.211 0.024 −0.789 8.422 BCKDHA branched chain keto acid dehydrogenase E1, alpha polypeptide NM_007533 0.0370.65513.0870.968−0.01 13.097 0.035 −0.666 12.431 DBT dihydrolipoamide branched chain transacylase E2 NM_010022 0.0240.64110.5120.138−0.369 10.882 0.003 −1.01 9.871 ECHS1 enoyl Coenzyme A hydratase, short chain, 1, mitochondrial NM_053119 0.0410.41113.8740.457−0.127 14.001 0.014 −0.539 13.463 EHHADH enoyl-Coenzyme A, hydratase/3-hydroxyacyl Coenzyme A dehydrogenase NM_023737 0.0440.60510.0520.570.145 9.907 0.103 −0.469.447 GCDH glutaryl-Coenzyme A dehydrogenase NM_0010447440.0460.49110.413 0.859 −0.037 10.45 0.036 −0.528 9.922 HIBCH 3-hydroxyisobutyryl- Coenzyme A hydrolase NM_146108 0.0410.50912.6050.496−0.303 6.948 0.017 −0.641 12.096 HMGCS1 3-hydroxy-3- methylglutaryl- Coenzyme A synthase 1 (soluble) NM_145942 0.2530.25612.310.0130.699 11.61 0.023 0.65914.896 HMGCS2 3-hydroxy-3- methylglutaryl- Coenzyme A synthase 2 (mitochondrial) NM_008256 0.0061.25711.845 0.0310.868 10.978 0.258 −0.3910.588 IVD isovaleryl Coenzyme A dehydrogenase NM_019826 0.0130.84713.68 0.052 −0.55 11.655 0.001 −1.25310.402 MCCC1 methylcrotonoyl- Coenzyme A carboxylase 1 (alpha) NM_023644 0.0270.44413.7010.321−0.168 13.868 0.007 −0.612 13.256 MCCC2 methylcrotonoyl- Coenzyme A carboxylase 2 (beta) NM_030026 0.0090.52112.30.096−0.275 12.575 0.001 −0.796 11.779 MUT methylmalonyl Coenzyme A mutase NM_008650 0.0070.45513.3040.255−0.003 2.125 0.004 −0.527 12.849 PCCB propionyl Coenzyme A carboxylase, beta polypeptide NM_025835 0.0150.85212.850.714 −0.099 12.95 0.009 −0.951 11.999 Beta-Alanine Metabolism 9330129D05RIK RIKEN cDNA 9330129D05 gene XM_488540 0.0031.0829.4480.2980.26 9.188 0.011 −0.822 8.366 Copyright © 2013 SciRes. OPEN ACCESS  J. Tseng-Crank et al. / Open Journal of Genetics 3 (2013) 9-86 53 Continued ACAD10 acyl-Coenzyme A dehydrogenase family, member 10 NM_028037 0.0080.9068.3870.370.068 2.183 0.003 −1.1 7.481 ACAD11 acyl-Coenzyme A dehydrogenase family, member 11 NM_028721 0.0090.58712.5080.3760.185 13.851 0.03 −0.44211.922 ACAD8 acyl-Coenzyme A dehydrogenase family, member 8 NM_025862 0.0050.5379.1940.004−0.559 9.753 0 −1.0978.657 ACADSB acyl-Coenzyme A dehydrogenase, short/branched chain NM_025826 0.0230.50512.4850.09−0.338 12.823 0.002 −0.84311.98 ALDH2 aldehyde dehydrogenase 2 family (mitochondrial) NM_009656 0.0220.5338.2980.104−0.302 13.448 0.003 −0.756 12.692 ALDH5A1 aldehyde dehydrogenase 5 family,member A1 (succinate-semialdehyde dehydrogenase) NM_172532 0.0120.80210.1080.459−0.18 10.288 0.004 −0.9829.306 ALDH6A1 aldehyde dehydrogenase 6 family, member A1 NM_134042 0.0020.50312.5660.009−0.359 12.925 0 −0.862 12.064 ALDH7A1 aldehyde dehydrogenase 7 family, member A1 NM_138600 0.0630.44812.2810.129−0.346 12.627 0.006 −0.793 11.833 AOC3 amine oxidase, copper containing 3 (vascular adhesion protein 1) NM_009675 0.0050.5314.4160.186−0.191 14.607 0.001 −0.721 13.886 DPYD dihydropyrimidine dehydrogenase NM_170778 0.0130.6379.480.055−0.441 9.921 0.001 −1.078 8.843 ECHS1 enoyl Coenzyme A hydratase, short chain, 1, mitochondrial NM_053119 0.0410.41113.8740.457−0.127 14.001 0.014 −0.539 13.463 EHHADH enoyl-Coenzyme A, hydratase/3-hydroxyacyl Coenzyme A dehydrogenase NM_023737 0.0440.60510.0520.570.145 9.907 0.103 −0.46 9.447 GCDH glutaryl-Coenzyme A dehydrogenase NM_0010447440.0460.49110.4130.859 −0.037 10.45 0.036 −0.5289.922 HIBCH 3-hydroxyisobutyryl- Coenzyme A hydrolase NM_146108 0.0410.50912.6050.496−0.303 6.948 0.017 −0.641 12.096 IVD isovaleryl Coenzyme A dehydrogenase NM_019826 0.0130.84713.680.052−0.55 11.655 0.001 −1.253 10.402 SMS spermine synthase NM_009214 0.01−0.4417.060.0120.423 6.637 0 0.8647.501 Glycosphingolipid Biosynthesis—Ganmglioseries B4GALNT1 beta-1,4-N-acetyl- galactosaminyl transferase 1 NM_008080 0.023−0.8268.1620.1380.472 7.69 0.003 1.2998.988 CHI3L3 chitinase 3-like 3 NM_009892 0.047−0.997 6.0540.0780.85 5.203 0.003 1.847 7.05 DBT dihydrolipoamide branched chain transacylase E2 NM_010022 0.0240.64110.5120.138−0.369 10.882 0.003 −1.019.871 GLB1 galactosidase, beta 1 AW553762 0.044 0.9177.970.0040.282 10.92 0.001 0.36911.288 GLB1L galactosidase, beta 1-like BB207162 0.0050.6368.0140.207−0.019 2.343 0.006 −0.6157.378 GLB1L2 galactosidase, beta 1-like 2 NM_153803 0.0280.50814.0960.033−0.47 13.134 0.002 −0.879 12.256 ST3GAL2 ST3 beta-galactoside alpha-2,3- sialyltransferase 2 NM_009179 0.0040.9647.7150.099 −0.416 7.643 0.002 −1.0516.751 ST3GAL4 ST3 beta-galactoside alpha-2,3- sialyltransferase 4 NM_009178 0.0061.0379.9680.253 −0.011 2.324 0.003 −1.2348.931 Copyright © 2013 SciRes. OPEN ACCESS  J. Tseng-Crank et al. / Open Journal of Genetics 3 (2013) 9-86 54 Continued ST6GALNAC4 ST6 (alpha-N-acetyl- neuraminyl-2, 3-beta- galactosyl-1,3)-N- acetylgalactosaminide alpha-2,6-sialyltransferase 4 NM_011373 0.005−0.8425.3090.0590.467 4.842 0.001 1.309 6.151 ST8SIA4 ST8 alpha-N-acetyl- neuraminide alpha-2, 8-sialyltransferase 4 NM_009183 0.049−1.5292.7590.640.31 2.449 0.025 1.839 4.287 Sphingolipid Metabolism ASAH2 N-acylsphingosine amidohydrolase (non-lysosomal ceramidase) 2 NM_018830 0.0020.5649.0840.039−0.286 9.37 0 −0.8498.52 CERK (includes EG:64781) ceramide kinase NM_145475 0.153−0.4869.4490.0590.686 8.763 0.007 1.172 9.935 GALC galactosylceramidase NM_008079 0.198−0.39110.185 0.0021.087 4.748 0.002 1.059 5.806 GLA galactosidase, alpha NM_013463 0.045−1.008 8.5 0.0510.969 7.53 0.002 1.977 9.508 GLB1 galactosidase, beta 1 −−− 0.0440.9177.970.0040.282 10.92 0.001 0.36911.288 GLB1L galactosidase, beta 1-like −−− 0.0050.6368.0140.207−0.019 2.343 0.006 −0.615 7.378 GLB1L2 galactosidase, beta 1-like 2 NM_153803 0.0280.50814.0960.033−0.47 13.134 0.002 −0.879 12.256 KDSR 3-ketodihydrosphingosine reductase NM_027534 0.0040.769.1150.093−0.337 9.452 0.001 −1.097 8.355 PPAP2A phosphatidic acid phosphatase type 2A NM_008247 0.154−0.30811.420.3090.21 11.209 0.033 0.51811.728 SPHK1 sphingosine kinase 1 NM_011451 0.017−1.1734.7660.1130.668 4.098 0.002 1.841 5.939 SULF1 sulfatase 1 NM_172294 0.0740.66111.0970.284−0.315 2.943 0.049 −0.753 10.436 SULF2 sulfatase 2 NM_028072 0.0020.6612.8890.5450.245 8.922 0.003 −0.627 12.229 UGCG UDP-glucose ceramide glucosyltransferase NM_011673 0.0010.7447.7380.1210.247 7.49 0.01 −0.3686.274 VNN1 vanin 1 NM_011704 0.0030.913 9.7470.0190.614 9.133 0.173 −0.3 8.834 VNN2 vanin 2 NM_011979 0.0051.42910.815 0.745 −0.118 10.932 0.004 −1.547 9.386 Nicotine and Nicotinamide Metabolism ACVR2A activin A receptor, type IIA NM_007396 0.06−0.3955.9980.1090.322 5.676 0.005 0.717 6.393 AKT2 v-akt murine thymoma viral oncogene homolog 2 NM_0011102080.020.69211.060.4890.164 10.896 0.016 −0.43913 ARAF v-raf murine sarcoma 3611 viral oncogene homolog NM_009703 0.0380.37610.450.2580.245 11.406 0.02 −0.912 3.647 BST1 bone marrow stromal cell antigen 1 NM_009763 0.186−0.4668.1010.320.338 7.763 0.041 0.804 8.566 CD38 CD38 molecule NM_007646 0.0021.1627.2850.035 −0.377 10.359 0 −1.043 9.315 CDC2 cell division cycle 2, G1 to S and G2 to M NM_007659 0.013−1.395 8.3420.021.253 7.088 0 2.648 9.736 CDK6 cyclin-dependent kinase 6 NM_009873 0.024−0.7629.0290.0930.629 7.834 0.003 1.211 9.791 CDK7 cyclin-dependent kinase 7 NM_009874 0.043−0.5915.7520.161−0.283 6.617 0.023 −0.533 6.084 CSNK1D casein kinase 1, delta NM_027874 0.0360.59310.450.253−0.043 2.526 0.026 −0.345 9.897 EIF2AK2 eukaryotic translation initiation actor 2-alpha kinase 2 NM_011163 0.0340.586.3760.2610.163 6.524 0.088 −0.433 5.796 ENPP1 ectonucleotide pyrophosphatase/ phosphodiesterase 1 NM_008813 0.046−1.4055.350.185 0.845 4.505 0.007 2.25 6.755 Copyright © 2013 SciRes. OPEN ACCESS  J. Tseng-Crank et al. / Open Journal of Genetics 3 (2013) 9-86 55 Continued ENPP2 ectonucleotide pyrophosphatase/ phosphodiesterase 2 (autotaxin) NM_015744 0 0.63413.7330 −0.484 5.976 0 −1.215 13.099 ENPP3 ectonucleotide pyrophosphatase/ phosphodiesterase 3 NM_134005 0.0960.4727.5010.253−0.175 8.227 0.031 −0.667 7.029 ENPP5 Ectonucleotide pyrophosphatase/ phosphodiesterase 5 (putative function) NM_032003 0.020.66311.6210.352−0.216 11.837 0.006 −0.879 10.958 GRK5 G protein-coupled receptor kinase 5 NM_018869 0.166−0.24210.3660.0280.436 9.93 0.004 0.67810.608 IRAK1 interleukin-1 receptor-associated kinase 1 NM_008363 0.0080.41711.9850.062−0.131 8.168 0.003 −0.53 11.568 MAPK9 mitogen-activated protein kinase 9 NM_016961 0.060.2157.4490.012−0.33 7.779 0.001 −0.545 7.234 NAMPT nicotinamide phosphoribosyltransferase NM_021524 0.0260.2077.3550.001−0.512 10.566 0 −0.529 7.147 NEK2 NIMA (never in mitosis gene a) related kinase 2 −−− 0.2530.0122.1350.0511.088 3.839 0.024 1.33 5.169 NMNAT1 nicotinamide nucleotide adenylyltransferase 1 NM_133435 0.039−0.2986.9040.0110.409 6.495 0.001 0.708 7.203 NMNAT3 (includes EG:349565) nicotinamide nucleotide adenylyltransferase 3 NM_144533 0.801−0.0516.6030.025−0.574 7.177 0.035 −0.522 6.654 NNT nicotinamide nucleotide transhydrogenase NM_008710 0.0860.2519.1470.002−0.481 7.964 0 −0.66 7.304 NT5E 5’-nucleotidase, ecto (CD73) NM_011851 0.0021.2335.6670.003 −1.063 6.73 0 −2.296 4.434 PAK1 p21/Cdc42/Rac1-activated kinase 1 (STE20 homolog, yeast) NM_011035 0.036−0.9627.9840.3010.477 7.838 0.013 1.4469.283 PCTK3 PCTAIRE protein kinase 3 NM_008795 0.052−1.766 6.5420.001 3.965 2.577 0 5.738.308 PIM1 pim-1 oncogene NM_008842 0.032−1.33.5450.4590.18 8.558 0.06 1.086 4.845 PRKAA1 protein kinase, AMP-activated, alpha 1 catalytic subunit NM_0010133670.0090.4086.520.001 −0.631 7.151 0 −1.039 6.112 PRKCD protein kinase C, delta NM_011103 0.15−0.27311.2390.0330.451 10.788 0.004 0.724 11.512 PRKCH protein kinase C, eta NM_008856 0.087−0.743 10.472 0.0270.997 7.892 0.003 1.594 9.486 PRPF4B PRP4 pre-mRNA processing factor 4 homolog B (yeast) NM_013830 0.0080.3458.0060.071−0.264 9.994 0.002 −0.563 8.844 VNN1 vanin 1 NM_011704 0.0030.913 9.7470.0190.614 9.133 0.173 −0.38.834 VNN2 vanin 2 NM_011979 0.0051.42910.815 0.745 −0.118 10.932 0.004 −1.547 9.386 Fatty Acid Biosynthesis ACACA acetyl-Coenzyme A carboxylase alpha NM_133360 0.0340.83312.656 0.009−2.07 5.182 0.001 −1.73 11.823 ACACB acetyl-Coenzyme A carboxylase beta NM_133904 0.031.164 9.5080.8930.059 9.449 0.036 −1.106 8.344 FASN fatty acid synthase NM_007988 0.2620.18514.6060.017−0.48 15.086 0.004 −0.665 14.421 MCCC2 methylcrotonoyl-Coenzyme A carboxylase 2 (beta) NM_030026 0.0090.52112.30.096−0.275 12.575 0.001 −0.796 11.779 PCCB propionyl Coenzyme A carboxylase, beta polypeptide NM_025835 0.0150.85212.850.714−0.099 12.95 0.009 −0.951 11.999 Glycerolipid Metabolism ADHFE1 alcohol dehydrogenase, iron containing, 1 NM_175236 0.0240.50613.3250.188−0.253 13.578 0.004 −0.76 12.819 Copyright © 2013 SciRes. OPEN ACCESS  J. Tseng-Crank et al. / Open Journal of Genetics 3 (2013) 9-86 56 Continued AGPAT5 1-acylglycerol-3- phosphate O-acyltransferase 5 (lysophosphatidic acid acyltransferase, epsilon) NM_026792 0.006−0.45310.340.2430.2 9.39 0.002 0.57410.793 AKR1B10 aldo-keto reductase family 1, member B10 (aldose reductase) NM_172398 0.026−0.3411.3590.0230.349 11.01 0.001 0.69 11.699 ALDH2 aldehyde dehydrogenase 2 family (mitochondrial) NM_009656 0.0220.5338.2980.104−0.302 13.448 0.003 −0.75612.692 ALDH5A1 aldehyde dehydrogenase 5 family, member A1 (succinate-semialdehyde dehydrogenase) NM_172532 0.0120.80210.1080.459−0.18 10.288 0.004 −0.982 9.306 ALDH7A1 aldehyde dehydrogenase 7 family, member A1 NM_138600 0.0630.44812.2810.129−0.346 12.627 0.006 −0.793 11.833 APOC2 apolipoprotein C-II NM_009695 0.187−0.449.3160.0730.639 8.677 0.01 1.089.756 CERK (includes EG:64781) ceramide kinase NM_145475 0.153−0.4869.4490.0590.686 8.763 0.007 1.172 9.935 DAGLB diacylglycerol lipase, beta NM_144915 0.054−0.52710.1140.080.466 9.649 0.004 0.992 10.641 DGKZ diacylglycerol kinase, zeta 104 kDa NM_138306 0.106−0.39911.3970.0170.6 7.504 0.004 0.841 8.345 GK glycerol kinase NM_008194 0.03−0.8977.8210.5640.193 6.204 0.018 1.006 7.21 GLA galactosidase, alpha NM_013463 0.045−1.0088.5 0.0510.969 7.53 0.002 1.9779.508 GLB1 galactosidase, beta 1 −−− 0.0440.9177.970.0040.282 10.92 0.001 0.36911.288 GLB1L galactosidase, beta 1-like −−− 0.0050.6368.0140.207−0.019 2.343 0.006 −0.615 7.378 GLB1L2 galactosidase, beta 1-like 2 NM_153803 0.0280.50814.0960.033−0.47 13.134 0.002 −0.879 12.256 GLYCTK glycerate kinase NM_0010395860.155−0.6223.750.0690.844 2.906 0.008 1.4664.371 GPAM glycerol-3-phosphate acyltransferase, mitochondrial NM_008149 0.0190.9779.2150.15−0.377 13.572 0.005 −1.3268.238 LIPA lipase A, lysosomal acid, cholesterol esterase (Wolman disease) NM_0011111000.044 −0.9719.896 0.027 0.828 12.45 0.002 1.49813.949 LIPF lipase, gastric NM_026334 0.21−1.319 8.1530.013.418 4.734 0.002 4.7389.472 MGLL monoglyceride lipase NM_011844 0.0030.27414.6770.0190.185 14.492 0.017 0.819 5.255 MOGAT1 monoacylglycerol O-acyltransferase 1 NM_026713 0.0451.2310.980.274 −0.589 11.569 0.009 −1.819 9.75 PNPLA3 patatin-like phospholipase domain containing 3 NM_054088 0.3090.3519.1540.157−0.51 9.663 0.033 −0.861 8.803 PPAP2A phosphatidic acid phosphatase type 2A NM_008247 0.154−0.30811.420.3090.21 11.209 0.033 0.51811.728 SPHK1 sphingosine kinase 1 NM_011451 0.017−1.1734.7660.1130.668 4.098 0.002 1.8415.939 TCAG7.1260 similar to aldo-keto reductase family 1, member B10 NM_008012 0.059−0.59312.1790.5990.143 12.036 0.027 0.736 12.772 Glutathione Metabolism G6PD2 glucose-6-phosphate dehydrogenase 2 NM_008062 0.0860.20811.5920.0010.59 11.002 0.009 0.38111.384 GCLM glutamate-cysteine ligase, modifier subunit NM_008129 0.138−0.358 10.5770.366 −0.214 7.458 0.04 0.546 10.935 GGT6 gamma-glutamyltransferase 6 NM_027819 0.002−1.324.6 0.1230.479 4.12 0 1.799 5.919 GPX3 glutathione peroxidase 3 (plasma) NM_0010839290.0080.69215.37 0.063 −0.41 15.78 0.001 −1.102 14.677 GSTA3 glutathione S-transferase A3 NM_0010773530.0610.95311.4150.127 −0.725 9.233 0.006 −1.656 7.577 Copyright © 2013 SciRes. OPEN ACCESS  J. Tseng-Crank et al. / Open Journal of Genetics 3 (2013) 9-86 57 Continued GSTA4 glutathione S-transferase A4 NM_0103570.040.85311.3860.122−0.589 11.975 0.004 −1.441 10.533 GSTO1 glutathione S-transferase omega 1 NM_0103620.102−0.28310.549 0.0060.46312.792 0.001 0.67313.464 GSTT1 glutathione S-transferase theta 1 NM_0081850.0130.59 12.7910.026−0.502 13.293 0.001 −1.09212.201 GSTT2 glutathione S-transferase theta 2 NM_0103610.006 0.68311.146 0.63 −0.086 11.232 0.004 −0.77 10.463 GSTT3 glutathione S-transferase, theta 3 NM_1339940.022 0.8628.1330.007 −1.124 9.257 0 −1.987 7.271 H6PD hexose-6-phosphate dehydrogenase (glucose 1-dehydrogenase) NM_1733710.0020.68814.002 0.939 −0.011 14.013 0.002 −0.69913.314 IDH2 isocitrate dehydrogenase 2 (NADP+), mitochondrial NM_1730110.0140.50513.0760.9510.01 13.067 0.016 −0.49612.571 LNPEP leucyl/cystinyl aminopeptidase NM_1728270.002 0.53911.7720.05 −0.046 2.178 0 −0.78711.232 LTC4S leukotriene C4 synthase NM_0085210.665−0.04214.4760 0.74813.728 0 0.79 14.517 MGST2 microsomal glutathione S-transferase 2 NM_1749950.043−0.45710.7390.3270.19210.547 0.011 0.64911.196 PGDS prostaglandin D2 synthase, hematopoietic NM_0194550.112−1.7157.268 0.1031.77 5.498 0.009 3.4858.984 RAB15 RAB15, member RAS onocogene family NM_1340500.18 −0.6697.353 0.106 0.8376.516 0.014 1.507 8.023 TRHDE thyrotropin-releasing hormone degrading enzyme NM_1462410.1180.9914.864 0.058 −1.276.134 0.006 −2.261 3.873 Lysine Biosynthesis AASDHPPT aminoadipate-semialdehyde dehydrogenase- phosphopantetheinyl transferase NM_0262760.0170.56 7.3370.036−0.463 7.8 0.001 −1.024 6.777 VNN1 vanin 1 NM_0117040.0030.9139.747 0.019 0.6149.133 0.173 −0.3 8.834 VNN2 vanin 2 NM_0119790.0051.42910.8150.745 −0.118 10.932 0.004 −1.547 9.386 Pyruvate Metabolism ACACA acetyl-Coenzyme A carboxylase alpha NM_1333600.034 0.83312.6560.009−2.075.182 0.001 −1.73 11.823 ACACB acetyl-Coenzyme A carboxylase beta NM_1339040.03 1.1649.5080.893 0.0599.449 0.036 −1.106 8.344 ACSM5 acyl-CoA synthetase medium-chain family member 5 NM_1787580.0291.7816.6830.783 −0.181 6.864 0.019 −1.963 4.901 AKR1B10 aldo-keto reductase family 1, member B10 (aldose reductase) NM_1723980.026−0.3411.3590.023 0.34911.01 0.001 0.69 11.699 ALDH2 aldehyde dehydrogenase 2 family (mitochondrial) NM_0096560.0220.5338.2980.104 −0.302 13.448 0.003 −0.75612.692 ALDH5A1 aldehyde dehydrogenase 5 family, member A1 (succinate-semialdehyde dehydrogenase) NM_1725320.0120.80210.1080.459−0.1810.288 0.004 −0.982 9.306 ALDH7A1 aldehyde dehydrogenase 7 family, member A1 NM_1386000.0630.44812.281 0.129 −0.346 12.627 0.006 −0.79311.833 BCKDHA branched chain keto acid dehydrogenase E1, alpha polypeptide NM_0075330.0370.65513.087 0.968−0.0113.097 0.035 −0.66612.431 LDHB lactate dehydrogenase B NM_0084920.0780.39113.6270.192−0.278 12.671 0.016 −0.60813.236 LDHD lactate dehydrogenase D NM_0275700.0330.88 9.4910.574−0.179 9.868 0.055 −0.7628.611 NKD1 naked cuticle homolog 1 (Drosophila) NM_0272800.147−0.3838.007 0.177 0.3536.959 0.021 0.7038.389 NUDT7 nudix (nucleoside diphosphate linked moiety X)-type motif 7 NM_0244370.001−0.56811.7350.0580.31312.288 0 0.77612.302 Copyright © 2013 SciRes. OPEN ACCESS  J. Tseng-Crank et al. / Open Journal of Genetics 3 (2013) 9-86 58 Continued PC pyruvate carboxylase NM_008797 0.0530.35514.5850.334−0.157 14.741 0.013 −0.511 14.23 PCK1 phosphoenolpyruvate carboxykinase 1 (soluble) NM_011044 0.0022.193 12.8270.7830.181 12.921 0.002 −2.229 10.633 PDHA1 (includes EG:5160) pyruvate dehydrogenase (lipoamide) alpha 1 NM_008810 0.0120.25514.6660.003−0.349 15.014 0 −0.603 14.411 PDHB pyruvate dehydrogenase (lipoamide) beta NM_024221 0.3060.14914.0830.019−0.774 10.036 0.006 −0.54113.934 RWDD2B RWD domain containing 2B NM_016924 0.014−0.67.6270.7470.061 7.566 0.009 0.661 8.227 TCAG7.1260 similar to aldo-keto reductase family 1, member B10 NM_008012 0.059−0.59312.1790.5990.143 12.036 0.027 0.736 12.772 Aminosugars Metabolism CHI3L3 chitinase 3-like 3 NM_009892 0.047−0.9976.054 0.0780.85 5.203 0.003 1.8477.05 CMAH cytidine monophosphate- N-acetylneuraminic acid hydroxylase(CMP-N- acetylneuraminate monooxygenase) pseudogene NM_0011111100.0380.5635.526 0.181 −0.07 3.162 0.13 −0.3754.964 CMAS cytidine monophosphate N-acetylneuraminic acid synthetase NM_009908 0.102−0.22311.7270.0340.314 11.413 0.003 0.53711.95 CYB561 cytochrome b-561 BE133856 0.2310.0522.1780.1460.39 9.951 0.049 0.57110.522 HK1 hexokinase 1 NM_010438 0.0420.8137.6970.1950.464 7.233 0.316 −0.3496.884 HK2 hexokinase 2 NM_013820 0.310.19511.4540.024−0.519 11.973 0.006 −0.71311.259 HK3 hexokinase 3 (white cell) NM_0010332450.03−0.9668.121 0.017 1.122 6.999 0.001 2.0879.086 NANS N-acetylneuraminic acid synthase (sialic acid synthase) NM_053179 0.002−0.6639.190.0250.229 11.614 0 0.545 12.159 PDE1A phosphodiesterase 1A, calmodulin-dependent NM_0010099780.003 1.2398.6990.059 −0.608 9.306 0 −1.847 7.46 PDE2A phosphodiesterase 2A, cGMP-stimulated NM_0010085480.148 −0.25210.0920.0040.683 9.41 0.001 0.935 10.345 PDE3B phosphodiesterase 3B, cGMP-inhibited NM_011055 0.0030.49113.1190.129−0.179 13.298 0 −0.6712.628 PDE4B phosphodiesterase 4B, cAMP-specific (phosphodiesterase E4 dunce homolog, Drosophila) NM_019840 0 1.1048.990.0010.883 8.107 0.222 −0.2227.885 PDE7A phosphodiesterase 7A NM_0011227590.14−0.4368.998 0.003 1.237 8.55 0.001 1.448 9.997 PDE7B phosphodiesterase 7B NM_013875 0.11−0.6729.4160.1130.666 8.75 0.009 1.339 10.088 PDE8B phosphodiesterase 8B NM_172263 0.043−1.0833.1460.8030.111 3.035 0.03 1.194 4.229 PGM3 phosphoglucomutase 3 NM_028352 0.1350.358.5210.451−0.164 8.685 0.044 −0.5148.172 RENBP renin binding protein NM_023132 0.019−0.63210.6410.0290.571 10.07 0.001 1.204 11.273 UAP1 UDP-N-acteylglucosamine pyrophosphorylase 1 NM_133806 0.0060.43410.8550.123−0.229 9.853 0.002 −0.54710.421 Phenylalanine Metabolism ALDH2 aldehyde dehydrogenase 2 family (mitochondrial) NM_009656 0.0220.5338.2980.104−0.302 13.448 0.003 −0.75612.692 ALDH3B1 aldehyde dehydrogenase 3 family, member B1 NM_026316 0.017−0.567.8480.0460.431 7.417 0.001 0.992 8.409 AOC3 amine oxidase, copper containing 3 (vascular adhesion protein 1) NM_009675 0.0050.5314.4160.186−0.191 14.607 0.001 −0.72113.886 DBT dihydrolipoamide branched chain transacylase E2 NM_010022 0.0240.64110.5120.138−0.369 10.882 0.003 −1.01 9.871 Copyright © 2013 SciRes. OPEN ACCESS  J. Tseng-Crank et al. / Open Journal of Genetics 3 (2013) 9-86 59 Continued DHCR24 24-dehydrocholesterol reductase NM_053272 0.012−0.7888.5270.8690.039 8.489 0.009 0.827 9.315 GOT1 glutamic-oxaloacetic transaminase 1, soluble (aspartate aminotransferase 1) NM_010324 0.798−0.0529.4890.0380.51 8.978 0.026 0.5639.541 MAOA monoamine oxidase A NM_173740 0.01−0.52312.2620.582 −0.229 7.565 0.008 0.559 12.784 MAOB monoamine oxidase B NM_172778 0.0380.46312.20.035−0.473 12.673 0.002 −0.93611.737 MIF macrophage migration inhibitory factor (glycosylation-inhibiting factor) NM_010798 0.049−0.25613.2820.0370.277 13.005 0.002 0.53413.539 Tyrosine Metabolism ADHFE1 alcohol dehydrogenase, iron containing, 1 NM_175236 0.0240.50613.3250.188−0.253 13.578 0.004 −0.76 12.819 ALDH2 aldehyde dehydrogenase 2 family (mitochondrial) NM_009656 0.0220.5338.2980.104−0.302 13.448 0.003 −0.75612.692 ALDH3B1 aldehyde dehydrogenase 3 family, member B1 NM_026316 0.017−0.567.8480.0460.431 7.417 0.001 0.992 8.409 AOC3 amine oxidase, copper containing 3 (vascular adhesion protein 1) NM_009675 0.0050.5314.4160.186−0.191 14.607 0.001 −0.72113.886 BCKDHA branched chain keto acid dehydrogenase E1, alpha polypeptide NM_007533 0.0370.65513.0870.968−0.01 13.097 0.035 −0.66612.431 DBT dihydrolipoamide branched chain transacylase E2 NM_010022 0.0240.64110.5120.138−0.369 10.882 0.003 −1.01 9.871 FRRS1 ferric-chelate reductase 1 NM_0011134780.039−0.5429.8680.0380.545 9.323 0.002 1.087 10.41 GOT1 glutamic-oxaloacetic transaminase 1, soluble (aspartate aminotransferase 1) NM_010324 0.798−0.0529.4890.0380.51 8.978 0.026 0.5639.541 MAOA monoamine oxidase A NM_173740 0.01−0.52312.2620.582 −0.229 7.565 0.008 0.559 12.784 MAOB monoamine oxidase B NM_172778 0.0380.46312.20.035−0.473 12.673 0.002 −0.93611.737 MIF macrophage migration inhibitory factor (glycosylation-inhibiting factor) NM_010798 0.049−0.25613.2820.0370.277 13.005 0.002 0.53413.539 Histidine Metabolism ALDH2 aldehyde dehydrogenase 2 family (mitochondrial) NM_009656 0.0220.5338.2980.104−0.302 13.448 0.003 −0.75612.692 ALDH3B1 aldehyde dehydrogenase 3 family, member B1 NM_026316 0.017−0.567.8480.0460.431 7.417 0.001 0.992 8.409 ALDH5A1 aldehyde dehydrogenase 5 family, member A1 (succinate-semialdehyde dehydrogenase) NM_172532 0.0120.80210.1080.459−0.18 10.288 0.004 −0.9829.306 ALDH7A1 aldehyde dehydrogenase 7 family, member A1 NM_138600 0.0630.44812.2810.129−0.346 12.627 0.006 −0.79311.833 AOC3 amine oxidase, copper containing 3 (vascular adhesion protein 1) NM_009675 0.0050.5314.4160.186−0.191 14.607 0.001 −0.72113.886 DBT dihydrolipoamide branched chain transacylase E2 NM_010022 0.0240.64110.5120.138−0.369 10.882 0.003 −1.019.871 HARS2 histidyl-tRNA synthetase 2, mitochondrial (putative) NM_080636 0.0140.569.2060.5220.12 5.406 0.02 −0.5168.646 HNMT histamine N-methyltransferase NM_080462 0.0180.45211.0340.211−0.199 11.233 0.003 −0.65110.582 MAOA monoamine oxidase A NM_173740 0.01−0.52312.2620.582 −0.229 7.565 0.008 0.559 12.784 MAOB monoamine oxidase B NM_172778 0.0380.46312.20.035−0.473 12.673 0.002 −0.93611.737 PRPS1 phosphoribosyl pyrophosphate synthetase 1 NM_021463 0.038−0.47213.710.0050.76 12.225 0 1.18513.41 Copyright © 2013 SciRes. OPEN ACCESS  J. Tseng-Crank et al. / Open Journal of Genetics 3 (2013) 9-86 60 Continued Galactose Metabolism AKR1B10 aldo-keto reductase family 1, member B10 (aldose reductase) NM_172398 0.026−0.3411.3590.0230.34911.01 0.001 0.69 11.699 GAA glucosidase, alpha; acid (Pompe disease, glycogen storage disease type II) NM_008064 0.0030.66810.9840.3950.13310.851 0.006 −0.318 9.011 GLA galactosidase, alpha NM_013463 0.045−1.0088.50.051 0.9697.53 0.002 1.977 9.508 GLB1 galactosidase, beta 1 AW553762 0.0440.9177.970.0040.28210.92 0.001 0.369 11.288 GLB1L galactosidase, beta 1-like BB207162 0.0050.6368.0140.207−0.0192.343 0.006 −0.615 7.378 GLB1L2 galactosidase, beta 1-like 2 NM_153803 0.0280.50814.0960.033−0.4713.134 0.002 −0.879 12.256 HK1 hexokinase 1 NM_010438 0.0420.8137.6970.1950.4647.233 0.316 −0.349 6.884 HK2 hexokinase 2 NM_013820 0.310.19511.4540.024−0.51911.973 0.006 −0.713 11.259 HK3 hexokinase 3 (white cell) NM_0010332450.03−0.966 8.1210.017 1.1226.999 0.001 2.087 9.086 PFKM phosphofructokinase, muscle NM_021514 0.0310.4979.3840.311−0.1989.582 0.007 −0.694 8.888 PGM1 phosphoglucomutase 1 NM_025700 0.070.34613.5570.353−0.1613.716 0.018 −0.506 13.21 PGM3 phosphoglucomutase 3 NM_028352 0.1350.358.5210.451−0.1648.685 0.044 −0.514 8.172 TCAG7.1260 similar to aldo-keto reductase family 1, member B10 NM_008012 0.059−0.59312.1790.5990.14312.036 0.027 0.736 12.772 UGP2 UDP-glucose pyrophosphorylase 2 NM_139297 0.0090.32513.3740.002−0.46811.745 0 −0.747 10.998 Fatty Acid Metabolism 9330129D05RIK RIKEN cDNA 9330129D05 gene XM_488540 0.0031.0829.4480.2980.269.188 0.011 −0.822 8.366 ACAA1B acetyl-Coenzyme A acyltransferase 1B NM_130864 0.138−0.28513.1070.0090.61712.489 0.001 0.902 13.391 ACAD10 acyl-Coenzyme A dehydrogenase family, member 10 NM_028037 0.0080.9068.3870.370.0682.183 0.003 −1.1 7.481 ACAD11 acyl-Coenzyme A dehydrogenase family, member 11 NM_028721 0.0090.58712.5080.3760.18513.851 0.03 −0.442 11.922 ACAD8 acyl-Coenzyme A dehydrogenase family, member 8 NM_025862 0.0050.5379.1940.004−0.5599.753 0 −1.097 8.657 ACADSB acyl-Coenzyme A dehydrogenase, short/branched chain NM_025826 0.0230.50512.4850.09−0.33812.823 0.002 −0.843 11.98 ACOX3 acyl-Coenzyme A oxidase 3, pristanoyl NM_030721 0.3240.1827.4670.0140.5716.896 0.061 0.388 7.285 ADHFE1 alcohol dehydrogenase, iron containing, 1 NM_175236 0.0240.50613.3250.188−0.25313.578 0.004 −0.76 12.819 ALDH2 aldehyde dehydrogenase 2 family (mitochondrial) NM_009656 0.0220.5338.2980.104−0.30213.448 0.003 −0.756 12.692 ALDH5A1 aldehyde dehydrogenase 5 family, member A1 (succinate-semialdehyde dehydrogenase) NM_172532 0.0120.80210.1080.459−0.1810.288 0.004 −0.982 9.306 ALDH7A1 aldehyde dehydrogenase 7 family, member A1 NM_138600 0.0630.44812.2810.129−0.34612.627 0.006 −0.793 11.833 CPT1A carnitine palmitoyltransferase 1A (liver) NM_013495 0.6090.07312.7110.0050.57812.134 0.009 0.505 12.638 CYP2C44 cytochrome P450, family 2, subfamily c, polypeptide 44 NM_0010014460.001 −2.814 5.5490.002 2.4053.144 0 5.219 8.363 CYP2C70 cytochrome P450, family 2, subfamily c, polypeptide 70 NM_145499 0.038−1.2892.7230.4260.4182.305 0.012 1.707 4.012 Copyright © 2013 SciRes. OPEN ACCESS  J. Tseng-Crank et al. / Open Journal of Genetics 3 (2013) 9-86 61 Continued CYP2D6 cytochrome P450, family 2, subfamily D, polypeptide 6 NM_019823 0.0011.078.3480.004−0.434 9.841 0 −0.988.862 CYP2F1 cytochrome P450, family 2, subfamily F, polypeptide 1 NM_007817 0.4430.794.8290.003−4.431 9.26 0.001 −5.221 4.039 CYP2J2 cytochrome P450, family 2, subfamily J, polypeptide 2 NM_010008 0.0880.2837.9180.127−0.246 8.165 0.008 −0.53 7.635 CYP4B1 cytochrome P450, family 4, subfamily B, polypeptide 1 NM_007823 0.1080.19510.7870.0010.599 10.188 0.007 0.40410.592 ECHS1 enoyl Coenzyme A hydratase, short chain, 1, mitochondrial NM_053119 0.0410.41113.8740.457−0.127 14.001 0.014 −0.53913.463 EHHADH enoyl-Coenzyme A, hydratase/3-hydroxyacyl Coenzyme A dehydrogenase NM_023737 0.0440.60510.0520.570.145 9.907 0.103 −0.46 9.447 GCDH glutaryl-Coenzyme A dehydrogenase NM_0010447440.0460.49110.4130.859 −0.037 10.45 0.036 −0.528 9.922 IVD isovaleryl Coenzyme A dehydrogenase NM_019826 0.0130.84713.68 0.052 −0.55 11.655 0.001 −1.253 10.402 SLC27A1 solute carrier family 27 (fatty acid transporter), member 1 NM_011977 0.0040.813 11.7680.0160.619 11.149 0.342 −0.19410.955 Riboflavin Metabolism ACP6 acid phosphatase 6, lysophosphatidic NM_019800 0.5420.1288.7040.037−0.526 9.229 0.016 −0.654 8.575 ENPP1 ectonucleotide pyrophosphatase/ phosphodiesterase 1 NM_008813 0.046−1.4055.350.1850.845 4.505 0.007 2.25 6.755 ENPP2 ectonucleotide pyrophosphatase/ phosphodiesterase 2 (autotaxin) NM_015744 0 0.63413.7330 −0.484 5.976 0 −1.21513.099 ENPP3 ectonucleotide pyrophosphatase/ phosphodiesterase 3 NM_134005 0.0960.4727.5010.253−0.175 8.227 0.031 −0.667 7.029 ENPP5 ectonucleotide pyrophosphatase/ phosphodiesterase 5 (putative function) NM_032003 0.020.66311.6210.352−0.216 11.837 0.006 −0.87910.958 PPAPDC2 phosphatidic acid phosphatase type 2 domain containing 2 NM_028922 0.0320.6718.2770.071−0.532 8.809 0.002 −1.203 7.606 Citrate Cycle ACLY ATP citrate lyase NM_134037 0.3110.3812.3370.003−0.937 14.13 0.001 −1.142 12.988 ACO1 aconitase 1, soluble NM_007386 0.0140.29512.2580.008−0.335 12.593 0 −0.63 11.963 ACO2 aconitase 2, mitochondrial NM_080633 0.020.57613.9860.2540.005 2.126 0.017 −0.603 13.41 DLST dihydrolipoamide S-succinyltransferase (E2 component of 2-oxo-glutarate complex) NM_030225 0.0020.6395.3890.078−0.247 13.008 0.001 −0.676 4.75 IDH2 isocitrate dehydrogenase 2 (NADP+), mitochondrial NM_173011 0.0140.50513.0760.9510.01 13.067 0.016 −0.49612.571 PC pyruvate carboxylase NM_008797 0.0530.35514.5850.334−0.157 14.741 0.013 −0.511 14.23 PCK1 phosphoenolpyruvate carboxykinase 1 (soluble) NM_011044 0.0022.193 12.8270.7830.181 12.921 0.002 −2.22910.633 SDHA succinate dehydrogenase complex, subunit A, flavoprotein (Fp) NM_023281 0.0030.42813.7290.069−0.199 13.927 0 −0.62613.301 SUCLG2 succinate-CoA ligase, GDP-forming, beta subunit NM_011507 0.0360.72910.320.106−0.329 12.734 0.004 −0.776 11.958 Pantothenate and CoA Biosynthesis BCAT1 branched chain aminotransferase 1, cytosolic NM_0010244680.448 −0.6187.920.0180.877 3.754 0.007 1.0914.845 Copyright © 2013 SciRes. OPEN ACCESS  J. Tseng-Crank et al. / Open Journal of Genetics 3 (2013) 9-86 62 Continued BCAT2 branched chain aminotransferase 2, mitochondrial NM_0097370.10.5138.9350.339 −0.276 9.211 0.024 −0.789 8.422 DPYD dihydropyrimidine dehydrogenase NM_1707780.0130.6379.480.055 −0.441 9.921 0.001 −1.078 8.843 ENPP1 Ectonucleotide pyrophosphatase/ phosphodiesterase 1 NM_0088130.046 −1.4055.350.1850.845 4.505 0.007 2.25 6.755 ENPP2 ectonucleotide pyrophosphatase/ phosphodiesterase 2 (autotaxin) NM_0157440 0.63413.7330 −0.484 5.976 0 −1.215 13.099 ENPP3 ectonucleotide pyrophosphatase/ phosphodiesterase 3 NM_1340050.0960.4727.5010.253 −0.175 8.227 0.031 −0.667 7.029 ENPP5 ectonucleotide pyrophosphatase/ phosphodiesterase 5 (putative function) NM_0320030.020.66311.621 0.352 −0.216 11.837 0.006 −0.879 10.958 One Carbon Pool by Folate EHD4 EH-domain containing 4 NM_1338380.045−0.47211.3460.3440.193 11.152 0.012 0.666 11.818 GART phosphoribosylglycinamide formyltransferase, phosphoribosylglycinamide synthetase, phosphoribosylaminoimidazole synthetase NM_0102560.0260.7336.0310.158 −0.407 6.439 0.004 −1.14 5.299 MTFMT mitochondrial methionyl-tRNA formyltransferase NM_0271340.0240.535 8.7130.6440.157 4.964 0.036 −0.4798.178 MTHFD1 methylenetetrahydrofolate dehydrogenase (NADP+ dependent) 1, methenyltetrahydrofolate cyclohydrolase, formyltetrahydrofolate synthetase NM_1387450.1920.27710.105 0.171 −0.293 10.398 0.022 −0.571 9.827 MTHFD1L methylenetetrahydrofolate dehydrogenase (NADP+ dependent) 1-like NM_1723080.146 −0.4084.8510.240.319 4.531 0.024 0.727 5.258 MTHFD2 methylenetetrahydrofolate dehydrogenase (NADP + dependent) 2, methenyltetrahydrofolate cyclohydrolase NM_0086380.027 −0.6168.2410.1740.329 7.912 0.004 0.945 8.857 PDPR pyruvate dehydrogenase phosphatase regulatory subunit BB667201 0.0020.44210.1520.006−0.341 10.493 0 −0.7839.71 TYMS thymidylate synthetase NM_0212880.03−0.558.0220.2750.235 7.787 0.006 0.785 8.572 Nitrogen Metabolism ASNS asparagine synthetase NM_0120550.0120.54312.5030.022−0.475 12.978 0.001 −1.01811.96 CA13 carbonic anhydrase XIII NM_0244950.5080.1783.4180.017−0.632 7.984 0.014 −0.661 7.323 CA3 carbonic anhydrase III, muscle specific NM_0076060.0080.17415.645 0.208 −0.833 12.791 0.003 −2.866 9.925 CA4 carbonic anhydrase IV NM_0076070.0310.7079.4660.0160.832 8.634 0.547 0.17 8.01 CA5B carbonic anhydrase VB, mitochondrial NM_0195130.015 0.97411.934 0.189 −0.239 11.687 0.006 −1.222 10.96 CA8 carbonic anhydrase VIII NM_0075920.2070.3395.4730.24−0.312 5.786 0.034 −0.6515.135 CA9 carbonic anhydrase IX NM_1393050.104−1.2513.2290.4620.517 2.712 0.035 1.768 4.48 Copyright © 2013 SciRes. OPEN ACCESS  J. Tseng-Crank et al. / Open Journal of Genetics 3 (2013) 9-86 63 Continued CTH cystathionase (cystathionine gamma-lyase) NM_145953 0.02−0.6999.1250.2680.276 8.849 0.005 0.975 9.824 PDPR pyruvate dehydrogenase phosphatase regulatory subunit BB667201 0.0020.44210.1520.006−0.341 10.493 0 −0.783 9.71 PTPRG protein tyrosine phosphatase, receptor type, G NM_008981 0.0010.4998.830.009−0.328 9.158 0 −0.8278.331 VNN1 vanin 1 NM_011704 0.0030.913 9.7470.0190.614 9.133 0.173 −0.3 8.834 VNN2 vanin 2 NM_011979 0.0051.42910.815 0.745 −0.118 10.932 0.004 −1.5479.386 Alanine and Aspartate Metabolism ADSL adenylosuccinate lyase NM_009634 0.1980.2810.0820.214−0.269 10.351 0.029 −0.55 9.801 ADSSL1 adenylosuccinate synthase like 1 NM_007421 0.023−0.956 9.522 0.016 1.041 8.481 0.001 1.996 10.477 ASNS asparagine synthetase NM_012055 0.0120.54312.5030.022−0.475 12.978 0.001 −1.01811.96 ASS1 argininosuccinate synthetase 1 NM_007494 0.002−1.8456.4650.6940.154 6.31 0.002 1.999 8.309 CRAT carnitine acetyltransferase NM_007760 0.0030.60711.470.3120.123 4.974 0.002 −0.617 10.863 DDO D-aspartate oxidase NM_027442 0.0430.6627.7980.144 −0.436 8.234 0.005 −1.099 7.136 GOT1 glutamic-oxaloacetic transaminase 1, soluble (aspartate aminotransferase 1) NM_010324 0.798−0.0529.4890.0380.51 8.978 0.026 0.5639.541 GPT2 glutamic pyruvate transaminase (alanine aminotransferase) 2 NM_173866 0.020.91711.372 0.027 −0.589 11.014 0.001 −1.1959.819 PC pyruvate carboxylase NM_008797 0.0530.35514.5850.334−0.157 14.741 0.013 −0.51114.23 PDHA1 (includes EG:5160) pyruvate dehydrogenase (lipoamide) alpha 1 NM_008810 0.0120.25514.6660.003−0.349 15.014 0 −0.603 14.411 PDHB pyruvate dehydrogenase (lipoamide) beta NM_024221 0.3060.14914.0830.019−0.774 10.036 0.006 −0.54113.934 Inositol Phosphate Metabolism ACVR2A activin A receptor, type IIA NM_007396 0.06−0.3955.9980.1090.322 5.676 0.005 0.717 6.393 AKT2 v-akt murine thymoma viral oncogene homolog 2 NM_001110200.020.69211.060.489 0.164 10.896 0.016 −0.43913 ARAF v-raf murine sarcoma 3611 viral oncogene homolog NM_009703 0.0380.37610.450.2580.245 11.406 0.02 −0.912 3.647 CDC2 cell division cycle 2, G1 to S and G2 to M NM_007659 0.013−1.3958.3420.021.253 7.088 0 2.6489.736 CDK6 cyclin-dependent kinase 6 NM_009873 0.024−0.7629.0290.0930.629 7.834 0.003 1.211 9.791 CDK7 cyclin-dependent kinase 7 NM_009874 0.043−0.5915.7520.161 −0.283 6.617 0.023 −0.5336.084 CSNK1D casein kinase 1, delta NM_027874 0.0360.59310.450.253−0.043 2.526 0.026 −0.3459.897 EIF2AK2 eukaryotic translation initiation factor 2-alpha kinase 2 NM_011163 0.0340.586.3760.2610.163 6.524 0.088 −0.4335.796 GRK5 G protein-coupled receptor kinase 5 NM_018869 0.166−0.24210.3660.0280.436 9.93 0.004 0.67810.608 INPP1 inositol polyphosphate-1-phosphatase NM_008384 0.0120.7988.6960.9870.004 8.692 0.013 −0.7947.898 INPP5D inositol polyphosphate-5-phosphatase, 145 kDa NM_0011101920.028−0.5397.4770.0830.388 6.693 0.006 0.776 8.016 INPP5E Inositol polyphosphate-5-phosphatase, 72 kDa NM_033134 0.0360.3738.1940.202−0.2 8.394 0.006 −0.5737.821 IRAK1 interleukin-1 receptor-associated kinase 1 NM_008363 0.0080.41711.9850.062−0.131 8.168 0.003 −0.53 11.568 Copyright © 2013 SciRes. OPEN ACCESS  J. Tseng-Crank et al. / Open Journal of Genetics 3 (2013) 9-86 64 Continued MAPK9 mitogen-activated protein kinase 9 NM_016961 0.060.2157.4490.012−0.33 7.779 0.001 −0.545 7.234 NEK2 NIMA (never in mitosis gene a)-related kinase 2 BB203873 0.2530.0122.1350.0511.088 3.839 0.024 1.33 5.169 PAK1 p21/Cdc42/Rac1-activated kinase 1 (STE20 homolog, yeast) NM_011035 0.036−0.9627.9840.3010.477 7.838 0.013 1.4469.283 PCTK3 PCTAIRE protein kinase 3 NM_008795 0.052−1.7666.542 0.001 3.965 2.577 0 5.73 8.308 PI4K2A phosphatidylinositol 4-kinase type 2 alpha NM_145501 0.013−0.27711.3460.0020.453 7.825 0 0.61911.623 PI4K2B phosphatidylinositol 4-kinase type 2 beta NM_025951 0.056−0.3558.6470.0180.693 6.639 0.002 0.7499.001 PIK3CA phosphoinositide-3-kinase, catalytic, alpha polypeptide NM_008839 0.0010.6456.7550.127−0.249 7.833 0 −0.815 6.11 PIK3CD phosphoinositide-3-kinase, catalytic, delta polypeptide NM_0010298370.053 −0.5486.2160.256−0.386 9.26 0.012 0.813 6.764 PIK3R1 phosphoinositide-3-kinase, regulatory subunit 1 (alpha) NM_0010249550.0090.6289.6450.001 −0.697 13.043 0 −1.402 9.017 PIK3R3 phosphoinositide-3-kinase, regulatory subunit 3 (gamma) NM_181585 0.281−0.2867.8270.060.555 7.271 0.012 0.841 8.112 PIM1 pim-1 oncogene NM_008842 0.032−1.33.5450.4590.18 8.558 0.06 1.086 4.845 PIP5K1C phosphatidylinositol-4- phosphate 5-kinase, type I, gamma NM_008844 0.057−0.4839.7210.6470.1 9.621 0.029 0.58210.204 PLCB4 phospholipase C, beta 4 NM_013829 0.0151.0364.2860.28−0.212 10.733 0.01 −1.1543.251 PLCD1 phospholipase C, delta 1 NM_019676 0.0130.64510.6520.094−0.374 11.027 0.001 −1.019 10.007 PLCD3 phospholipase C, delta 3 NM_152813 0.0560.6096.560.478−0.196 6.756 0.02 −0.806 5.951 PLCG2 phospholipase C, gamma 2 (phosphatidylinositol-specific) NM_172285 0.014−0.4759.2960.4390.116 9.181 0.005 0.5919.771 PLCL2 phospholipase C-like 2 NM_013880 0.031−0.3989.4470.3010.161 9.285 0.007 0.559 9.844 PRKAA1 protein kinase, AMP-activated, alpha 1 catalytic subunit NM_0010133670.0090.4086.520.001 −0.631 7.151 0 −1.0396.112 PRKCD protein kinase C, delta NM_011103 0.15−0.27311.2390.0330.451 10.788 0.004 0.72411.512 PRKCH protein kinase C, eta NM_008856 0.087−0.74310.472 0.0270.997 7.892 0.003 1.594 9.486 PRPF4B PRP4 pre-mRNA processing factor 4 homolog B (yeast) NM_013830 0.0080.3458.0060.071−0.264 9.994 0.002 −0.563 8.844 Glycosaminoglycan Degradation AFP alpha-fetoprotein NM_007423 0.068−1.7082.7180.1140.381 3.333 0.022 0.6313.964 CHI3L3 chitinase 3-like 3 NM_009892 0.047−0.9976.054 0.0780.85 5.203 0.003 1.847 7.05 GALNS galactosamine (N-acetyl)- 6-sulfate sulfatase (Morquio syndrome, mucopolysaccharidosis type IVA) NM_016722 0.129−0.2799.4910.080.334 9.157 0.008 0.6139.77 GLB1 galactosidase, beta 1 AW553762 0.0440.9177.970.0040.282 10.92 0.001 0.36911.288 GLB1L galactosidase, beta 1-like BB207162 0.0050.6368.0140.207−0.019 2.343 0.006 −0.6157.378 GLB1L2 galactosidase, beta 1-like 2 NM_153803 0.0280.50814.0960.033−0.47 13.134 0.002 −0.879 12.256 GUSB glucuronidase, beta NM_010368 0.101−0.43212.270.0230.747 10.177 0.002 1.093 12.702 IDS iduronate 2-sulfatase (Hunter syndrome) NM_0010389900.0250.3037.6050.028 −0.268 12.593 0.001 −0.527 12.066 MGEA5 meningioma expressed antigen 5 (hyaluronidase) NM_023799 0.0040.3810.5460.074−0.234 12.444 0.001 −0.535 10.166 SULF1 sulfatase 1 NM_172294 0.0740.66111.0970.284−0.315 2.943 0.049 −0.753 10.436 SULF2 sulfatase 2 NM_028072 0.0020.6612.8890.5450.245 8.922 0.003 −0.627 12.229 Copyright © 2013 SciRes. OPEN ACCESS  J. Tseng-Crank et al. / Open Journal of Genetics 3 (2013) 9-86 65 Supplement Table 4. FUP/FV FUP/FC FV/FC Name Description RefSeq ID p-value Log Ratio Intensity p-valueLog Ratio Intensity p-value Log Ratio Intensity Cell Cycle: G2/M DNA Damage Checkpoint Regulation BRCA1 breast cancer 1, early onset NM_009764 0.045−1.7214.598 0.2650.8433.755 0.009 2.5646.318 CCNB1 cyclin B1 NM_172301 0.026−1.5715.055 0.0641.2143.841 0.002 2.7856.626 CCNB2 cyclin B2 NM_007630 0.016−1.527.083 0.0311.2825.8 0.001 2.8028.602 CDC2 cell division cycle 2, G1 to S and G2 to M NM_007659 0.013−1.3958.342 0.021.2537.088 0 2.6489.736 CDKN1A cyclin-dependent kinase inhibitor 1A (p21, Cip1) NM_0011110990.026 −0.6799.893 0.0011.4688.425 0 2.146 10.571 SKP2 S-phase kinase-associated protein 2 (p45) NM_013787 0.214−0.5993.876 0.1380.7373.139 0.02 1.3374.476 TOP2A topoisomerase (DNA) II alpha 170 kDa NM_011623 0.023−1.536.184 0.0761.0835.1 0.002 2.6147.714 UBD ubiquitin D NM_023137 0.022−2.072 12.1590.0014.4757.683 0 6.54714.23 YWHAE tyrosine 3-monooxygenase/ tryptophan 5-monooxygenase activation protein, epsilon polypeptide BF714941 0.0121.2195.874 0.053−0.2678.76 0.003 −1.5984.655 YWHAZ tyrosine 3-monooxygenase/ tryptophan 5-monooxygenase activation protein, zeta polypeptide NM_011740 0.008−0.8767.273 0.447−0.1887.461 0.024 0.6888.148 Glucocorticoid Receptor Signaling AGT angiotensinogen (serpin peptidase inhibitor, clade A, member 8) NM_007428 0.0121.90312.8130.207 −0.77213.584 0.002 −2.67410.91 AR androgen receptor (dihydrotestosterone receptor; testicular feminization; spinal and bulbar muscular atrophy; Kennedy disease) NM_013476 0.0010.86610.48 0.031−0.44510.925 0 −1.3119.615 BCL3 B-cell CLL/lymphoma 3 NM_033601 0.03−0.3928.281 0.0020.6847.596 0 1.0768.672 CCL13 chemokine (C-C motif) ligand 13 NM_011333 0.001−1.42510.7870 1.6839.103 0 3.109 12.212 CCL3 chemokine (C-C motif) ligand 3 NM_011337 0.033−1.3164.068 0.0191.5052.563 0.001 2.8215.383 CD163 CD163 molecule NM_053094 0.0720.68110.3430.108−0.59110.934 0.006 −1.2729.662 CDKN1A cyclin-dependent kinase inhibitor 1A (p21, Cip1) NM_0011110990.026 −0.6799.893 0.0011.4688.425 0 2.146 10.571 CDKN1C cyclin-dependent kinase inhibitor 1C (p57, Kip2) NM_009876 0.2230.2239.726 0.008−0.63410.36 0.002 −0.8579.503 CXCL3 chemokine (C-X-C motif) ligand 3 NM_009140 0.9190.0614.962 0.0481.4223.541 0.055 1.3614.901 ESR1 estrogen receptor 1 NM_007956 0.0410.52 6.097 0.033−0.5516.648 0.002 −1.0715.577 Copyright © 2013 SciRes. OPEN ACCESS  J. Tseng-Crank et al. / Open Journal of Genetics 3 (2013) 9-86 66 Continued FCGR1A Fc fragment of IgG, high affinity Ia, receptor (CD64) NM_010186 0.048−1.1676.7360.2240.6139.285 0.015 1.513 10.798 FKBP5 FK506 binding protein 5 NM_010220 0.0490.842 7.948 0.226−0.249 11.349 0.054 −0.439 10.909 FOS v-fos FBJ murine osteosarcoma viral oncogene homolog NM_010234 0.077−1.08910.7590.2070.72510.034 0.012 1.813 11.848 IKBKE inhibitor of kappa light polypeptide gene enhancer in B-cells, kinase epsilon NM_019777 0.013−0.5558.5310.0290.4568.075 0.001 1.012 9.086 IL1R2 interleukin 1 receptor, type II NM_010555 0.002−1.4532.7190.3180.3052.413 0.001 1.759 4.172 IL1RN interleukin 1 receptor antagonist NM_0010397010.005−1.8052.2030 3.3 3.963 0 4.59 8.553 MAP2K7 mitogen-activated protein kinase kinase 7 NM_0010425570.1140.6134.4990.2710.3483.444 0.032 −0.912 3.887 MAPK14 mitogen-activated protein kinase 14 NM_011951 0.0020.8467.58 0.062−0.06412.45 0 −0.194 12.256 NCOR1 nuclear receptor co-repressor 1 NM_011308 0.0020.864 8.333 0.039−0.595 5.03 0.001 −1.134 7.47 NR3C1 nuclear receptor subfamily 3, group C, member 1 (glucocorticoid receptor) NM_008173 0 0 0.988 8.9460.001−0.54212.348 0 −1.444 7.958 NRIP1 nuclear receptor interacting protein 1 NM_173440 0.0020.67510.3560.004−0.57210.928 0 −1.247 9.681 PCK1 phosphoenolpyruvate carboxykinase 1 (soluble) NM_011044 0.0022.19312.8270.7830.18112.921 0.002 −2.229 10.633 PIK3CA phosphoinositide-3-kinase, catalytic, alpha polypeptide NM_008839 0.0010.6456.7550.127−0.2497.833 0 −0.815 6.11 PIK3CD phosphoinositide-3-kinase, catalytic, delta polypeptide NM_0010298370.053 −0.548 6.2160.256−0.386 9.26 0.012 0.813 6.764 PIK3R1 phosphoinositide-3-kinase, regulatory subunit 1 (alpha) NM_001024955 0.0090.6289.6450.001−0.69713.043 0 −1.402 9.017 PIK3R3 phosphoinositide-3-kinase, regulatory subunit 3 (gamma) NM_181585 0.281−0.2867.8270.060.5557.271 0.012 0.841 8.112 PIK3R5 phosphoinositide-3-kinase, regulatory subunit 5 NM_177320 0.155−0.692 7.330.0221.2996.031 0.003 1.991 8.022 SERPINE1 serpin peptidase inhibitor, clade E (nexin, plasminogen activator inhibitor type 1), member 1 NM_008871 0.044−1.6158.7570.4030.5788.179 0.013 2.194 10.373 SMARCA2 SWI/SNF related, matrix associated, actin dependent regulator of chromatin, subfamily a, member 2 NM_011416 0 0.5199.8730.001−0.32510.198 0 −0.844 9.354 TAF15 TAF15 RNA polymerase II, TATA box binding protein (TBP)-associated factor, 68 kDa NM_027427 0.0061.104 4.1510.173−0.647 3.913 0.031 −0.753 3.047 TAF6L TAF6-like RNA polymerase II, p300/CBP-associated factor (PCAF)-associated factor, 65 kDa NM_146092 0.061−0.4017.9430.0570.4117.532 0.003 0.812 8.343 TAF9B TAF9B RNA polymerase II, TATA box binding protein (TBP)-associated factor, 31 kDa NM_001001176 0.0060.868 8.5820.081−0.4489.03 0.001 −1.316 7.713 TGFB3 transforming growth factor, beta 3 NM_009368 0.0010.49510.6690.009−0.33711.006 0 −0.832 10.174 Copyright © 2013 SciRes. OPEN ACCESS  J. Tseng-Crank et al. / Open Journal of Genetics 3 (2013) 9-86 67 Continued TGFBR2 transforming growth factor, beta receptor II (70/80 kDa) NM_009371 0.0010.966 9.9720.2180.228 9.744 0.004 −0.739 9.005 TRA@ T cell receptor alpha locus XM_001471582 0.038−1.4388.857 0.0351.472 7.385 0.002 2.909 10.295 VCAM1 vascular cell adhesion molecule 1 NM_011693 0.078−0.7066.1650.2250.452 5.714 0.013 1.158 6.872 PPARa/RXRa Activation ACVR1C activin A receptor, type IC NM_001033369 0.0010.8598.0510.002 −0.725 8.777 0 −1.584 7.192 ADCY7 adenylate cyclase 7 NM_001037723 0.08−0.75810.6450.2040.467 7.078 0.019 1.034 8.113 BCL3 B-cell CLL/lymphoma 3 NM_033601 0.03−0.3928.2810.0020.684 7.596 0 1.076 8.672 CYP2C44 cytochrome P450, family 2, subfamily c, polypeptide 44 NM_001001446 0.001−2.8145.549 0.0022.405 3.144 0 5.219 8.363 CYP2C70 cytochrome P450, family 2, subfamily c, polypeptide 70 NM_145499 0.038−1.2892.7230.4260.418 2.305 0.012 1.707 4.012 GK glycerol kinase NM_008194 0.03−0.8977.8210.5640.193 6.204 0.018 1.006 7.21 GPD2 glycerol-3-phosphate dehydrogenase 2 (mitochondrial) NM_010274 0.0081.0845.6570.001 −1.621 7.277 0 −2.704 4.573 IKBKE inhibitor of kappa light polypeptide gene enhancer in B-cells, kinase epsilon NM_019777 0.013−0.5558.5310.0290.456 8.075 0.001 1.012 9.086 IL1R2 interleukin 1 receptor, type II NM_010555 0.002−1.4532.7190.3180.305 2.413 0.001 1.759 4.172 INSR insulin receptor NM_001033381 0 0.6689.9370.022−0.275 10.212 0 −0.943 9.269 IRS1 insulin receptor substrate 1 NM_010570 0.0061.38711.2580.089 −0.681 11.939 0.001 −2.067 9.872 MAP2K7 mitogen-activated protein kinase kinase 7 NM_001042557 0.1140.613 4.4990.2710.348 3.444 0.032 −0.912 3.887 MAPK14 mitogen-activated protein kinase 14 NM_011951 0.0020.8467.580.062 −0.064 12.45 0 −0.19412.256 NCOR1 nuclear receptor co-repressor 1 NM_011308 0.0020.8648.3330.039 −0.595 5.03 0.001 −1.134 7.47 PLCB4 phospholipase C, beta 4 NM_013829 0.0151.0364.2860.28−0.212 10.733 0.01 −1.154 3.251 PLCD1 phospholipase C, delta 1 NM_019676 0.0130.64510.6520.094−0.374 11.027 0.001 −1.019 10.007 PLCD3 phospholipase C, delta 3 NM_152813 0.0560.6096.560.478−0.196 6.756 0.02 −0.806 5.951 SLC27A1 solute carrier family 27 (fatty acid transporter), member 1 NM_011977 0.0040.81311.7680.0160.619 11.149 0.342 −0.19410.955 TGFB3 transforming growth factor, beta 3 NM_009368 0.0010.49510.6690.009−0.337 11.006 0 −0.832 10.174 TGFBR2 transforming growth factor, beta receptor II (70/80 kDa) NM_009371 0.0010.9669.9720.2180.228 9.744 0.004 −0.739 9.005 Acute Phase Response Signaling Copyright © 2013 SciRes. OPEN ACCESS  J. Tseng-Crank et al. / Open Journal of Genetics 3 (2013) 9-86 68 Continued AGT angiotensinogen (serpin peptidase inhibitor, clade A, member 8) NM_007428 0.0121.90312.813 0.207 −0.772 13.584 0.002 −2.674 10.91 BCL3 B-cell CLL/lymphoma 3 NM_033601 0.03−0.3928.2810.0020.684 7.596 0 1.076 8.672 C2 complement component 2 NM_013484 0.0050.85912.656 0.057 −0.441 14.039 0.001 −1.319 11.797 CP ceruloplasmin (ferroxidase) NM_0010426110.003 0.86711.589 0.016 −0.513 11.028 0 −1.27810.722 FOS v-fos FBJ murine osteosarcoma viral oncogene homolog NM_010234 0.077−1.08910.7590.2070.725 10.034 0.012 1.813 11.848 FRAP1 FK506 binding protein 12-rapamycin associated protein 1 NM_020009 0.05−0.8254.1570.274 −0.144 10.371 0.031 0.9384.981 HMOX1 heme oxygenase (decycling) 1 NM_010442 0.242−0.4959.7170.1940.557 9.16 0.032 1.052 10.212 IKBKE inhibitor of kappa light polypeptide gene enhancer in B-cells, kinase epsilon NM_019777 0.013−0.5558.5310.0290.456 8.075 0.001 1.012 9.086 IL1RN interleukin 1 receptor antagonist NM_0010397010.005 −1.8052.2030 3.3 3.963 0 4.59 8.553 MAP2K7 mitogen-activated protein kinase kinase 7 NM_0010425570.1140.613 4.4990.2710.348 3.444 0.032 −0.912 3.887 MAPK14 mitogen-activated protein kinase 14 NM_011951 0.0020.8467.580.062 −0.064 12.45 0 −0.19412.256 NR3C1 nuclear receptor subfamily 3, group C, member 1 (glucocorticoid receptor) NM_008173 0 0.9888.9460.001−0.542 12.348 0 −1.444 7.958 ORM1 orosomucoid 1 NM_011016 0.001−1.356.2370 1.542 4.695 0 2.8927.587 PIK3CA phosphoinositide-3-kinase, catalytic, alpha polypeptide NM_008839 0.0010.6456.7550.127−0.249 7.833 0 −0.8156.11 PIK3CD phosphoinositide-3-kinase, catalytic, delta polypeptide NM_0010298370.053 −0.5486.2160.256−0.386 9.26 0.012 0.813 6.764 PIK3R1 phosphoinositide-3-kinase, regulatory subunit 1 (alpha) NM_0010249550.0090.6289.6450.001−0.697 13.043 0 −1.402 9.017 PIK3R3 phosphoinositide-3-kinase, regulatory subunit 3 (gamma) NM_181585 0.281−0.2867.8270.060.555 7.271 0.012 0.841 8.112 RBP7 retinol binding protein 7, cellular NM_022020 0.2090.54710.1210.0081.48 8.64 0.052 0.9349.574 SAA2 serum amyloid A2 NM_011315 0.015−2.32311.2670.7380.245 11.022 0.01 2.56813.59 SERPINA1 serpin peptidase inhibitor, clade A (alpha-1 antiproteinase, antitrypsin), member 1 NM_009243 0.002−1.0464.6530.2640.242 4.411 0 1.288 5.699 SERPINE1 serpin peptidase inhibitor, clade E (nexin, plasminogen activator inhibitor type 1), member 1 NM_008871 0.044−1.6158.7570.4030.578 8.179 0.013 2.194 10.373 SERPINF1 serpin peptidase inhibitor, clade F (alpha-2 antiplasmin, pigment epithelium derived factor), member 1 NM_011340 0.570.09213.7650.0010.924 12.841 0.001 0.75713.916 Copyright © 2013 SciRes. OPEN ACCESS  J. Tseng-Crank et al. / Open Journal of Genetics 3 (2013) 9-86 69 Continued TNFRSF11B tumor necrosis factor receptor superfamily, member 11b (osteoprotegerin) NM_008764 0.1470.5256.2 0.075−0.675 6.875 0.008 −1.2 5.675 P53 Signaling BAX BCL2-associated X protein NM_007527 0.033−0.45111.4660.0560.386 11.079 0.002 0.83711.917 BIRC5 baculoviral IAP repeat-containing 5 (survivin) NM_0010122730.03 −1.6556.710.0741.274 5.436 0.002 2.929 8.366 BRCA1 breast cancer 1, early onset NM_009764 0.045−1.7214.5980.265 0.843 3.755 0.009 2.564 6.318 CDKN1A cyclin-dependent kinase inhibitor 1A (p21, Cip1) NM_0011110990.026−0.6799.8930.001 1.468 8.425 0 2.146 10.571 E2F1 E2F transcription factor 1 NM_007891 0.085−0.3546.9770.0160.663 8.141 0.002 0.904 7.331 GADD45B growth arrest and DNA-damage-inducible, beta NM_008655 0.003−0.94910.170.0890.407 9.762 0 1.356 11.118 HDAC9 histone deacetylase 9 NM_024124 0.11−0.4618.3630.1310.43 7.933 0.011 0.891 8.824 MAPK14 mitogen-activated protein kinase 14 NM_011951 0.0020.8467.580.062 −0.064 12.45 0 −0.194 12.256 PIK3CA phosphoinositide-3-kinase, catalytic, alpha polypeptide NM_008839 0.0010.6456.7550.127−0.249 7.833 0 −0.815 6.11 PIK3CD phosphoinositide-3-kinase, catalytic, delta polypeptide NM_0010298370.053−0.5486.2160.256−0.386 9.26 0.012 0.813 6.764 PIK3R1 phosphoinositide-3-kinase, regulatory subunit 1 (alpha) NM_0010249550.0090.6289.6450.001 −0.697 13.043 0 −1.402 9.017 PIK3R3 phosphoinositide-3-kinase, regulatory subunit 3 (gamma) NM_181585 0.281−0.2867.8270.060.555 7.271 0.012 0.841 8.112 PIK3R5 phosphoinositide-3-kinase, regulatory subunit 5 NM_177320 0.155−0.6927.330.0221.299 6.031 0.003 1.991 8.022 PLAGL1 pleiomorphic adenoma gene-like 1 NM_009538 0.0021.07913.0070.029 −0.604 13.61 0 −1.68311.928 RB1 retinoblastoma 1 (including osteosarcoma) NM_009029 0.038−0.654.4830.0980.483 4.001 0.003 1.133 5.134 SIRT1 sirtuin (silent mating type information regulation 2 homolog) 1 (S. cerevisiae) NM_019812 0.1030.3527.590.048−0.451 8.041 0.004 −0.804 7.237 THBS1 thrombospondin 1 NM_011580 0.0011.0811.080.1990.399 11.387 0.002 −0.98410 WT1 Wilms tumor 1 NM_144783 0.0470.6898.5170.041−0.721 9.238 0.002 −1.411 7.827 IL-4 Signaling FRAP1 FK506 binding protein 12-rapamycin associated protein 1 NM_020009 0.05−0.8254.1570.274−0.144 10.371 0.031 0.938 4.981 HLA-DMB major histocompatibility complex, class II, DM beta NM_010387 0.004−1.0389.3380.030.435 11.761 0 1.094 12.855 HMGA1 high mobility group AT-hook 1 NM_0010254270.028−0.86710.8640.0230.911 9.953 0.001 1.778 11.731 IRS1 insulin receptor substrate 1 NM_010570 0.0061.38711.2580.089 −0.681 11.939 0.001 −2.067 9.872 Copyright © 2013 SciRes. OPEN ACCESS  J. Tseng-Crank et al. / Open Journal of Genetics 3 (2013) 9-86 70 Continued NR3C1 nuclear receptor subfamily 3, group C, member 1 (glucocorticoid receptor) NM_008173 0 0.9888.9460.001−0.542 12.348 0 −1.444 7.958 PIK3CA phosphoinositide-3-kinase, catalytic, alpha polypeptide NM_008839 0.0010.6456.7550.127−0.249 7.833 0 −0.815 6.11 PIK3CD phosphoinositide-3-kinase, catalytic, delta polypeptide NM_0010298370.053 −0.5486.2160.256−0.386 9.26 0.012 0.813 6.764 PIK3R1 phosphoinositide-3-kinase, regulatory subunit 1 (alpha) NM_0010249550.0090.6289.6450.001 −0.697 13.043 0 −1.402 9.017 PIK3R3 phosphoinositide-3-kinase, regulatory subunit 3 (gamma) NM_181585 0.281−0.2867.8270.060.555 7.271 0.012 0.841 8.112 PIK3R5 phosphoinositide-3-kinase, regulatory subunit 5 NM_177320 0.155−0.6927.330.0221.299 6.031 0.003 1.9918.022 PI3K/AKT Signaling BCL3 B-cell CLL/lymphoma 3 NM_033601 0.03−0.3928.2810.0020.684 7.596 0 1.0768.672 CDKN1A cyclin-dependent kinase inhibitor 1A (p21, Cip1) NM_0011110990.026−0.679 9.893 0.001 1.468 8.425 0 2.146 10.571 CDKN1B cyclin-dependent kinase inhibitor 1B (p27, Kip1) NM_009875 0.1250.398.6960.093−0.436 9.132 0.009 −0.826 8.306 EIF4EBP1 eukaryotic translation initiation factor 4E binding protein 1 NM_007918 0.0161.108 9.7080.8380.03 14.414 0.013 −1.158 8.599 FOXO1 forkhead box O1 NM_019739 0.0070.656 10.7560.1−0.323 11.079 0.001 −0.979 10.1 FRAP1 FK506 binding protein 12-rapamycin associated protein 1 NM_020009 0.05−0.8254.1570.274−0.144 10.371 0.031 0.938 4.981 GYS1 glycogen synthase 1 (muscle) NM_030678 0.0111.0967.2940.493−0.225 7.52 0.005 −1.321 6.199 GYS2 glycogen synthase 2 (liver) NM_145572 0.005−1.678.426 0.085 0.809 7.617 0.001 2.479 10.096 IKBKE inhibitor of kappa light polypeptide gene enhancer in B-cells, kinase epsilon NM_019777 0.013−0.5558.5310.0290.456 8.075 0.001 1.012 9.086 MAPK8IP1 mitogen-activated protein kinase 8 interacting protein 1 NM_011162 0.0071.177.2420.05−0.722 7.964 0.001 −1.892 6.071 PIK3CA phosphoinositide-3-kinase, catalytic, alpha polypeptide NM_008839 0.0010.6456.7550.127−0.249 7.833 0 −0.815 6.11 PIK3CD phosphoinositide-3-kinase, catalytic, delta polypeptide NM_0010298370.053 −0.5486.2160.256−0.386 9.26 0.012 0.813 6.764 PIK3R1 phosphoinositide-3-kinase, regulatory subunit 1 (alpha) NM_0010249550.0090.6289.6450.001 −0.697 13.043 0 −1.402 9.017 PIK3R3 phosphoinositide-3-kinase, regulatory subunit 3 (gamma) NM_181585 0.281−0.2867.8270.060.555 7.271 0.012 0.841 8.112 PPP2R3A (includes EG:5523) protein phosphatase 2 (formerly 2A), regulatory subunit B”, alpha XM_0014743960.0070.4866.878 0.004 −0.55 7.428 0 −1.036 6.392 YWHAE tyrosine 3-monooxygenase/ tryptophan 5-monooxygenase activation protein, epsilon polypeptide BF714941 0.0121.2195.8740.053−0.267 8.76 0.003 −1.598 4.655 YWHAZ tyrosine 3-monooxygenase/ tryptophan 5-monooxygenase activation protein, zeta polypeptide NM_011740 0.008−0.8767.2730.447−0.188 7.461 0.024 0.6888.148 Copyright © 2013 SciRes. OPEN ACCESS  J. Tseng-Crank et al. / Open Journal of Genetics 3 (2013) 9-86 71 Continued SAPK/JNK Signaling GNG2 guanine nucleotide binding protein (G protein), gamma 2 NM_0010386370.008 −1.1468.6580.1350.514 8.144 0.001 1.6619.804 GNG7 guanine nucleotide binding protein (G protein), gamma 7 NM_0010386550.016 0.9666.2780.645 −0.142 6.42 0.008 −1.109 5.311 IRS1 insulin receptor substrate 1 NM_010570 0.0061.38711.258 0.089 −0.681 11.939 0.001 −2.067 9.872 MAP2K7 mitogen-activated protein kinase kinase 7 NM_0010425570.1140.613 4.4990.2710.348 3.444 0.032 −0.912 3.887 MAP3K13 mitogen-activated protein kinase kinase kinase 13 XM_0014808120.10.6764.220.4430 2.122 0.05 −0.853.543 MAP3K3 mitogen-activated protein kinase kinase kinase 3 NM_011947 0.049−2.0115.5490.137 −1.412 6.962 0.092 −0.237 9.719 MAP4K1 mitogen-activated protein kinase kinase kinase kinase 1 NM_008279 0.2−0.2527.7330.002 0.867 6.866 0.001 1.119 7.985 MAPK8IP1 mitogen-activated protein kinase 8 interacting protein 1 NM_011162 0.0071.177.2420.05 −0.722 7.964 0.001 −1.892 6.071 PIK3CA phosphoinositide-3-kinase, catalytic, alpha polypeptide NM_008839 0.0010.6456.7550.127−0.249 7.833 0 −0.815 6.11 PIK3CD phosphoinositide-3-kinase, catalytic, delta polypeptide NM_0010298370.053 −0.5486.2160.256 −0.386 9.26 0.012 0.813 6.764 PIK3R1 phosphoinositide-3-kinase, regulatory subunit 1 (alpha) NM_0010249550.0090.6289.6450.001−0.697 13.043 0 −1.402 9.017 PIK3R3 phosphoinositide-3-kinase, regulatory subunit 3 (gamma) NM_181585 0.281−0.2867.8270.060.555 7.271 0.012 0.841 8.112 PIK3R5 phosphoinositide-3-kinase, regulatory subunit 5 NM_177320 0.155−0.6927.330.022 1.299 6.031 0.003 1.9918.022 TRA@ T cell receptor alpha locus XM_0014715820.038−1.4388.8570.035 1.472 7.385 0.002 2.909 10.295 TRG@ T cell receptor gamma locus NM_011558 0.2620.3963.9950.072−0.695 4.69 0.013 −1.093.599 Leukocyte Extravasation Signaling ACTN1 actinin, alpha 1 NM_134156 0.032−0.7865.7060.040.743 8.142 0.002 1.523 6.492 ACTN3 actinin, alpha 3 NM_013456 0.2210.6127.4250.03−1.26 8.685 0.005 −1.873 6.813 ARHGAP4 Rho GTPase activating protein 4 NM_138630 0.022−0.6125.9380.2620.249 5.689 0.005 0.861 6.55 ARHGAP6 Rho GTPase activating protein 6 NM_009707 0.08−0.9825.4210.6880.199 5.222 0.044 1.1816.404 ARHGAP9 Rho GTPase activating protein 9 NM_146011 0.027−0.8869 0.0320.848 8.152 0.001 1.735 9.887 BTK Bruton agammaglobulinemia tyrosine kinase NM_013482 0.009−1.0579.3760.6070.153 9.223 0.005 1.21 10.433 CD44 CD44 molecule (Indian blood group) NM_0010391500.036−0.90610.775 0.0191.077 6.791 0.001 1.916 8.707 CLDN12 claudin 12 NM_022890 0.0350.5237.8490.039−0.504 8.353 0.002 −1.027 7.326 CLDN5 claudin 5 (transmembrane protein deleted in velocardiofacial syndrome) NM_013805 0.0291.09612.816 0.0450.977 11.839 0.771 −0.119 11.72 CTNNA1 catenin (cadherin-associated protein), alpha 1, 102 kDa NM_009818 0.030.6665.0070.129−0.096 13.283 0.005 −1.025 4.342 Copyright © 2013 SciRes. OPEN ACCESS  J. Tseng-Crank et al. / Open Journal of Genetics 3 (2013) 9-86 72 Continued CXCR4 chemokine (C-X-C motif) receptor 4 NM_009911 0.413−0.3977 0.1250.8 6.2 0.037 1.198 7.397 CYBA cytochrome b-245, alpha polypeptide NM_007806 0.068−0.39913.6560.0250.532 13.123 0.002 0.932 14.055 CYBB cytochrome b-245, beta polypeptide (chronic granulomatous disease) NM_007807 0.045−0.56910.7560.0870.461 10.295 0.004 1.03 11.325 DLC1 deleted in liver cancer 1 NM_015802 0.0510.40312.010.007−0.554 9.799 0.001 −0.823 8.976 ITGB2 integrin, beta 2 (complement component 3 receptor 3 and 4 subunit) NM_008404 0.077−0.45613.3080.0110.774 12.534 0.001 1.229 13.764 MAPK14 mitogen-activated protein kinase 14 NM_011951 0.0020.8467.580.062 −0.064 12.45 0 −0.19412.256 MMP11 matrix metallopeptidase 11 (stromelysin 3) NM_008606 0.139−0.6367.5530.4180.326 7.227 0.041 0.962 8.189 MMP12 matrix metallopeptidase 12 (macrophage elastase) NM_008605 0.447−0.68713.129 0.0122.956 10.173 0.005 3.643 13.816 MMP13 matrix metallopeptidase 13 (collagenase 3) NM_008607 0.082−1.4772.740.5460.455 2.285 0.033 1.932 4.217 MMP3 matrix metallopeptidase 3 (stromelysin 1, progelatinase) NM_010809 0.207−1.3035.9230.193 1.348 4.574 0.027 2.651 7.226 MMP9 matrix metallopeptidase 9 (gelatinase B, 92 kDa gelatinase, 92 kDa type IV collagenase) NM_013599 0.0812.2657.7870.268 −1.057 9.127 0.019 −3.4115.522 NCF1C neutrophil cytosolic factor 1C pseudogene NM_010876 0.157−0.22211.784 0.0031.001 7.382 0.001 0.76612.007 NCF2 neutrophil cytosolic factor 2 (65 kDa, chronic granulomatous disease, autosomal 2) NM_010877 0.021−0.64410.2810.0590.483 9.798 0.001 1.126 10.924 NCF4 neutrophil cytosolic factor 4, 40 kDa NM_008677 0.024−0.5969.7870.0280.575 9.212 0.001 1.171 10.383 PECAM1 platelet/endothelial cell adhesion molecule (CD31 antigen) NM_001032378 0.0110.891 9.6430.1420.424 9.219 0.112 −0.4678.752 PIK3CA phosphoinositide-3-kinase, catalytic, alpha polypeptide NM_008839 0.0010.6456.7550.127−0.249 7.833 0 −0.8156.11 PIK3CD phosphoinositide-3-kinase, catalytic, delta polypeptide NM_001029837 0.053−0.5486.2160.256 −0.386 9.26 0.012 0.813 6.764 PIK3R1 phosphoinositide-3-kinase, regulatory subunit 1 (alpha) NM_001024955 0.0090.628 9.6450.001−0.697 13.043 0 −1.402 9.017 PIK3R3 phosphoinositide-3-kinase, regulatory subunit 3 (gamma) NM_181585 0.281−0.2867.8270.060.555 7.271 0.012 0.841 8.112 PIK3R5 phosphoinositide-3-kinase, regulatory subunit 5 NM_177320 0.155−0.6927.330.022 1.299 6.031 0.003 1.991 8.022 PRKCH protein kinase C, eta NM_008856 0.087−0.74310.4720.0270.997 7.892 0.003 1.594 9.486 PRKD1 protein kinase D1 NM_008858 0 0.37710.7130 −0.515 11.227 0 −0.89210.336 RDX radixin NM_001104616 0 1.0157.9 0.003−0.276 12.632 0 −0.64511.988 SELPLG selectin P ligand NM_009151 0.01−0.60411.2240.1870.248 10.976 0.002 0.852 11.828 TEC tec protein tyrosine kinase NM_001113460 0.039−0.42210.1260.0050.697 9.429 0 1.119 10.548 Copyright © 2013 SciRes. OPEN ACCESS  J. Tseng-Crank et al. / Open Journal of Genetics 3 (2013) 9-86 73 Continued TIMP1 TIMP metallopeptidase inhibitor 1 NM_001044384 0.023−1.0259.675 0.0320.94 8.734 0.001 1.96510.699 TIMP3 TIMP metallopeptidase inhibitor 3 (Sorsby fundus dystrophy, pseudoinflammatory) NM_011595 0 1.0669.0760.393 −0.121 12.275 0 −1.0128.01 TIMP4 TIMP metallopeptidase inhibitor 4 NM_080639 0.0180.77213.3670.404−0.217 13.585 0.006 −0.99 12.595 VAV1 vav 1 guanine nucleotide exchange factor NM_011691 0.044−0.7045.7550.2090.391 5.363 0.007 1.095 6.458 VAV3 vav 3 guanine nucleotide exchange factor NM_020505 0.072−0.7688.7430.1160.582 3.591 0.009 1.336 9.51 VCAM1 vascular cell adhesion molecule 1 NM_011693 0.078−0.7066.1650.2250.452 5.714 0.013 1.158 6.872 WAS Wiskott-Aldrich syndrome (eczema-thrombocytopenia) NM_009515 0.028−0.6238.9820.0660.485 8.497 0.002 1.107 9.604 Insulin Receptor Signaling ACLY ATP citrate lyase NM_134037 0.3110.3812.3370.003−0.937 14.13 0.001 −1.14212.988 EIF4EBP1 eukaryotic translation initiation factor 4E binding protein 1 NM_007918 0.0161.108 9.7080.8380.03 14.414 0.013 −1.158 8.599 FOXO1 forkhead box O1 NM_019739 0.0070.656 10.7560.1−0.323 11.079 0.001 −0.97910.1 FRAP1 FK506 binding protein 12-rapamycin associated protein 1 NM_020009 0.05−0.8254.1570.274 −0.144 10.371 0.031 0.9384.981 GYS1 glycogen synthase 1 (muscle) NM_030678 0.0111.0967.2940.493 −0.225 7.52 0.005 −1.321 6.199 GYS2 glycogen synthase 2 (liver) NM_145572 0.005−1.678.426 0.0850.809 7.617 0.001 2.47910.096 INSR insulin receptor NM_001033381 0 0.6689.9370.022−0.275 10.212 0 −0.943 9.269 IRS1 insulin receptor substrate 1 NM_010570 0.0061.38711.2580.089 −0.681 11.939 0.001 −2.0679.872 PIK3CA phosphoinositide-3-kinase, catalytic, alpha polypeptide NM_008839 0.0010.6456.7550.127−0.249 7.833 0 −0.815 6.11 PIK3CD phosphoinositide-3-kinase, catalytic, delta polypeptide NM_001029837 0.053−0.5486.2160.256 −0.386 9.26 0.012 0.813 6.764 PIK3R1 phosphoinositide-3-kinase, regulatory subunit 1 (alpha) NM_001024955 0.0090.6289.6450.001−0.697 13.043 0 −1.4029.017 PIK3R3 phosphoinositide-3-kinase, regulatory subunit 3 (gamma) NM_181585 0.281−0.2867.8270.060.555 7.271 0.012 0.841 8.112 PIK3R5 phosphoinositide-3-kinase, regulatory subunit 5 NM_177320 0.155−0.6927.330.0221.299 6.031 0.003 1.991 8.022 PRKCH protein kinase C, eta NM_008856 0.087−0.74310.4720.0270.997 7.892 0.003 1.5949.486 SLC2A4 solute carrier family 2 (facilitated glucose transporter), member 4 NM_009204 0.0291.36812.8890.309 −0.393 12.374 0.014 −1.20511.169 STXBP4 syntaxin binding protein 4 --- 0.0030.8585.130.567−0.11 5.239 0.002 −0.968 4.271 VAMP2 vesicle-associated membrane protein 2 (synaptobrevin 2) NM_009497 0.0790.4647.8150.081−0.46 8.274 0.005 −0.924 7.351 Xenobiotic Metabolism Signaling Copyright © 2013 SciRes. OPEN ACCESS  J. Tseng-Crank et al. / Open Journal of Genetics 3 (2013) 9-86 74 Continued ABCB1 ATP-binding cassette, sub-family B (MDR/TAP), member 1 NM_011076 0.0060.7615.9880.157−0.401 8.141 0.001 −1.0525.227 ALDH3B1 aldehyde dehydrogenase 3 family, member B1 NM_026316 0.017−0.567.8480.0460.431 7.417 0.001 0.992 8.409 ALDH5A1 aldehyde dehydrogenase 5 family, member A1 (succinate-semialdehyde dehydrogenase) NM_172532 0.0120.80210.108 0.459−0.18 10.288 0.004 −0.9829.306 ALDH6A1 aldehyde dehydrogenase 6 family, member A1 NM_134042 0.0020.50312.5660.009−0.359 12.925 0 −0.862 12.064 ARNT aryl hydrocarbon receptor nuclear translocator NM_0010377370.01 0.8316.1190.002 −0.259 8.705 0 −0.4258.28 CAMK2D calcium/ calmodulin-dependent protein kinase (CaM kinase) II delta NM_0010254380.062 0.0872.365 0.496 −0.25 7.43 0.038 −0.902 6.528 CES1 (includes EG:1066) carboxylesterase 1 (monocyte/macrophage serine esterase 1) NM_053200 0.0071.03613.6470.27−0.33 13.056 0.002 −1.382 11.674 CHST11 carbohydrate (chondroitin 4) sulfotransferase 11 NM_021439 0.112−0.2742.4180.0250.687 8.607 0.01 0.85 9.457 CITED2 Cbp/p300-interacting transactivator, with Glu/Asp-rich carboxy-terminal domain, 2 NM_010828 0.0280.61511.6780.162−0.343 12.022 0.004 −0.958 11.064 CUL3 cullin 3 NM_016716 0.0010.5998.0510.017−0.329 8.38 0 −0.9287.452 FMO1 flavin containing monooxygenase 1 NM_010231 0.0330.90913.4440.163 −0.526 13.971 0.004 −1.435 12.536 FMO5 flavin containing monooxygenase 5 NM_010232 0 1.1696.8380.077 −0.228 7.066 0 −1.3965.669 GSTA3 glutathione S-transferase A3 NM_0010773530.061 0.95311.4150.127 −0.725 9.233 0.006 −1.6567.577 GSTA4 glutathione S-transferase A4 NM_010357 0.040.85311.386 0.122−0.589 11.975 0.004 −1.441 10.533 GSTT1 glutathione S-transferase theta 1 NM_008185 0.0130.5912.7910.026−0.502 13.293 0.001 −1.092 12.201 HMOX1 heme oxygenase (decycling) 1 NM_010442 0.242−0.4959.7170.1940.557 9.16 0.032 1.052 10.212 KEAP1 kelch-like ECH-associated protein 1 NM_0011103050.017 0.972 9.3520.1740.466 8.886 0.145 −0.5058.381 LIPA lipase A, lysosomal acid, cholesterol esterase (Wolman disease) NM_0011111000.044 −0.971 9.896 0.027 0.828 12.45 0.002 1.498 13.949 MAOB monoamine oxidase B NM_172778 0.0380.46312.20.035−0.473 12.673 0.002 −0.936 11.737 MAP2K7 mitogen-activated protein kinase kinase 7 NM_0010425570.1140.613 4.4990.2710.348 3.444 0.032 −0.912 3.887 MAP3K3 mitogen-activated protein kinase kinase kinase 3 NM_011947 0.049−2.0115.5490.137−1.412 6.962 0.092 −0.2379.719 MAPK14 mitogen-activated protein kinase 14 NM_011951 0.0020.8467.580.062−0.064 12.45 0 −0.194 12.256 NFKB2 nuclear factor of kappa light polypeptide gene enhancer in B-cells 2 (p49/p100) NM_019408 0.3−0.2838.3790.0450.625 7.754 0.01 0.908 8.662 Copyright © 2013 SciRes. OPEN ACCESS  J. Tseng-Crank et al. / Open Journal of Genetics 3 (2013) 9-86 75 Continued NRIP1 nuclear receptor interacting protein 1 NM_173440 0.0020.67510.3560.004−0.572 10.928 0 −1.247 9.681 PIK3CA phosphoinositide-3-kinase, catalytic, alpha polypeptide NM_008839 0.0010.6456.7550.127−0.249 7.833 0 −0.815 6.11 PIK3CD phosphoinositide-3-kinase, catalytic, delta polypeptide NM_0010298370.053 −0.5486.2160.256−0.386 9.26 0.012 0.813 6.764 PIK3R1 phosphoinositide-3-kinase, regulatory subunit 1 (alpha) NM_0010249550.0090.6289.6450.001 −0.697 13.043 0 −1.402 9.017 PIK3R3 phosphoinositide-3-kinase, regulatory subunit 3 (gamma) NM_181585 0.281−0.2867.8270.060.555 7.271 0.012 0.841 8.112 PIK3R5 phosphoinositide-3-kinase, regulatory subunit 5 NM_177320 0.155−0.6927.330.0221.299 6.031 0.003 1.9918.022 PPP2R3A (includes EG:5523) protein phosphatase 2 (formerly 2A), regulatory subunit B”, alpha XM_0014743960.0070.4866.878 0.004 −0.55 7.428 0 −1.036 6.392 PRKCH protein kinase C, eta NM_008856 0.087−0.743 10.4720.0270.997 7.892 0.003 1.5949.486 PRKD1 protein kinase D1 NM_008858 0 0.37710.7130 −0.515 11.227 0 −0.892 10.336 SULT1A1 sulfotransferase family, cytosolic, 1A, phenol-preferring, member 1 NM_133670 0.0540.63513.7090.529−0.179 13.888 0.022 −0.814 13.073 SULT1E1 sulfotransferase family 1E, estrogen-preferring, member 1 NM_023135 0.0560.44610.5030.004−0.856 11.36 0 −1.303 10.057 LPS/IL-1 Mediated Inhibition of RXR Function ABCB1 ATP-binding cassette, sub-family B (MDR/TAP), member 1 NM_011076 0.0060.7615.9880.157−0.401 8.141 0.001 −1.052 5.227 ABCG1 ATP-binding cassette, sub-family G (WHITE), member 1 NM_009593 0.097−0.535 11.6240.0220.827 10.798 0.002 1.361 12.159 ALDH3B1 aldehyde dehydrogenase 3 family, member B1 NM_026316 0.017−0.567.8480.0460.431 7.417 0.001 0.992 8.409 ALDH5A1 aldehyde dehydrogenase 5 family, member A1 (succinate-semialdehyde dehydrogenase) NM_172532 0.0120.80210.1080.459−0.18 10.288 0.004 −0.982 9.306 ALDH6A1 aldehyde dehydrogenase 6 family, member A1 NM_134042 0.0020.50312.5660.009−0.359 12.925 0 −0.862 12.064 APOC2 apolipoprotein C-II NM_009695 0.187−0.449.3160.0730.639 8.677 0.01 1.08 9.756 APOC4 (includes EG:346) apolipoprotein C-IV NM_007385 0 −2.2482.1260.9960.001 2.125 0 2.2494.375 CHST11 carbohydrate (chondroitin 4) sulfotransferase 11 NM_021439 0.112−0.2742.4180.0250.687 8.607 0.01 0.85 9.457 FABP4 fatty acid binding protein 4, adipocyte NM_024406 0.0011.77110.720.438−0.247 10.967 0 −2.018 8.949 FABP5 fatty acid binding protein 5 (psoriasis-associated) NM_010634 0.018−0.47113.2310.0070.594 12.636 0 1.065 13.702 FABP7 fatty acid binding protein 7, brain NM_021272 0.032−1.602 5.9560.017 1.882 4.074 0.001 3.4847.558 FMO1 flavin containing monooxygenase 1 NM_010231 0.0330.90913.4440.163 −0.526 13.971 0.004 −1.435 12.536 Copyright © 2013 SciRes. OPEN ACCESS  J. Tseng-Crank et al. / Open Journal of Genetics 3 (2013) 9-86 76 Continued FMO5 flavin containing monooxygenase 5 NM_010232 0 1.1696.8380.077−0.228 7.066 0 −1.396 5.669 GSTA3 glutathione S-transferase A3 NM_0010773530.061 0.95311.415 0.127 −0.725 9.233 0.006 −1.656 7.577 GSTA4 glutathione S-transferase A4 NM_010357 0.040.85311.386 0.122 −0.589 11.975 0.004 −1.44110.533 GSTT1 glutathione S-transferase theta 1 NM_008185 0.0130.5912.7910.026−0.502 13.293 0.001 −1.092 12.201 HMGCS2 3-hydroxy-3- methylglutaryl- Coenzyme A synthase 2 (mitochondrial) NM_008256 0.0061.25711.845 0.0310.868 10.978 0.258 −0.39 10.588 IL1R2 interleukin 1 receptor, type II NM_010555 0.002−1.4532.7190.3180.305 2.413 0.001 1.7594.172 MAOB monoamine oxidase B NM_172778 0.0380.46312.20.035−0.473 12.673 0.002 −0.93611.737 MAP2K7 mitogen-activated protein kinase kinase 7 NM_0010425570.1140.613 4.4990.2710.348 3.444 0.032 −0.912 3.887 NR1H4 nuclear receptor subfamily 1, group H, member 4 NM_009108 0.0420.5735.1430.183−0.337 5.48 0.006 −0.91 4.57 PAPSS2 3'-phosphoadenosine 5'-phosphosulfate synthase 2 NM_011864 0.0020.52611.3380.007−0.403 11.74 0 −0.92810.812 SLC27A1 solute carrier family 27 (fatty acid transporter), member 1 NM_011977 0.0040.813 11.7680.0160.619 11.149 0.342 −0.19410.955 SULT1A1 sulfotransferase family, cytosolic, 1A, phenol-preferring, member 1 NM_133670 0.0540.63513.7090.529−0.179 13.888 0.022 −0.81413.073 SULT1E1 sulfotransferase family 1E, estrogen-preferring, member 1 NM_023135 0.0560.44610.5030.004−0.856 11.36 0 −1.30310.057 TNFRSF11B tumor necrosis factor receptor superfamily, member 11b (osteoprotegerin) NM_008764 0.1470.5256.2 0.075−0.675 6.875 0.008 −1.2 5.675 G-Protein Coupled Receptor Signaling ADCY7 adenylate cyclase 7 NM_0010377230.08−0.75810.6450.2040.467 7.078 0.019 1.034 8.113 ADRB3 adrenergic, beta-3-, receptor NM_013462 0.0181.98112.716 0.733 −0.187 13.423 0.012 −1.83 11.592 BCL3 B-cell CLL/lymphoma 3 NM_033601 0.03−0.3928.2810.0020.684 7.596 0 1.0768.672 CAMK2D calcium/calmodulin- dependent protein kinase (CaM kinase) II delta NM_0010254380.062 0.0872.365 0.496 −0.25 7.43 0.038 −0.902 6.528 DUSP9 dual specificity phosphatase 9 NM_029352 0.446−0.3084.250.0072.199 3.445 0.005 2.294 5.74 HTR2B 5-hydroxytryptamine (serotonin) receptor 2B NM_008311 0.022−3.2443.063 0.4770.81 2.252 0.008 4.0556.307 IKBKE inhibitor of kappa light polypeptide gene enhancer in B-cells, kinase epsilon NM_019777 0.013−0.5558.5310.0290.456 8.075 0.001 1.012 9.086 P2RY1 purinergic receptor P2Y, G-protein coupled, 1 NM_008772 0.017−0.5137.3030 1.407 5.895 0 1.927.816 Copyright © 2013 SciRes. OPEN ACCESS  J. Tseng-Crank et al. / Open Journal of Genetics 3 (2013) 9-86 77 Continued P2RY6 pyrimidinergic receptor P2Y, G-protein coupled, 6 NM_183168 0.047−0.8211.1710.1690.518 10.653 0.006 1.338 11.991 PDE1A phosphodiesterase 1A, calmodulin- dependent NM_001009978 0.0031.2398.6990.059 −0.608 9.306 0 −1.847 7.46 PDE2A phosphodiesterase 2A, cGMP-stimulated NM_001008548 0.148−0.25210.0920.0040.683 9.41 0.001 0.935 10.345 PDE4B phosphodiesterase 4B, cAMP-specific (phosphodiesterase E4 dunce homolog, Drosophila) NM_019840 0 1.1048.990.001 0.883 8.107 0.222 −0.222 7.885 PDE7A phosphodiesterase 7A NM_001122759 0.14−0.4368.998 0.003 1.237 8.55 0.001 1.448 9.997 PDE8B phosphodiesterase 8B NM_172263 0.043−1.0833.1460.8030.111 3.035 0.03 1.1944.229 PIK3CA phosphoinositide-3-kinase, catalytic, alpha polypeptide NM_008839 0.0010.6456.7550.127−0.249 7.833 0 −0.815 6.11 PIK3CD phosphoinositide-3-kinase, catalytic, delta polypeptide NM_001029837 0.053−0.5486.2160.256 −0.386 9.26 0.012 0.813 6.764 PIK3R1 phosphoinositide-3-kinase, regulatory subunit 1 (alpha) NM_001024955 0.0090.628 9.6450.001−0.697 13.043 0 −1.402 9.017 PIK3R3 phosphoinositide-3-kinase, regulatory subunit 3 (gamma) NM_181585 0.281−0.2867.8270.060.555 7.271 0.012 0.841 8.112 PIK3R5 phosphoinositide-3-kinase, regulatory subunit 5 NM_177320 0.155−0.6927.330.022 1.299 6.031 0.003 1.991 8.022 PLCB4 phospholipase C, beta 4 NM_013829 0.0151.0364.2860.28−0.212 10.733 0.01 −1.154 3.251 RGS18 regulator of G-protein signaling 18 NM_022881 0.026−0.8159.1060.6290.151 8.392 0.016 0.9159.921 RGS2 regulator of G-protein signaling 2, 24 kDa NM_009061 0.02−1.287.6990.3370.422 9.278 0.007 1.42 10.466 RGS4 regulator of G-protein signaling 4 NM_009062 0.0041.0136.6330.0740.496 6.137 0.065 −0.517 5.619 TR/RXR Activation ACACA acetyl-Coenzyme A carboxylase alpha NM_133360 0.9120.0643.1130.009−2.07 5.182 0.008 −2.134 3.048 BCL3 B-cell CLL/lymphoma 3 NM_033601 0.03−0.3928.2810.0020.684 7.596 0 1.076 8.672 F10 coagulation factor X NM_007972 0.11−0.3153.270.002 1.908 6.065 0 1.2013.585 FRAP1 FK506 binding protein 12-rapamycin associated protein 1 NM_020009 0.05−0.8254.1570.274 −0.144 10.371 0.031 0.938 4.981 KLF9 Kruppel-like factor 9 NM_010638 0.0030.55212.6060.002−0.476 13.011 0 −0.861 12.15 LDLR low density lipoprotein receptor (familial hypercholesterolemia) NM_010700 0 −0.9289.280.237 −0.036 3.487 0 0.9 10.207 NCOR1 nuclear receptor co-repressor 1 NM_011308 0.0020.8648.3330.039 −0.595 5.03 0.001 −1.134 7.47 PCK1 phosphoenolpyruvate carboxykinase 1 (soluble) NM_011044 0.0022.19312.8270.7830.181 12.921 0.002 −2.22910.633 PIK3CA phosphoinositide- 3-kinase, catalytic, alpha polypeptide NM_008839 0.0010.6456.7550.127−0.249 7.833 0 −0.815 6.11 Copyright © 2013 SciRes. OPEN ACCESS  J. Tseng-Crank et al. / Open Journal of Genetics 3 (2013) 9-86 78 Continued PIK3CD phosphoinositide-3- kinase, catalytic, delta polypeptide NM_0010298370.053−0.5486.2160.256 −0.386 9.26 0.012 0.813 6.764 PIK3R1 phosphoinositide-3- kinase, regulatory subunit 1 (alpha) NM_0010249550.0090.6289.6450.001 −0.697 13.043 0 −1.4029.017 PIK3R3 phosphoinositide-3- kinase, regulatory subunit 3 (gamma) NM_181585 0.281−0.2867.8270.060.555 7.271 0.012 0.841 8.112 PIK3R5 phosphoinositide-3- kinase, regulatory subunit 5 NM_177320 0.155−0.6927.330.022 1.299 6.031 0.003 1.991 8.022 THRA thyroid hormone receptor, alpha (erythroblastic leukemia viral (v-erb-a) oncogene homolog, avian) NM_178060 0.0110.49611.440.007−0.551 11.991 0 −1.047 10.944 UCP2 uncoupling protein 2 (mitochondrial, proton carrier) NM_011671 0.056−0.53312.5980.0090.836 11.761 0.001 1.369 13.13 Sonic Hedgehog Signaling C2 complement component 2 NM_013484 0.0050.85912.6560.057 −0.441 14.039 0.001 −1.319 11.797 C3AR1 complement component 3a receptor 1 NM_009779 0.037−1.01711.9030.0621.088 10.166 0.003 1.917 11.113 C5AR1 complement component 5a receptor 1 NM_008555 0.996−0.0023.6310.012−1.298 4.929 0.012 −1.296 3.633 CCNB1 cyclin B1 NM_007577 0.094−0.8018.2310.0720.665 9.86 0.011 1.095 10.955 CDC2 cell division cycle 2, G1 to S and G2 to M NM_0010811250.61 −0.1093.3130.019−1.043 7.217 0.011 −1.2 6.017 GLI2 GLI-Kruppel family member GLI2 NM_172301 0.026−1.5715.055 0.0641.214 3.841 0.002 2.785 6.626 MASP1 mannan-binding lectin serine peptidase 1 (C4/C2 activating component of Ra-reactive factor) NM_007659 0.013−1.3958.3420.021.253 7.088 0 2.648 9.736 Cell Cycle: G1/S Checkpoint Regulation CCNE1 cyclin E1 NM_007633 0.071−0.6717.7280.140.523 7.205 0.008 1.194 8.398 CDK6 cyclin-dependent kinase 6 NM_009873 0.024−0.7629.0290.0930.629 7.834 0.003 1.211 9.791 CDKN1A cyclin-dependent kinase inhibitor 1A (p21, Cip1) NM_0011110990.026 −0.6799.893 0.0011.468 8.425 0 2.146 10.571 CDKN1B cyclin-dependent kinase inhibitor 1B (p27, Kip1) NM_009875 0.1250.398.6960.093−0.436 9.132 0.009 −0.826 8.306 CDKN2B cyclin-dependent kinase inhibitor 2B (p15, inhibits CDK4) NM_007670 0 −1.0139.990.8350.032 9.957 0 1.045 11.003 E2F1 E2F transcription factor 1 NM_007891 0.085−0.3546.9770.0160.663 8.141 0.002 0.904 7.331 E2F6 E2F transcription factor 6 NM_033270 0.009−1.1627.857 0.0141.06 6.797 0 2.222 9.019 HDAC11 histone deacetylase 11 NM_144919 0.0150.8256.4160.229−0.036 2.48 0.017 −0.8 5.59 Copyright © 2013 SciRes. OPEN ACCESS  J. Tseng-Crank et al. / Open Journal of Genetics 3 (2013) 9-86 79 Continued HDAC9 histone deacetylase 9 NM_024124 0.11−0.4618.3630.1310.43 7.933 0.011 0.891 8.824 RB1 retinoblastoma 1 (including osteosarcoma) NM_009029 0.038−0.654.4830.0980.483 4.001 0.003 1.133 5.134 SKP2 S-phase kinase- associated protein 2 (p45) NM_013787 0.214−0.5993.8760.1380.737 3.139 0.02 1.337 4.476 TGFB3 transforming growth factor, beta 3 NM_009368 0.0010.49510.6690.009−0.337 11.006 0 −0.832 10.174 GM-CSF Signaling BCL2A1 BCL2-related protein A1 NM_007534 0.11−0.78410.911 0.0580.973 9.938 0.005 1.756 11.694 CAMK2D calcium/calmodulin- dependent protein kinase (CaM kinase) II delta NM_0010254380.062 0.0872.3650.496−0.25 7.43 0.038 −0.902 6.528 HCK hemopoietic cell kinase NM_010407 0.016−0.9649.8790.0630.663 9.216 0.001 1.627 10.843 LYN v-yes-1 Yamaguchi sarcoma viral related oncogene homolog NM_0011110960.047 −0.51610.2230.2110.291 9.933 0.008 0.806 10.739 PIK3CA phosphoinositide-3-kinase, catalytic, alpha polypeptide NM_008839 0.0010.6456.7550.127−0.249 7.833 0 −0.815 6.11 PIK3CD phosphoinositide-3-kinase, catalytic, delta polypeptide NM_0010298370.053 −0.5486.2160.256 −0.386 9.26 0.012 0.813 6.764 PIK3R1 phosphoinositide-3-kinase, regulatory subunit 1 (alpha) NM_0010249550.0090.6289.6450.001 −0.697 13.043 0 −1.4029.017 PIK3R3 phosphoinositide-3-kinase, regulatory subunit 3 (gamma) NM_181585 0.281−0.2867.8270.060.555 7.271 0.012 0.841 8.112 PIK3R5 phosphoinositide-3-kinase, regulatory subunit 5 NM_177320 0.155−0.6927.330.0221.299 6.031 0.003 1.991 8.022 PIM1 pim-1 oncogene NM_008842 0.032−1.33.5450.4590.18 8.558 0.06 1.086 4.845 RUNX1 runt-related transcription factor 1 (acute myeloid leukemia 1; aml1 oncogene) NM_0011110210.024 −0.8124.6220.2460.506 4.344 0.01 1.447 5.791 LXR/RXR Activation ABCG1 ATP-binding cassette, sub-family G (WHITE), member 1 NM_009593 0.097−0.53511.624 0.0220.827 10.798 0.002 1.361 12.159 ACACA acetyl-Coenzyme A carboxylase alpha NM_133360 0.9120.0643.1130.009−2.07 5.182 0.008 −2.1343.048 APOC2 apolipoprotein C-II NM_009695 0.187−0.449.3160.0730.639 8.677 0.01 1.08 9.756 APOC4 (includes EG:346) apolipoprotein C-IV NM_007385 0 −2.2482.1260.9960.001 2.125 0 2.249 4.375 CCL7 chemokine (C-C motif) ligand 7 NM_013654 0.009−1.62610.3110.0081.689 8.623 0 3.314 11.937 IL1R2 interleukin 1 receptor, type II NM_010555 0.002−1.4532.7190.3180.305 2.413 0.001 1.759 4.172 IL1RN interleukin 1 receptor antagonist NM_0010397010.005 −1.8052.2030 3.3 3.963 0 4.59 8.553 LDLR low density lipoprotein receptor (familial hypercholesterolemia) NM_010700 0 −0.9289.280.237 −0.036 3.487 0 0.9 10.207 Copyright © 2013 SciRes. OPEN ACCESS  J. Tseng-Crank et al. / Open Journal of Genetics 3 (2013) 9-86 80 Continued MMP9 matrix metallopeptidase 9 (gelatinase B, 92 kDa gelatinase, 92 kDa type IV collagenase) NM_013599 0.0812.2657.7870.268 −1.057 9.127 0.019 −3.4115.522 MSR1 macrophage scavenger receptor 1 NM_0011133260.027 −0.9722.914 0.0091.537 4.507 0.001 1.778 10.468 NCOR1 nuclear receptor co-repressor 1 NM_011308 0.0020.8648.3330.039 −0.595 5.03 0.001 −1.134 7.47 TNFRSF11B tumor necrosis factor receptor superfamily, member 11b (osteoprotegerin) NM_008764 0.1470.5256.2 0.075−0.675 6.875 0.008 −1.2 5.675 Eicosanoid Signaling ALOX15 arachidonate 15-lipoxygenase NM_009660 0.2110.6948.6420.154−0.808 9.45 0.022 −1.5017.949 FPRL1 (includes EG:2358) formyl peptide receptor 2 NM_008039 0.266−0.3466.0490.1040.539 5.51 0.019 0.885 6.396 LAMB2 laminin, beta 2 (laminin S) NM_008483 0.0270.6087.6770.346−0.215 7.893 0.007 −0.8247.069 PGDS prostaglandin D2 synthase, hematopoietic NM_019455 0.112−1.7157.268 0.1031.77 5.498 0.009 3.485 8.984 PLA2G2D phospholipase A2, group IID NM_011109 0.0911.3387.4130.107 −1.261 8.674 0.007 −2.66.075 PLA2G2E phospholipase A2, group IIE NM_012044 0.229−0.45410.0540.0041.54 8.514 0.001 1.993 10.508 PLA2G5 phospholipase A2, group V NM_0011229540.039−1.493.435 0.0941.126 2.309 0.003 2.615 4.924 PNPLA3 patatin-like phospholipase domain containing 3 NM_054088 0.3090.3519.1540.157−0.51 9.663 0.033 −0.861 8.803 PTGER2 prostaglandin E receptor 2 (subtype EP2), 53 kDa NM_008964 0.159−0.4367.244 0.011 0.975 6.269 0.002 1.41 7.68 PTGER4 prostaglandin E receptor 4 (subtype EP4) AV230399 0.4640.1513.1210.0191.147 3.326 0.031 1.011 4.337 PTGES prostaglandin E synthase NM_022415 0.0441.00411.72 0.026 −1.15 9.87 0.007 −1.5910.716 PTGS1 prostaglandin-endoperoxide synthase 1 (prostaglandin G/H synthase and cyclooxygenase) NM_008969 0.0130.67410.6010.108−0.393 9.35 0.002 −0.969.927 TBXAS1 thromboxane A synthase 1 (platelet, cytochrome P450, family 5, subfamily A) NM_011539 0.095−0.414 10.70.023 0.63 10.07 0.002 1.044 11.113 WISP2 WNT1 inducible signaling pathway protein 2 NM_016873 0.038−2.089.333 0.0043.495 5.837 0 5.576 11.413 YWHAZ tyrosine 3-monooxygenase/ tryptophan 5-monooxygenase activation protein, zeta polypeptide NM_011740 0.008−0.8767.2730.447 −0.188 7.461 0.024 0.6888.148 Coagulation System F10 coagulation factor X NM_007972 0.11−0.3153.270.002 1.908 6.065 0 1.201 3.585 F2R coagulation factor II (thrombin) receptor NM_010169 0.159−0.58710.4280.1160.669 9.76 0.013 1.256 11.015 F7 coagulation factor VII (serum prothrombin conversion accelerator) NM_010172 0.232−1.26510.19 0.005 4.092 6.099 0.001 5.356 11.455 Copyright © 2013 SciRes. OPEN ACCESS  J. Tseng-Crank et al. / Open Journal of Genetics 3 (2013) 9-86 81 Continued PLAUR plasminogen activator, urokinase receptor NM_011113 0.009−0.4159.1510 0.855 8.296 0 1.27 9.565 SERPINA1 serpin peptidase inhibitor, clade A (alpha-1 antiproteinase, antitrypsin), member 1 NM_009243 0.002−1.0464.6530.2640.242 4.411 0 1.2885.699 SERPINE1 serpin peptidase inhibitor, clade E (nexin, plasminogen activator inhibitor type 1), member 1 NM_008871 0.044−1.6158.7570.4030.578 8.179 0.013 2.19410.373 TFPI tissue factor pathway inhibitor (lipoprotein- associated coagulation inhibitor) NM_011576 0.0450.7718.8770.004−0.514 9.297 0.002 −1.422 9.384 THBD thrombomodulin NM_009378 0.0010.77712.7510.001−0.829 13.58 0 −1.606 11.974 Aryl Hydrocarbon Receptor Signaling ALDH3B1 aldehyde dehydrogenase 3 family, member B1 NM_026316 0.017−0.567.8480.0460.431 7.417 0.001 0.992 8.409 ALDH5A1 aldehyde dehydrogenase 5 family, member A1 (succinate-semialdehyde dehydrogenase) NM_172532 0.0120.80210.1080.459−0.18 10.288 0.004 −0.9829.306 ALDH6A1 aldehyde dehydrogenase 6 family, member A1 NM_134042 0.0020.50312.5660.009−0.359 12.925 0 −0.862 12.064 ARNT aryl hydrocarbon receptor nuclear translocator NM_001037737 0.010.8316.1190.002 −0.259 8.705 0 −0.425 8.28 BAX BCL2-associated X protein NM_007527 0.033−0.45111.4660.0560.386 11.079 0.002 0.83711.917 CCNA2 cyclin A2 NM_009828 0.02−1.437.361 0.015 1.519 5.842 0.001 2.949 8.79 CCNE1 cyclin E1 NM_007633 0.071−0.6717.7280.140.523 7.205 0.008 1.194 8.398 CDK6 cyclin-dependent kinase 6 NM_009873 0.024−0.7629.0290.0930.629 7.834 0.003 1.211 9.791 CDKN1A cyclin-dependent kinase inhibitor 1A (p21, Cip1) NM_001111099 0.026−0.6799.893 0.001 1.468 8.425 0 2.14610.571 CDKN1B cyclin-dependent kinase inhibitor 1B (p27, Kip1) NM_009875 0.1250.398.6960.093−0.436 9.132 0.009 −0.826 8.306 E2F1 E2F transcription factor 1 NM_007891 0.085−0.3546.9770.0160.663 8.141 0.002 0.904 7.331 ESR1 estrogen receptor 1 NM_007956 0.0410.526.0970.033 −0.551 6.648 0.002 −1.071 5.577 FOS v-fos FBJ murine osteosarcoma viral oncogene homolog NM_010234 0.077−1.08910.7590.2070.725 10.034 0.012 1.81311.848 GSTA3 glutathione S-transferase A3 NM_001077353 0.0610.95311.4150.127 −0.725 9.233 0.006 −1.6567.577 GSTA4 glutathione S-transferase A4 NM_010357 0.040.85311.3860.122 −0.589 11.975 0.004 −1.441 10.533 GSTT1 glutathione S-transferase theta 1 NM_008185 0.0130.5912.7910.026−0.502 13.293 0.001 −1.092 12.201 HSPB2 heat shock 27 kDa protein 2 NM_024441 0.003−0.8698.930.0830.393 8.537 0 1.262 9.799 NFIA nuclear factor I/A NM_001122952 0.0020.7996.2890.004−0.657 6.946 0 −1.456 5.49 Copyright © 2013 SciRes. OPEN ACCESS  J. Tseng-Crank et al. / Open Journal of Genetics 3 (2013) 9-86 82 Continued NFKB2 nuclear factor of kappa light polypeptide gene enhancer in B-cells 2 (p49/p100) NM_019408 0.3−0.2838.3790.0450.625 7.754 0.01 0.908 8.662 NR2F1 nuclear receptor subfamily 2, group F, member 1 NM_010151 0.0220.7445.6750.052−0.594 6.269 0.001 −1.3384.931 NRIP1 nuclear receptor interacting protein 1 NM_173440 0.0020.67510.3560.004−0.572 10.928 0 −1.2479.681 RB1 retinoblastoma 1 (including osteosarcoma) NM_009029 0.038−0.654.4830.0980.483 4.001 0.003 1.133 5.134 TGFB3 transforming growth factor, beta 3 NM_009368 0.0010.49510.6690.009−0.337 11.006 0 −0.83210.174 NFkB Signaling BCL3 B-cell CLL/lymphoma 3 NM_033601 0.03−0.3928.2810.0020.684 7.596 0 1.076 8.672 BMP4 bone morphogenetic protein 4 NM_007554 0.0041.21110.683 0.476 −0.209 10.892 0.002 −1.4219.471 CARD10 caspase recruitment domain family, member 10 NM_130859 0.0060.72511.0390.286−0.209 11.248 0.002 −0.93410.315 CD40 CD40 molecule, TNF receptor superfamily member 5 NM_011611 0.005−0.6547.3440.1680.241 7.103 0.001 0.895 7.998 EGFR epidermal growth factor receptor (erythroblastic leukemia viral (v-erb-b) oncogene homolog, avian) NM_007912 0.2510.4194.9920.095−0.381 9.611 0.024 −0.976 4.573 IL1R2 interleukin 1 receptor, type II NM_010555 0.002−1.4532.7190.3180.305 2.413 0.001 1.759 4.172 IL1RN interleukin 1 receptor antagonist NM_001039701 0.005−1.8052.2030 3.3 3.963 0 4.59 8.553 INSR insulin receptor NM_001033381 0 0.6689.9370.022−0.275 10.212 0 −0.9439.269 MAP2K7 mitogen-activated protein kinase kinase 7 NM_001042557 0.1140.6134.4990.2710.348 3.444 0.032 −0.912 3.887 MAP3K3 mitogen-activated protein kinase kinase kinase 3 NM_011947 0.049−2.0115.5490.137 −1.412 6.962 0.092 −0.237 9.719 NFKB2 nuclear factor of kappa light polypeptide gene enhancer in B-cells 2 (p49/p100) NM_019408 0.3−0.2838.3790.0450.625 7.754 0.01 0.908 8.662 PIK3CA phosphoinositide-3-kinase, catalytic, alpha polypeptide NM_008839 0.0010.6456.7550.127−0.249 7.833 0 −0.815 6.11 PIK3CD phosphoinositide-3-kinase, catalytic, delta polypeptide NM_001029837 0.053−0.5486.2160.256 −0.386 9.26 0.012 0.813 6.764 PIK3R1 phosphoinositide-3-kinase, regulatory subunit 1 (alpha) NM_001024955 0.0090.628 9.6450.001−0.697 13.043 0 −1.4029.017 PIK3R3 phosphoinositide-3-kinase, regulatory subunit 3 (gamma) NM_181585 0.281−0.2867.8270.060.555 7.271 0.012 0.841 8.112 PIK3R5 phosphoinositide-3-kinase, regulatory subunit 5 NM_177320 0.155−0.6927.330.022 1.299 6.031 0.003 1.991 8.022 TLR1 toll-like receptor 1 NM_030682 0.043−1.2177.0190.1950.699 6.32 0.007 1.916 8.236 TLR7 toll-like receptor 7 NM_133211 0.083−0.7043.1970.4050.317 7.567 0.042 0.904 8.47 TLR8 toll-like receptor 8 NM_133212 0.048−1.5665.652 0.104 1.213 4.438 0.004 2.779 7.218 Copyright © 2013 SciRes. OPEN ACCESS  J. Tseng-Crank et al. / Open Journal of Genetics 3 (2013) 9-86 83 Continued TNFRSF11A tumor necrosis factor receptor superfamily, member 11a, NFKB activator NM_009399 0.046−0.8642.4890.3850.345 4.948 0.018 1.169 6.117 TNFRSF11B tumor necrosis factor receptor superfamily, member 11b (osteoprotegerin) NM_008764 0.1470.5256.2 0.075−0.675 6.875 0.008 −1.2 5.675 TRA@ T cell receptor alpha locus XM_0014715820.038 −1.4388.857 0.035 1.472 7.385 0.002 2.909 10.295 TRAF3 TNF receptor-associated factor 3 NM_0010482060.046 −0.5623.9270.1460.376 3.551 0.005 0.939 4.489 TRAF5 TNF receptor-associated factor 5 NM_011633 0.001−0.4637.5430 0.469 7.074 0 0.932 8.006 TRG@ T cell receptor gamma locus NM_011558 0.2620.3963.9950.072−0.695 4.69 0.013 −1.09 3.599 IGF-1 Signaling FOS v-fos FBJ murine osteosarcoma viral oncogene homolog NM_010234 0.077−1.08910.7590.2070.725 10.034 0.012 1.813 11.848 FOXO1 forkhead box O1 NM_019739 0.0070.656 10.7560.1−0.323 11.079 0.001 −0.979 10.1 IGF1R insulin-like growth factor 1 receptor NM_010513 0.010.7458.2210.228−0.275 8.496 0.002 −1.019 7.476 IGFBP2 insulin-like growth factor binding protein 2, 36 kDa NM_008342 0.0050.6016.2530 −1.694 7.948 0 −2.296 5.652 IRS1 insulin receptor substrate 1 NM_010570 0.0061.38711.258 0.089−0.681 11.939 0.001 −2.067 9.872 NEDD4 neural precursor cell expressed, developmentally down-regulated 4 NM_010890 0 0.70912.250.006−0.107 12.357 0 −0.81611.541 NOV nephroblastoma overexpressed gene NM_010930 0.0890.9017.8810.379 −0.424 8.306 0.024 −1.3266.98 PIK3CA phosphoinositide-3-kinase, catalytic, alpha polypeptide NM_008839 0.0010.6456.7550.127−0.249 7.833 0 −0.8156.11 PIK3CD phosphoinositide-3-kinase, catalytic, delta polypeptide NM_0010298370.053 −0.5486.2160.256 −0.386 9.26 0.012 0.813 6.764 PIK3R1 phosphoinositide-3-kinase, regulatory subunit 1 (alpha) NM_0010249550.0090.6289.6450.001 −0.697 13.043 0 −1.402 9.017 PIK3R3 phosphoinositide-3-kinase, regulatory subunit 3 (gamma) NM_181585 0.281−0.2867.8270.060.555 7.271 0.012 0.841 8.112 PIK3R5 phosphoinositide-3-kinase, regulatory subunit 5 NM_177320 0.155−0.6927.330.0221.299 6.031 0.003 1.991 8.022 PRKCH protein kinase C, eta NM_008856 0.087−0.74310.472 0.0270.997 7.892 0.003 1.594 9.486 YWHAE tyrosine 3-monooxygenase/ tryptophan 5-monooxygenase activation protein, epsilon polypeptide BF714941 0.0121.2195.8740.053−0.267 8.76 0.003 −1.598 4.655 YWHAZ tyrosine 3-monooxygenase/ tryptophan 5-monooxygenase activation protein, zeta polypeptide NM_011740 0.008−0.8767.2730.447 −0.188 7.461 0.024 0.6888.148 Fc Epsilon RI Signaling Copyright © 2013 SciRes. OPEN ACCESS  J. Tseng-Crank et al. / Open Journal of Genetics 3 (2013) 9-86 84 Continued BTK Bruton agammaglobulinemia tyrosine kinase NM_013482 0.009−1.0579.3760.6070.153 9.223 0.005 1.21 10.433 FCER1A Fc fragment of IgE, high affinity I, receptor for; alpha polypeptide NM_010184 0.05−1.0437.4850.8080.109 7.375 0.035 1.152 8.528 FCER1G Fc fragment of IgE, high affinity I, receptor for; gamma polypeptide NM_010185 0.032−0.57314.1570.2560.26 13.897 0.006 0.833 14.73 LCP2 lymphocyte cytosolic protein 2 (SH2 domain containing leukocyte protein of 76 kDa) NM_010696 0.082−0.3629.4480.030.488 8.96 0.002 0.85 9.809 LYN v-yes-1 Yamaguchi sarcoma viral related oncogene homolog NM_0011110960.047 −0.51610.2230.2110.291 9.933 0.008 0.806 10.739 MAP2K7 mitogen-activated protein kinase kinase 7 NM_0010425570.1140.613 4.4990.2710.348 3.444 0.032 −0.912 3.887 MAPK14 mitogen-activated protein kinase 14 NM_011951 0.0020.8467.580.062−0.064 12.45 0 −0.194 12.256 PIK3CA phosphoinositide-3-kinase, catalytic, alpha polypeptide NM_008839 0.0010.6456.7550.127−0.249 7.833 0 −0.8156.11 PIK3CD phosphoinositide-3-kinase, catalytic, delta polypeptide NM_0010298370.053 −0.5486.2160.256−0.386 9.26 0.012 0.813 6.764 PIK3R1 phosphoinositide-3-kinase, regulatory subunit 1 (alpha) NM_0010249550.0090.6289.6450.001 −0.697 13.043 0 −1.402 9.017 PIK3R3 phosphoinositide-3-kinase, regulatory subunit 3 (gamma) NM_181585 0.281−0.2867.8270.060.555 7.271 0.012 0.841 8.112 PIK3R5 phosphoinositide-3-kinase, regulatory subunit 5 NM_177320 0.155−0.6927.330.022 1.299 6.031 0.003 1.9918.022 PLA2G2D phospholipase A2, group IID NM_011109 0.0911.3387.4130.107−1.261 8.674 0.007 −2.6 6.075 PLA2G2E phospholipase A2, group IIE NM_012044 0.229−0.45410.054 0.0041.54 8.514 0.001 1.993 10.508 PLA2G5 phospholipase A2, group V NM_0011229540.039−1.493.4350.0941.126 2.309 0.003 2.6154.924 PRKCH protein kinase C, eta NM_008856 0.087−0.74310.472 0.0270.997 7.892 0.003 1.5949.486 PRKD1 protein kinase D1 NM_008858 0 0.37710.7130 −0.515 11.227 0 −0.892 10.336 VAV1 vav 1 guanine nucleotide exchange factor NM_011691 0.044−0.7045.7550.2090.391 5.363 0.007 1.095 6.458 VAV3 vav 3 guanine nucleotide exchange factor NM_020505 0.072−0.7688.7430.1160.582 3.591 0.009 1.336 9.51 B Cell Receptor Signaling BCL2A1 BCL2-related protein A1 NM_007534 0.11−0.78410.911 0.0580.973 9.938 0.005 1.75611.694 BCL3 B-cell CLL/lymphoma 3 NM_033601 0.03−0.3928.2810.0020.684 7.596 0 1.0768.672 BLNK B-cell linker NM_008528 0.054−1.111 11.9960.090.942 11.054 0.004 2.053 13.107 BTK Bruton agammaglobulinemia tyrosine kinase NM_013482 0.009−1.0579.3760.6070.153 9.223 0.005 1.21 10.433 CAMK2D calcium/calmodulin-dependent protein kinase (CaM kinase) II delta NM_0010254380.0620.0872.365 0.496 −0.25 7.43 0.038 −0.902 6.528 CARD10 caspase recruitment domain family, member 10 NM_130859 0.0060.72511.0390.286−0.209 11.248 0.002 −0.934 10.315 Copyright © 2013 SciRes. OPEN ACCESS  J. Tseng-Crank et al. / Open Journal of Genetics 3 (2013) 9-86 Copyright © 2013 SciRes. 85 Continued FCGR2A Fc fragment of IgG, low affinity IIa, receptor (CD32) NM_010188 0.051−0.46712.20.1250.343 11.857 0.005 0.8112.667 FRAP1 FK506 binding protein 12-rapamycin associated protein 1 NM_020009 0.05−0.8254.1570.274−0.144 10.371 0.031 0.9384.981 IKBKE inhibitor of kappa light polypeptide gene enhancer in B-cells, kinase epsilon NM_019777 0.013−0.5558.5310.0290.456 8.075 0.001 1.012 9.086 LYN v-yes-1 Yamaguchi sarcoma viral related oncogene homolog NM_0011110960.047 −0.51610.2230.2110.291 9.933 0.008 0.806 10.739 MAP2K7 mitogen-activated protein kinase kinase 7 NM_0010425570.1140.613 4.4990.2710.348 3.444 0.032 −0.912 3.887 MAP3K13 mitogen-activated protein kinase kinase kinase 13 XM_0014808120.10.6764.220.4430 2.122 0.05 −0.853.543 MAP3K3 mitogen-activated protein kinase kinase kinase 3 NM_011947 0.049−2.0115.5490.137−1.412 6.962 0.092 −0.2379.719 MAPK14 mitogen-activated protein kinase 14 NM_011951 0.0020.8467.580.062−0.064 12.45 0 −0.194 12.256 PIK3AP1 phosphoinositide-3-kinase adaptor protein 1 NM_031376 0.056−1.3866.5840.3120.652 5.932 0.013 2.038 7.97 PIK3CA phosphoinositide-3-kinase, catalytic, alpha polypeptide NM_008839 0.0010.6456.7550.127−0.249 7.833 0 −0.815 6.11 PIK3CD phosphoinositide-3-kinase, catalytic, delta polypeptide NM_0010298370.053 −0.5486.2160.256−0.386 9.26 0.012 0.813 6.764 PIK3R1 phosphoinositide-3-kinase, regulatory subunit 1 (alpha) NM_0010249550.0090.6289.6450.001 −0.697 13.043 0 −1.4029.017 PIK3R3 phosphoinositide-3-kinase, regulatory subunit 3 (gamma) NM_181585 0.281−0.2867.8270.060.555 7.271 0.012 0.841 8.112 PIK3R5 phosphoinositide-3-kinase, regulatory subunit 5 NM_177320 0.155−0.6927.330.0221.299 6.031 0.003 1.991 8.022 VAV1 vav 1 guanine nucleotide exchange factor NM_011691 0.044−0.7045.7550.2090.391 5.363 0.007 1.095 6.458 VAV3 vav 3 guanine nucleotide exchange factor NM_020505 0.072−0.7688.7430.1160.582 3.591 0.009 1.336 9.51 Supplement Tables 1-4. Heatmaps in Supplement Fig- ure 4 listed the pathways by rank order of statistical sig- nificance. span when sirtuin activity is heightened in response to caloric restriction [11]. The similarity between UP780 and resveratrol was observed in both the highest differ- ential gene expressions and in the significant metabolic and signaling pathways. Resveratrol was discovered through high throughput screening for sirtuin activation [11], while UP780’s discovery was designed not to be specific for enzymatic modification, but for increased adiponectin secretion from differentiate 3T3-L1 adipocytes [1]. 2.3. Comparison to Similar Microarray Data Microarray results a few years ago were notorious for data variability when comparing similar studies from dif- ferent laboratories. To confirm our microarray result to the published gene expression studies, two similar liver microarray datasets from similar DIO mouse models [11, 12] were compared to our LC/LV/LUP dataset. Side-by- side comparisons were remarkably similar. One dataset, that of the resveratrol treated DIO model [11], was iden- tical to our experimental design of lean control, HFD, and HFD+resveratrol treatments. Not only were the com- parisons between lean control and HFD similar, but also the comparisons between LUP vs. LV and HFD + res- veratrol vs. HFD similar. Resveratrol, a phenolic com- pound from grape, activates sirtuin, a protein known from yeast, Drosophila, and C. elegan to prolong life REFERENCES [1] Yimam, M., Zhao, J., Corneliusen, B., Pantier, M., Brow- nell, L. and Jia, Q. (2012) UP780, a chromone enriched Aloe composition, improves insulin sensitivity. Metabolic Syndrome and Related Disorders, 10, 319-386. [2] GeneChip Expression Analysis Technical Manual. http://media.affymetrix.com/support/downloads/manuals/ expression_analysis_technical_manual.pdf [3] Affymetrix Expression Console Software. OPEN ACCESS  J. Tseng-Crank et al. / Open Journal of Genetics 3 (2013) 9-86 86 http://www.affymetrix.com/estore/browse/level_seven_so ftware_products_only.jsp?navMode=34000&productId=1 31414&navAction=jump&aId=productsNav#1_3 [4] Bioconductor. http://www.bioconductor.org/ [5] Gentleman, R., Carey, V., Huber, W., Irizarry, R. and Du- doit, A. (2005) Bioinformatics and computational biology solutions using R and Bioconductor. Springer, New York. doi:10.1007/0-387-29362-0 [6] Smyth, G. (2004) Linear models and empirical Bayes methods for assessing differential expression in micro- array experiments. Statistical Applications in Genetics and Molecular Biology, 3, 1544-6115. doi:10.2202/1544-6115.1027 [7] OMIM’: Online Mendelian Inheritance in Man®. http://omim.org/ [8] Ingenuity pathway analysis. http://www.ingenuity.com/ [9] Wu, Z. and Irizarry, R.A. (2004) Preprocessing of oligo- nucleotide array data. Nature Biotechnology, 22, 656-658. doi:10.1038/nbt0604-656b [10] Saldanha, A.J. (2004) Java Treeview-extensible visualize- tion of microarray data. Bioinformatics, 20, 3246-3248. doi:10.1093/bioinformatics/bth349 [11] Baur, J.A., Pearson, K.J., Price, N.L., Jamieson, H.A., Le- rin, C., Kalra, A., Prabhu, V.V., Allard, J.S., Lopez-Lluch, G., Lewis, K., Pistell, P.J., Poosala, S., Becker, K.G., Boss, O., Gwinn, D., Wang, M., Ramaswamy, S., Fishbein, K.W., Spencer, R.G., Lakatta, E.G., Le Couteur, D., Shaw, R.J., Navas, P., Puigserver, P., Ingram, D.K., de Cabo, R. and Sinclair, D.A. (2006) Resveratrol improves health and survival of mice on a high-calorie diet. Nature, 444, 337- 342. doi:10.1038/nature05354 [12] Chan, M.Y., Zhao, Y. and Heng, C.K. (2008) Sequential responses to high-fat and high-calorie feeding in an obese mouse model. Obesity (Silver Spring), 16, 972-978. doi:10.1038/oby.2008.32 Copyright © 2013 SciRes. OPEN ACCESS
|