Optics and Photonics Journal, 2013, 3, 236-239
doi:10.4236/opj.2013.32B055 Published Online June 2013 (http://www.scirp.org/journal/opj)
Fiber Optic Sensors and Sensor Networks Using a
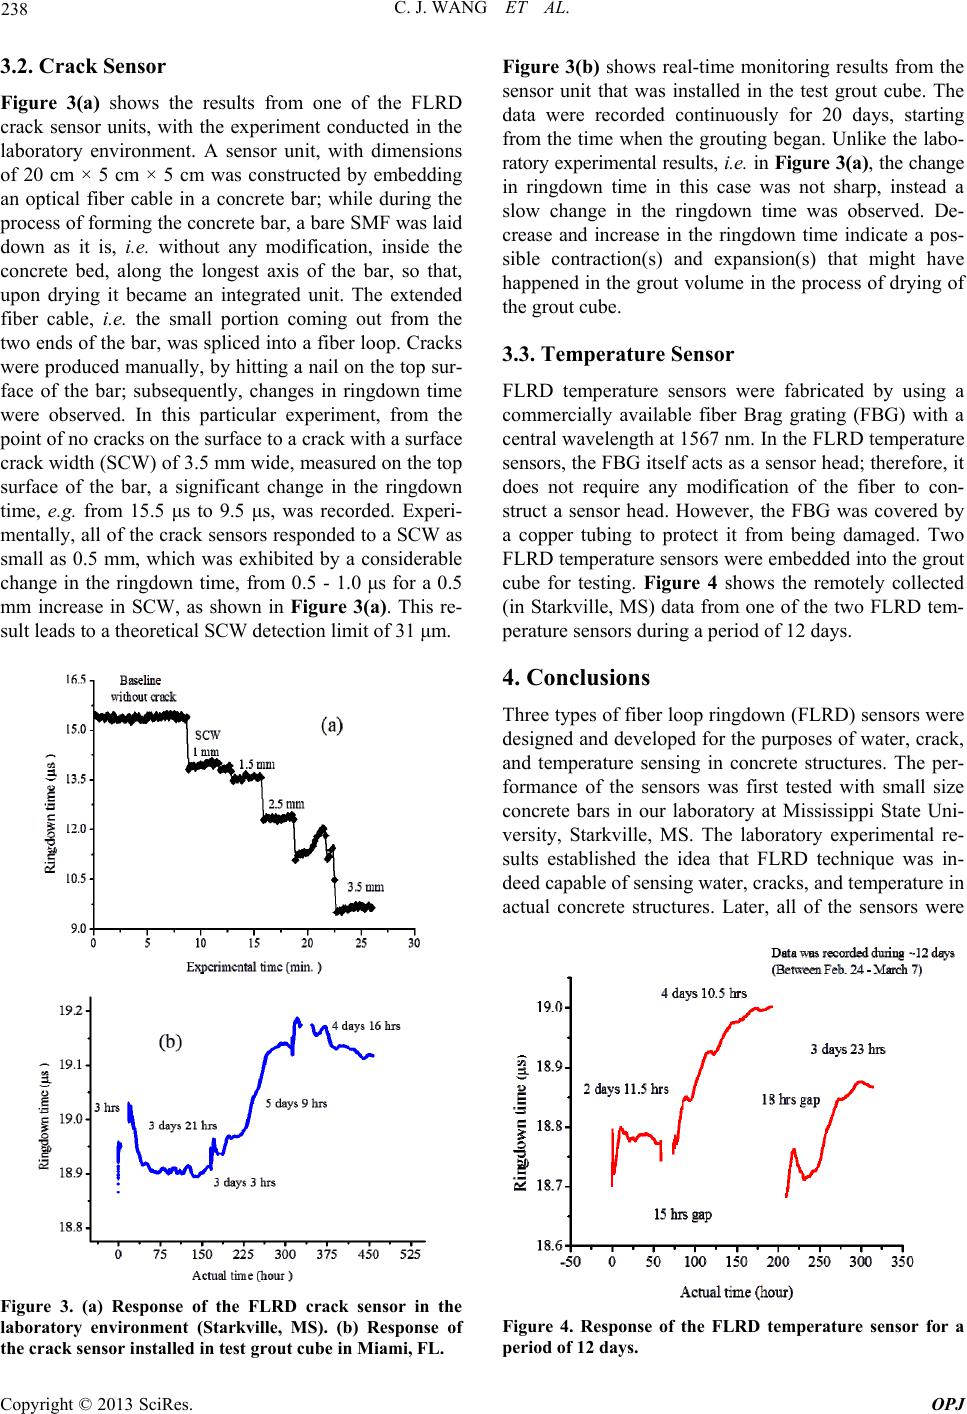
Time-domain Sensing Scheme
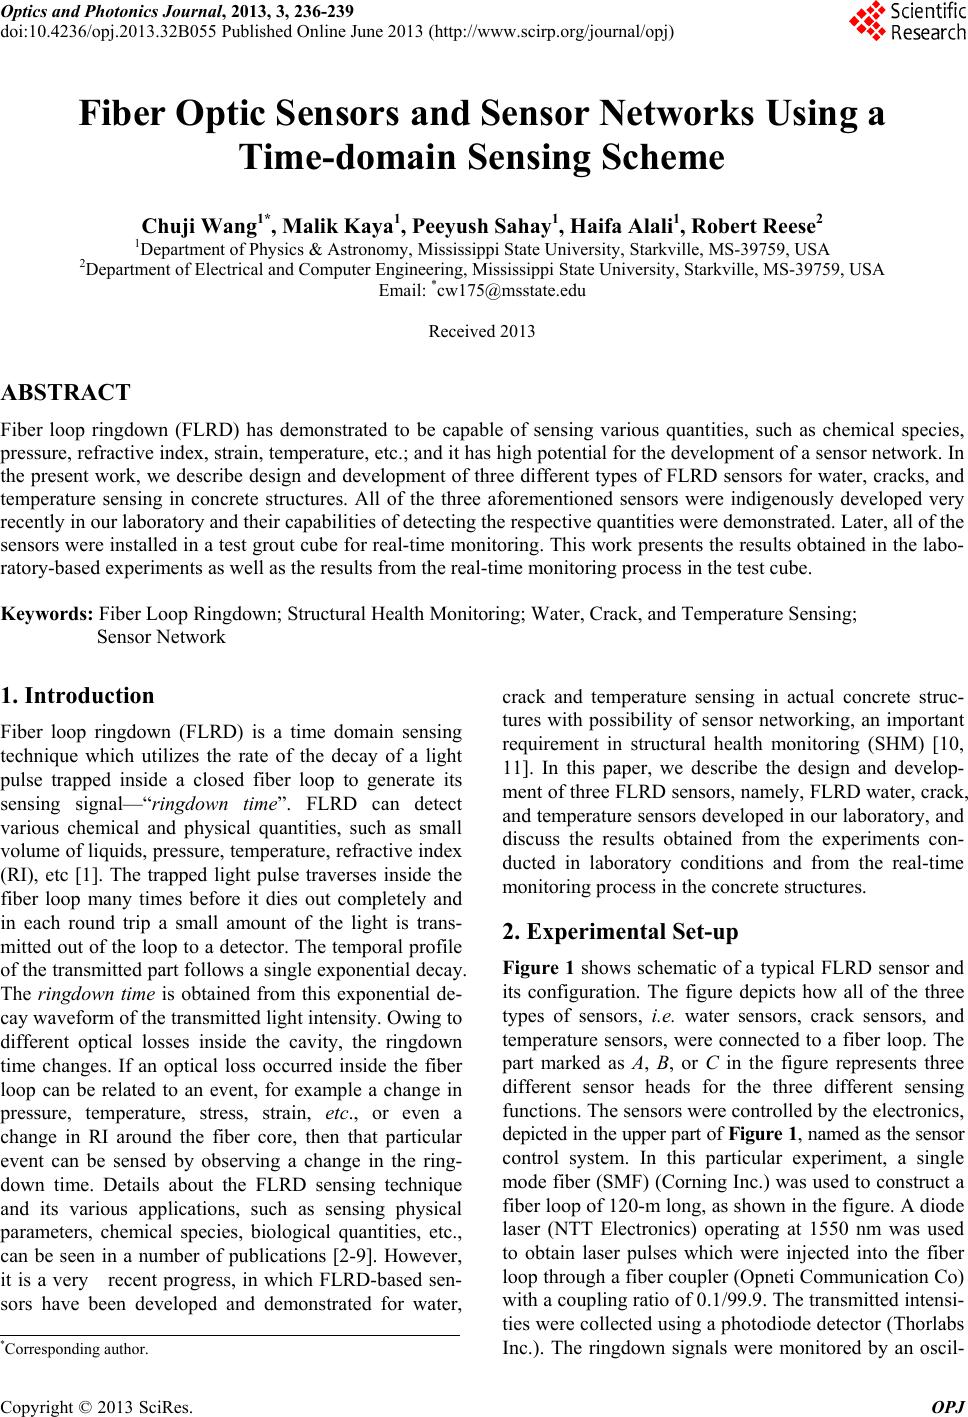
Chuji Wang1*, Malik Kaya1, Peeyush Sahay1, Haifa Alali1, Robert Reese2
1Department of Physics & Astronomy, Mississippi State University, Starkville, MS-39759, USA
2Department of Electrical and Computer Engineering, Mississippi State University, Starkville, MS-39759, USA
Email: *cw175@msstate.edu
Received 2013
ABSTRACT
Fiber loop ringdown (FLRD) has demonstrated to be capable of sensing various quantities, such as chemical species,
pressure, refractive index, strain, temperature, etc.; and it has high potential for the development of a sensor network. In
the present work, we describe design and development of three different types of FLRD sensors for water, cracks, and
temperature sensing in concrete structures. All of the three aforementioned sensors were indigenously developed very
recently in our laboratory and their capabilities of detecting the respective quantities were demonstrated. Later, all of the
sensors were installed in a test grout cube for real-time monitoring. This work presents the results obtained in the labo-
ratory-based experiments as well as the results from the real-time monitoring process in the test cube.
Keywords: Fiber Loop Ringdown; Structural Health Monitoring; Water, Crack, and Temperature Sensing;
Sensor Network
1. Introduction
Fiber loop ringdown (FLRD) is a time domain sensing
technique which utilizes the rate of the decay of a light
pulse trapped inside a closed fiber loop to generate its
sensing signal—“ringdown time”. FLRD can detect
various chemical and physical quantities, such as small
volume of liquids, pressure, temperature, refractive index
(RI), etc [1]. The trapped light pulse traverses inside the
fiber loop many times before it dies out completely and
in each round trip a small amount of the light is trans-
mitted out of the loop to a detector. The temporal profile
of the transmitted part follows a single exponential decay.
The ringdown time is obtained from this exponential de-
cay waveform of the transmitted light intensity. Owing to
different optical losses inside the cavity, the ringdown
time changes. If an optical loss occurred inside the fiber
loop can be related to an event, for example a change in
pressure, temperature, stress, strain, etc., or even a
change in RI around the fiber core, then that particular
event can be sensed by observing a change in the ring-
down time. Details about the FLRD sensing technique
and its various applications, such as sensing physical
parameters, chemical species, biological quantities, etc.,
can be seen in a number of publications [2-9]. However,
it is a very recent progress, in which FLRD-based sen-
sors have been developed and demonstrated for water,
crack and temperature sensing in actual concrete struc-
tures with possibility of sensor networking, an important
requirement in structural health monitoring (SHM) [10,
11]. In this paper, we describe the design and develop-
ment of three FLRD sensors, namely, FLRD water, crack,
and temperature sensors developed in our laboratory, and
discuss the results obtained from the experiments con-
ducted in laboratory conditions and from the real-time
monitoring process in the concrete structures.
2. Experimental Set-up
Figure 1 shows schematic of a typical FLRD sensor and
its configuration. The figure depicts how all of the three
types of sensors, i.e. water sensors, crack sensors, and
temperature sensors, were connected to a fiber loop. The
part marked as A, B, or C in the figure represents three
different sensor heads for the three different sensing
functions. The sensors were controlled by the electronics,
depicted in the upper part of Figure 1, named as the sensor
control system. In this particular experiment, a single
mode fiber (SMF) (Corning Inc.) was used to construct a
fiber loop of 120-m long, as shown in the figure. A diode
laser (NTT Electronics) operating at 1550 nm was used
to obtain laser pulses which were injected into the fiber
loop through a fiber coupler (Opneti Communication Co)
with a coupling ratio of 0.1/99.9. The transmitted intensi-
ties were collected using a photodiode detector (Thorlabs
Inc.). The ringdown signals were monitored by an oscil-
*Corresponding author.
Copyright © 2013 SciRes. OPJ
C. J. WANG ET AL. 237
loscope; subsequently, changes in ringdown time were
recorded by a computer. A brief discussion on the in-
strumentation process of the three sensors is described in
their respective sections later.
3. Results and Discussion
The first-hand experiments with all three sensors were
conducted in our laboratory. Subsequently, all of the
three types of sensors were deployed in a test grout cube
with dimensions of 10 ft × 10 ft × 8 ft, in the designated
test site of the US Department of Energy, located in
Miami, Florida, for real-time monitoring. First, the sen-
sors were installed in an installation panel and the panel
was then loaded inside the test cube that later was en-
tombed by wet grout. Upon drying of the grout, the sen-
sors remain embedded in the grout cube. The extended
arms of the fiber cable, from the sensor unit, coming out
of the grout cube were connected to the sensor control
system in a similar way as shown in Figure 1. The sen-
sors were switched alternatively one at a time and the
data from all of the sensors were recorded individually,
often for a long duration of time, i.e. a few hours to a few
days.
Some of the results obtained from both the experi-
ments, i.e. in the laboratory environment and in the real-
time monitoring in the test grout site (Miami, FL), for the
three types of the sensors, are presented below.
3.1. Water Sensor
After the plastic jacket of the single mode fiber (SMF)
was removed, one section of the fiber was etched in a
48% Hydrofluoric (HF) acid solution for 32 - 33 min to
prepare a FLRD water sensor head. Once a water sensor
head was created, concrete was prepared by mixing ce-
ment-aggregate (Quikrete) and water. After a half of a
Figure 1. A laboratory-based fiber loop ringdown system.
One sensor control system operates multiple FLRD sensor
units, e.g. sensor units A, B, and C.
carton bar, with dimensions of 35 cm × 5 cm × 5 cm, was
filled with the concrete, the etched fiber was placed in-
side the concrete bed and the carton bar were filled com-
pletely. It took about two days for the concrete bar to dry
out completely. The sensor head remained embedded in
the concrete bar, forming one sensor unit. Figure 2
shows FLRD water sensor’s response, for a time duration
of 19 hrs, with the experiment conducted under labora-
tory conditions. After the 1-hr data collection with the
dry concrete bar, 10 ml water was poured on the concrete
bar surface to test the sensor’s response. Whenever the
poured water reached the sensor head, the FLRD sensor
sensed the water in near-real time, resulting a change in
ringdown time. Later, the ringdown time decreased
gradually and returned to the baseline when the concrete
bar dried out again.
Figure 2(b) shows the data collected from the FLRD
water sensor after the sensor was embedded into the test
grout cube. The data shows the FLRD water sensor’s
behavior before, during, and after the grouting process.
The increase in the ringdown time suggests the presence
of water around the sensor head, which dried out in time
later, as exhibited by the decrease in the ringdown time.
Figure 2. (a) Response of the FLRD water sensor; experi-
ment conducted under labora tory conditions. (b) Data from
the FLRD water sensor embedded in the test grout cube
that was located in Miami, FL.
Copyright © 2013 SciRes. OPJ
C. J. WANG ET AL.
238
3.2. Crack Sensor
Figure 3(a) shows the results from one of the FLRD
crack sensor units, with the experiment conducted in the
laboratory environment. A sensor unit, with dimensions
of 20 cm × 5 cm × 5 cm was constructed by embedding
an optical fiber cable in a concrete bar; while during the
process of forming the concrete bar, a bare SMF was laid
down as it is, i.e. without any modification, inside the
concrete bed, along the longest axis of the bar, so that,
upon drying it became an integrated unit. The extended
fiber cable, i.e. the small portion coming out from the
two ends of the bar, was spliced into a fiber loop. Cracks
were produced manually, by hitting a nail on the top sur-
face of the bar; subsequently, changes in ringdown time
were observed. In this particular experiment, from the
point of no cracks on the surface to a crack with a surface
crack width (SCW) of 3.5 mm wide, measured on the top
surface of the bar, a significant change in the ringdown
time, e.g. from 15.5 μs to 9.5 μs, was recorded. Experi-
mentally, all of the crack sensors responded to a SCW as
small as 0.5 mm, which was exhibited by a considerable
change in the ringdown time, from 0.5 - 1.0 μs for a 0.5
mm increase in SCW, as shown in Figure 3(a). This re-
sult leads to a theoretical SCW detection limit of 31 μm.
Figure 3. (a) Response of the FLRD crack sensor in the
laboratory environment (Starkville, MS). (b) Response of
the crack sensor installed in test grout cube in Miami, FL.
Figure 3(b) shows real-time monitoring results from the
sensor unit that was installed in the test grout cube. The
data were recorded continuously for 20 days, starting
from the time when the grouting began. Unlike the labo-
ratory experimental results, i.e. in Figure 3(a), the change
in ringdown time in this case was not sharp, instead a
slow change in the ringdown time was observed. De-
crease and increase in the ringdown time indicate a pos-
sible contraction(s) and expansion(s) that might have
happened in the grout volume in the process of drying of
the grout cube.
3.3. Temperature Sensor
FLRD temperature sensors were fabricated by using a
commercially available fiber Brag grating (FBG) with a
central wavelength at 1567 nm. In the FLRD temperature
sensors, the FBG itself acts as a sensor head; therefore, it
does not require any modification of the fiber to con-
struct a sensor head. However, the FBG was covered by
a copper tubing to protect it from being damaged. Two
FLRD temperature sensors were embedded into the grout
cube for testing. Figure 4 shows the remotely collected
(in Starkville, MS) data from one of the two FLRD tem-
perature sensors during a period of 12 days.
4. Conclusions
Three types of fiber loop ringdown (FLRD) sensors were
designed and developed for the purposes of water, crack,
and temperature sensing in concrete structures. The per-
formance of the sensors was first tested with small size
concrete bars in our laboratory at Mississippi State Uni-
versity, Starkville, MS. The laboratory experimental re-
sults established the idea that FLRD technique was in-
deed capable of sensing water, cracks, and temperature in
actual concrete structures. Later, all of the sensors were
Figure 4. Response of the FLRD temperature sensor for a
period of 12 days.
Copyright © 2013 SciRes. OPJ
C. J. WANG ET AL.
Copyright © 2013 SciRes. OPJ
239
entombed in the test grout cube, with dimensions of 10 ft
× 10 ft × 8 ft, located in Miami, Florida, for evaluating
its performance in real-world scenarios. The sensors are
controlled and data are still being collected, remotely in
our laboratory. The results from both the experiments, i.e.
conducted in the laboratory and from the real-time
monitoring at the test site, have been discussed in this
work. This work represents, for the first time, the study
of FLRD technology in real-world applications.
5. Acknowledgements
The work is supported by the National Science Founda-
tion (grant #CMMI-0927539) and the US Department of
Energy through Savannah Nuclear Solutions (grant
#AC84132N).
REFERENCES
[1] C. Wang, “Fiber Loop Ringdown—A Time-Domain
Sensing Technique for Multi-Function Fiber Optic Sensor
Platforms: Current Status and Design Perspectives,” Sen-
sors, Vol. 9, No. 10, 2009, pp. 7595-7621.
doi:10.3390/s91007595
[2] G. Stewart, K. Atherton, H. Yu and B. Culshaw, “An
Investigation of An Optical Fibre Amplifier Loop for In-
tracavity and Ring-Down Cavity Loss Measurements,”
Measurement Science and Technology, Vol. 12, No. 7,
2001, pp. 843-849. doi:10.1088/0957-0233/12/7/316
[3] R. S. Brown, I. Kozin, Z. Tong, R. D. Oleschuk and H. P.
Loock, “Fiber-Loop Ring-Down Spectroscopy,” Chemi-
cal Physics Letters, Vol. 117, No. 23, 2002, pp.
10444-10447. doi:10.1063/1.1527893
[4] P. B. Tarsa, P. Rabinowitz and K. K. Lehmann, “Evanes-
cent Field Absorption in A Passive Optical Fiber Reso-
nator Using Continuous-Wave Cavity Ring-Down Spec-
troscopy,” Chemical Physics Letters, Vol. 383, No. 3,
2004, pp. 297-303. doi:10.1016/j.cplett.2003.11.043
[5] C. Wang and S. T. Scherrer, “Fiber Ringdown Pressure
Sensors,” Optics Letters, Vol. 29, No. 4, 2004, pp.
352-354. doi:10.1364/OL.29.000352
[6] C. Wang and S. T. Scherrer, “Fiber Loop Ringdown for
Physical Sensor Development: Pressure Sensor,” Applied
Optics, Vol. 43, No. 35, 2004, pp. 6458-6464.
doi:10.1364/AO.43.006458
[7] C. Vallance, “Innovations in Cavity Ringdown Spectros-
copy,” New Journal of Chemistry, Vol. 29, No. 7, 2005,
pp. 867-874. doi:10.1039/B504628A
[8] C. Herath, C. Wang, M. Kaya and D. Cavalier, “Fiber
Loop Ringdown DNA and Bacteria Sensors,” Journal of
Biomedical Optic s, Vol. 16, No. 5, 2011, pp. 050501/1-3.
doi:10.1117/1.3572046
[9] H. Waechter, J. Litman, A. H. Cheung, J. A. Barnes and
H. P. Loock, “Chemical Sensing Using Fiber Cavity
Ring-Down Spectroscopy,” Sensors, Vol. 10, No. 3, 2010,
pp. 1716-1742. doi:10.3390/s100301716
[10] M. Kaya, P. Sahay and C. Wang, “Reproducibly Reversi-
ble Fiber Loop Ringdown Water Sensor Embedded in
Concrete and Grout for Water Monitoring,” Sensors and
Actuators B: Chemical, Vol. 176, 2012, pp. 803-810.
doi:10.1016/j.snb.2012.10.036
[11] P. Sahay, M. Kaya and C. Wang, “Fiber Loop Ringdown
Sensors for Potential Real-time Monitoring of Cracks in
Concrete Structures: An Exploratory Study,” Sensors,
Vol. 13, No. 1, 2013, pp. 39-57. doi: 10.3390/s130100039