Paper Menu >>
Journal Menu >>
 Open Journal of Forestry 2013. Vol.3, No.3, 75-78 Published Online July 2013 in SciRes (http://www.scirp.org/journal/ojf) http://dx.doi.org/10.4236/ojf.2013.33013 Copyright © 2013 SciRes. 75 Ponderosa Pine Seed Source Test in Nebraska in the Central Great Plains of the United States Wayne A. Geyer1*, Keith D. Lynch1, Peter Schaefer2, William R. Lovette3 1Division of Forestry, Kansas State University, Manhattan, USA 2Department of Plant Science, South Dakota University, Ve rmillion, USA 3 Nebraska Forest Service, Lincol n NE 68583 Nebraska For est Service, Lincoln, USA Email: *wgeyer@ksu.edu Received March 15th, 2013; revised Ma y 9th, 2013 ; ac ce p te d M ay 2 4 th, 2013 Copyright © 2013 Wayne A. Geyer et al. This is an open access article distributed under the Creative Commons Attribution License, which permits unrestricted use, distribution, and reproduction in any medium, provided the original work is properly cited. Ponderosa pine (Pinus ponderosa Laws) has been planted widely in the Great Plains for wind breaks. A 1968 study recommended using material from south-central South Dakota and north-central Nebraska. A second test to further delineate seed sources (families) from numerous collection sites in this region was established in 1986. This paper reports results for survival, height, diameter, and D2H (diameter squared X height) measurements at 15 years. Results identify a wide range of suitable families within the region. A majority of the tested sources performed well, thus verifying the original recommendations. Keywords: Pinus ponderosa; Provenance; Seed Source; Family; Tree Selection; Growth Characteristics Introduction Ponderosa pine (Pinus ponderosa Laws) is an important component of the windbreak agroforestry system in the Great Plains. Its drought tolerance, dense crown form, and tall growth habit make ponderosa pine excellent for windbreaks, sight bar- riers, and ornamental plantings (Flint, 1983). Ponderosa pine is one of the few tall trees that grow in the region. Because of its evergreen nature, it provides year-round protection to fields and farmsteads (Schaefer & Baer, 1985). The natural range of pon- derosa pine extends from British Columbia, Canada, southward into northern Mexico, and from California eastward into the Great Plains, excluding for Kansas (Crichfield & Little, 1966). Although ponderosa pine has been widely planted in the plains region, it has performed inconsistently. Western pine tip moth (Rhyacioniabushnelli) has caused widespread damage in the plains (Kopp et al., 1987), but out- standing performance of individual trees in the plains planta- tions suggests that proper selection could improve tree quality. Early studies determined that trees grown from seed col- lected from the northeastern range of ponderosa pine performed best in most of the provenance test plantations (Deneke & Read, 1975; Baer & Collins, 1979; Read, 1983; Schaefer & Baer, 1985, 1992; Van Haverbeke, 1986). Six years data from a Kan- sas plantation showed that early growth appeared to be clinally related to elevation of seed provenances (Deneke & Read, 1975). Plains nurseries have focused much of their ponderosa pine production on seed collections near Ainsworth and Valen- tine, Nebraska, and Rosebud, South Dakota. Trees from Jordan, Montana, also performed well in more than half of the early plantations (Read, 1983). In 1986, the GP-13 Technical Committee of the Great Plains Agricultural Council initiated a second cooperative ponderosa pine study in cooperation with the North Central and Rocky Mountain Forest Experiment Stations. The intent of this study was to further sample recommended provenances identified in the 1968 study. Collection sites are shown in Figure 1. Nine progeny tests were established in Saskatchewan (Canada), Montana, North Dakota, South Dakota, Nebraska, Kansas, Oklahoma, Texas, and Minnesota. This paper reports data from the Nebraska test. A previous report (Geyer & Schaefer, 2011) indicated that 1968 recommendations were valid for Kansas and South Dakota. Materials and Methods The tree plantation discussed in this report here used seed- lings representing 96 open-pollinated families (Figure 1, Table 1) that were planted in an individual tree factorial planting de- sign with 8 replications and 3.7 × 3.7 m (12 × 12 ft) plots. Each replication was included 5 trees in single-tree, noncomtiguous plots. Two border rows surrounded the plantation. A total of 3840 trees were planted. Weeds were controlled by cultivation for the first 3 years. The plantation was near Republican City, Nebraska, on an allu v i a l site . Superior height growth potential can be accurately identified at an early age (i.e., 5 to 15 years); (Lambeth, 1980; Read, 1983; Van Haverbeke, 1986; Schaefer & Baer, 1992). For analysis, we applied the GLM procedure of SAS (SAS Institute, 2003) for height, trunk diameter, and D2H (a measure of trunk vol- ume); Duncan’s multiple range test for mean separation; and chi-square for survival, stem crook, sweep, and number of ter- minal buds. Correlations were determined among height, di- ameter, D2H, and latitude and longitude of each major geo- graphic (provenance) location. The 13 major geographic zones (provenances) and 96 seed soures (families) were compared. *Corresponding author. c 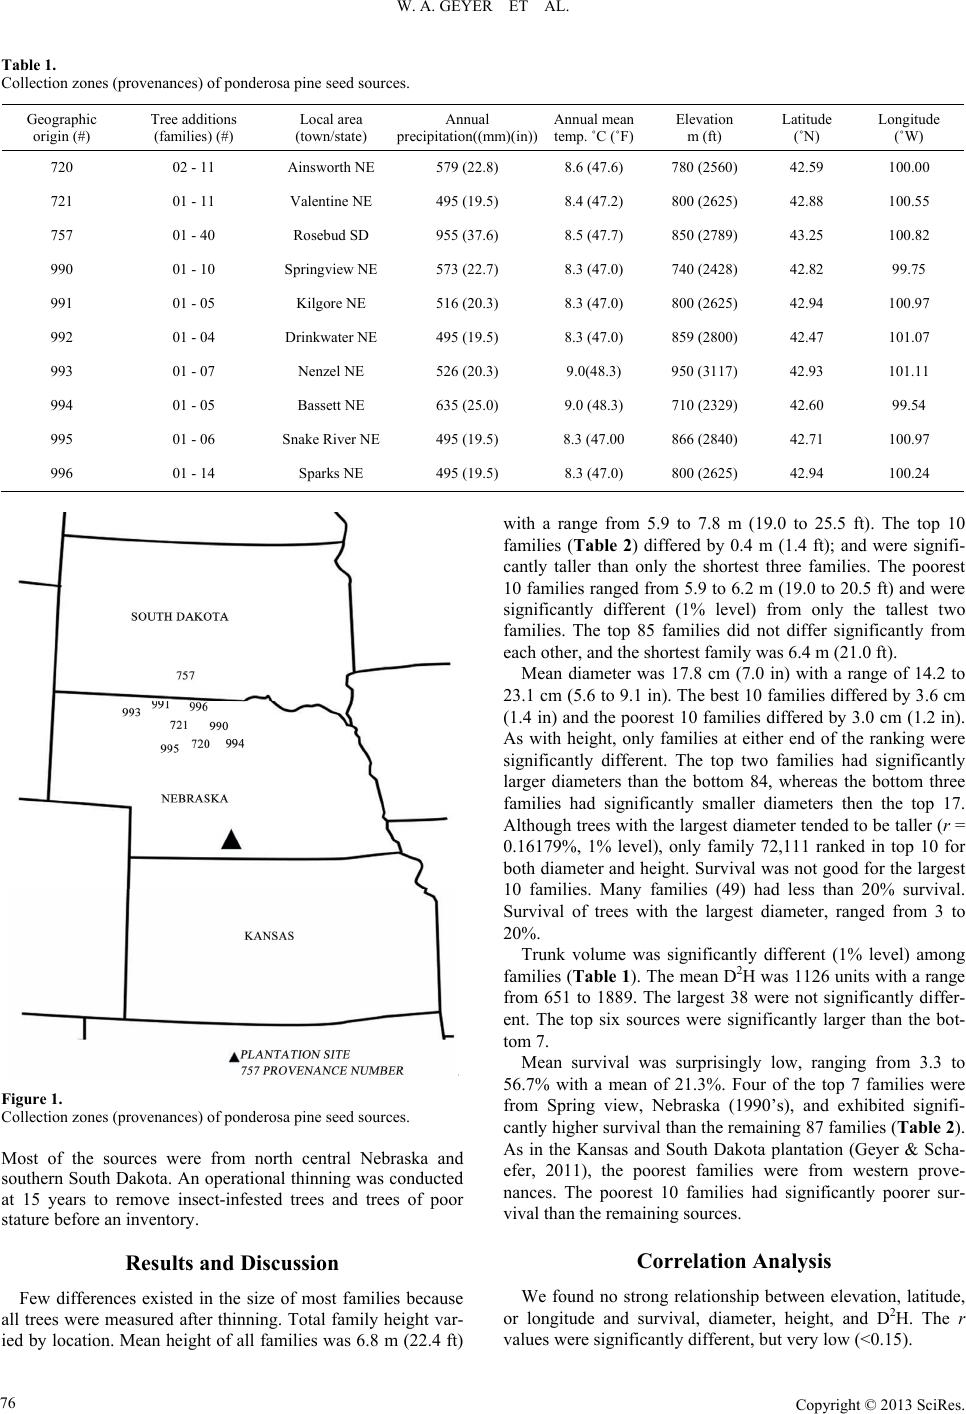 W. A. GEYER ET AL. Table 1. Collection zones (provenances) of ponderosa pine seed sources. Geographic origin (#) Tree additio ns (families) (#) Local area (town/state) Annual precipitation((mm)(in)) Annual mean temp. ˚C (˚F) Elevation m (ft) Latitude (˚N) Longitude (˚W) 720 02 - 11 Ainsworth N E 579 (22.8) 8.6 (47.6) 780 (2560) 42.59 100.00 721 01 - 11 Valentine NE 495 (19.5) 8.4 (47.2) 800 (2625) 42.88 100.55 757 01 - 40 Rosebu d SD 955 (37.6) 8.5 (47.7) 850 (2789) 43.25 100.82 990 01 - 10 Springview NE 573 (22.7) 8.3 (47.0) 740 (2428) 42.82 99.75 991 01 - 05 Kilgore NE 516 (20.3) 8.3 (47.0) 800 (2625) 42.94 100.97 992 01 - 04 Drinkwater NE 495 (19.5) 8.3 (47.0 ) 859 (2800) 42.47 101.07 993 01 - 07 Nenzel NE 526 (20.3) 9.0(48.3) 950 (3117) 42.93 101.11 994 01 - 05 Bassett NE 635 (25.0) 9.0 (48.3) 710 (2329) 42.60 99.5 4 995 01 - 06 Snake River NE 495 (19.5) 8.3 (47.00 866 (2840) 42.71 100.97 996 01 - 14 Sparks NE 495 (19.5) 8.3 (47.0) 800 (2625) 42.94 100.24 Figure 1. Collection zones (provenances) of ponderosa pine seed sources. Most of the sources were from north central Nebraska and southern South Dakota. An operational thinning was conducted at 15 years to remove insect-infested trees and trees of poor stature before an inventory. Results and Discussion Few differences existed in the size of most families because all trees were measured after thinning. Total family height var- ied by locat ion. Mean heigh t of all families was 6.8 m (22.4 ft) with a range from 5.9 to 7.8 m (19.0 to 25.5 ft). The top 10 families (Table 2) differed by 0.4 m (1.4 ft); and were signifi- cantly taller than only the shortest three families. The poorest 10 families ranged from 5.9 to 6.2 m (19.0 to 20.5 ft) and were significantly different (1% level) from only the tallest two families. The top 85 families did not differ significantly from each other, and the shortest family was 6.4 m (21.0 ft). Mean diameter was 17.8 cm (7.0 in) with a range of 14.2 to 23.1 cm (5.6 to 9.1 in). The best 10 families differed by 3.6 cm (1.4 in) and the poorest 10 families differed by 3.0 cm (1.2 in). As with height, only families at either end of the ranking were significantly different. The top two families had significantly larger diameters than the bottom 84, whereas the bottom three families had significantly smaller diameters then the top 17. Although trees with the largest diameter tended to be taller (r = 0.16179%, 1% level), only family 72,111 ranked in top 10 for both diameter and height. Survival was not good for the largest 10 families. Many families (49) had less than 20% survival. Survival of trees with the largest diameter, ranged from 3 to 20%. Trunk volume was significantly different (1% level) among families (Table 1). The mean D2H was 1126 units with a range from 651 to 1889. The largest 38 were not significantly differ- ent. The top six sources were significantly larger than the bot- tom 7. Mean survival was surprisingly low, ranging from 3.3 to 56.7% with a mean of 21.3%. Four of the top 7 families were from Spring view, Nebraska (1990’s), and exhibited signifi- cantly higher survival than the remaining 87 families (Table 2). As in the Kansas and South Dakota plantation (Geyer & Scha- efer, 2011), the poorest families were from western prove- nances. The poorest 10 families had significantly poorer sur- vival than the remaining sources. Correlation Analysis We found no strong relationship between elevation, latitude, or longitude and survival, diameter, height, and D2H. The r values were significantly different, but very low (<0.15). Copyright © 2013 SciRes. 76 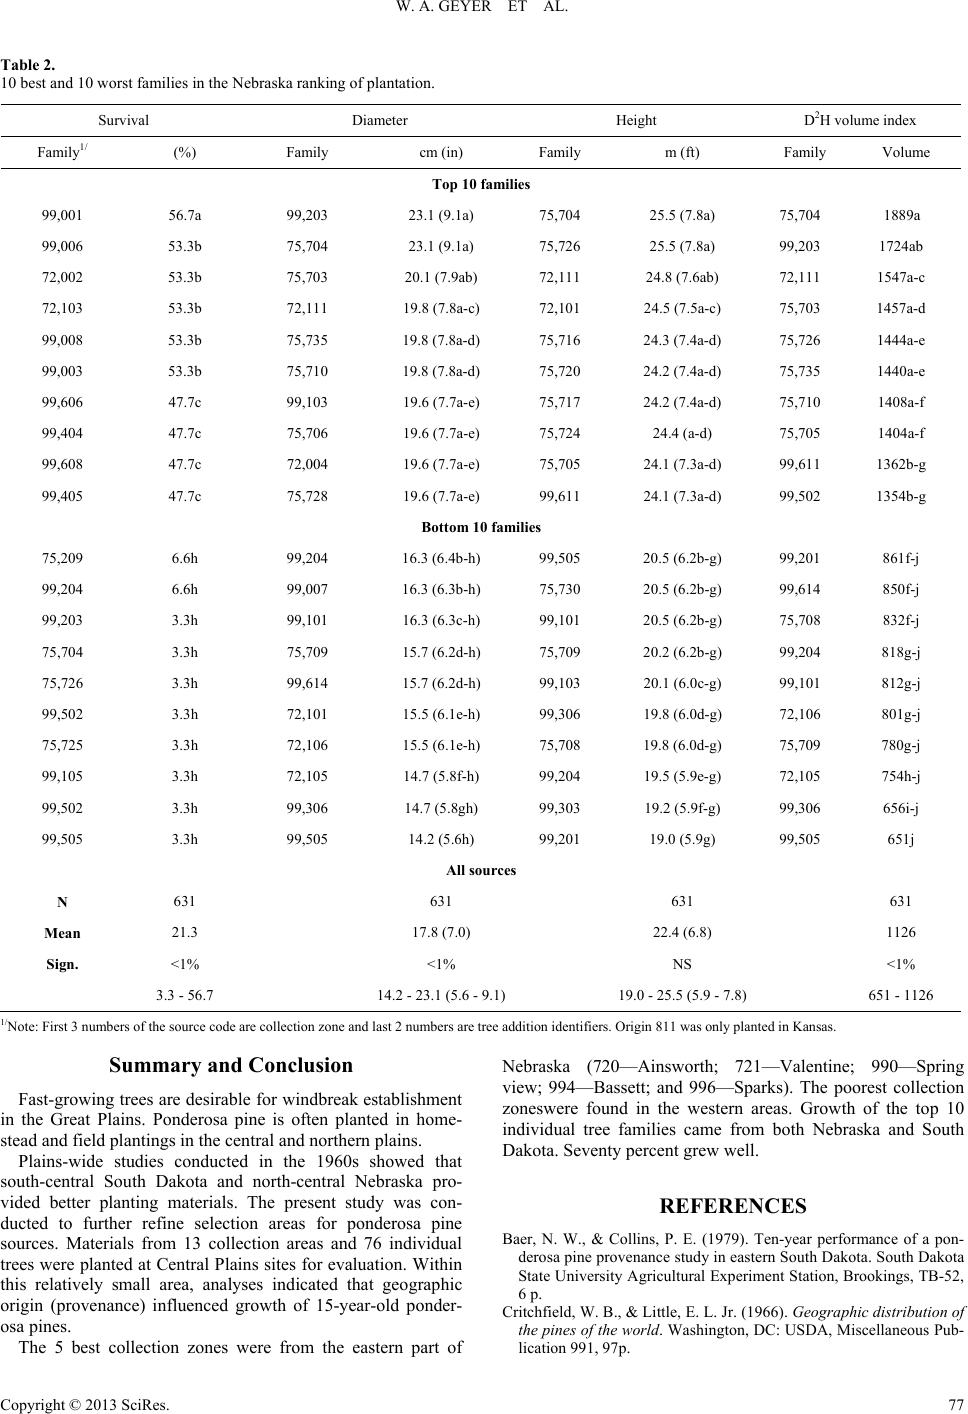 W. A. GEYER ET AL. Table 2. 10 best and 10 worst families in the Nebraska ranking of p l antation. Survival Diameter Height D2H volume index Family1/ (%) Family cm (in) Family m (ft) Family Volume Top 10 families 99,001 56.7a 99,203 23.1 (9.1a) 75,704 25.5 (7.8a) 75,704 1889a 99,006 53.3b 75,704 23.1 (9.1a) 75,726 25.5 (7.8a) 99,203 1724ab 72,002 53.3b 75,703 20.1 (7.9ab) 72,111 24.8 (7.6ab) 72,111 1547a-c 72,103 53.3b 72,111 19.8 (7.8a-c) 72,101 24.5 (7.5a-c) 75,703 1457a-d 99,008 53.3b 75,735 19.8 (7.8a-d) 75,716 24.3 (7.4a-d) 75,726 1444a-e 99,003 53.3b 75,710 19.8 (7.8a-d) 75,720 24.2 (7.4a-d) 75,735 1440a-e 99,606 47.7c 99,103 19.6 ( 7.7a-e) 75,717 24.2 (7.4a-d) 75,710 1408a-f 99,404 47.7c 75,706 19.6 ( 7.7a-e) 75,724 24.4 (a-d) 75,705 1404a-f 99,608 47.7c 72,004 19.6 ( 7.7a-e) 75,705 24.1 (7.3a-d) 99,6 11 1362b-g 99,405 47.7c 75,728 19.6 ( 7.7a-e) 99,611 24.1 (7.3a-d) 99,5 02 1354b-g Bottom 10 fa milies 75,209 6.6h 99,204 16.3 (6.4b-h) 99,505 20.5 (6.2b-g) 99,201 861f-j 99,204 6.6h 99,007 16.3 (6.3b-h) 75,730 20.5 (6.2b-g) 99,614 850f-j 99,203 3.3h 99,101 16.3 (6.3c-h) 99,101 20.5 (6.2b-g) 75,708 832f-j 75,704 3.3h 75,709 15.7 (6.2d-h) 75,709 20.2 (6.2b-g) 99,204 818g-j 75,726 3.3h 99,614 15.7 (6.2d-h) 99,103 20.1 (6.0c-g) 99,101 812g-j 99,502 3.3h 72,101 15.5 (6.1e-h) 99,306 19.8 (6.0d-g) 72,106 801g-j 75,725 3.3h 72,106 15.5 (6.1e-h) 75,708 19.8 (6.0d-g) 75,709 780g-j 99,105 3.3h 72,105 14.7 (5.8f-h) 99,204 19.5 (5.9e-g) 72,105 754h-j 99,502 3.3h 99,306 14.7 (5.8gh) 99,303 19.2 (5.9f-g) 99,306 656i-j 99,505 3.3h 99,505 14.2 (5.6h) 99,201 19.0 (5.9g) 99,505 651j All sources N 631 631 631 631 Mean 21.3 17.8 (7.0) 22.4 (6.8) 1126 Sign. <1% <1% NS <1% 3.3 - 56.7 14.2 - 23.1 (5.6 - 9.1) 19.0 - 25.5 (5.9 - 7.8) 651 - 1126 1/Note: First 3 numbers of the source code are collection zone and last 2 numbers are tree addition identifiers. Origin 811 was only planted in Kansas. Summary and Conclusion Fast-growing trees are desirable for windbreak establishment in the Great Plains. Ponderosa pine is often planted in home- stead and field plantings in the central and northern plains. Plains-wide studies conducted in the 1960s showed that south-central South Dakota and north-central Nebraska pro- vided better planting materials. The present study was con- ducted to further refine selection areas for ponderosa pine sources. Materials from 13 collection areas and 76 individual trees were planted at Central Plains sites for evaluation. Within this relatively small area, analyses indicated that geographic origin (provenance) influenced growth of 15-year-old ponder- osa pines. The 5 best collection zones were from the eastern part of Nebraska (720—Ainsworth; 721—Valentine; 990—Spring view; 994—Bassett; and 996—Sparks). The poorest collection zoneswere found in the western areas. Growth of the top 10 individual tree families came from both Nebraska and South Dakota. Seventy percent grew well. REFERENCES Baer, N. W., & Collins, P. E. (1979). Ten-year performance of a pon- derosa pine provenance study in eastern South Dakota. South Dakota State University Agricultural Experiment Station, Brookings, TB-52, 6 p. Critchfield, W. B., & Little, E. L. Jr. (1966). Geographic distribution of the pines of the world. Washington, DC: USDA, Miscellaneous Pub- lication 991, 97p. Copyright © 2013 SciRes. 77  W. A. GEYER ET AL. Flint, H. L. (1983). Landscape plants for eastern North America. John Wiley & Sons, New York, 677 p. Deneke, J. J., & Read, R. A. (1975). Early survival and growth of pon- derosa pine provenances in East-Central Kansas. USDA Forest Ser- vice Research Note RM-297, Rocky Mountain Experiment Station, Ft. Collins, 4p. Geyer, W. A. (2011). Evaluation of ponderosa pine seed sources for windbreaks in the Central Great Plains of the United States. Arbori- culture & Urban Forestry, 37, 265-26 8. Lambeth, C. (1980). Juvenile-mature correlations in Pineaceae and implications or early selection. Forest Science, 26, 571-580. Koop, R. F., Geyer, W. A., Argent, R. M., & Lynch, K. D. (1987). Evaluation of ponderosa seed sources for the eastern Great Plains. Journal Arboriculture, 13, 139-144. Read, R. (1983). Ten-year performance of ponderosa pine provenances in the Great Plains of North America. USDA Forest Service Re- search Paper,Rocky Mountain Exp eriment Station, Ft. Collins, 17p. SAS Institute Inc. (2002-2003). SAS/STAT user’s guide (Version 9.1). Cary, NC: SAS Institute Inc. Schaefer, P. R., & Baer, N. W. (1985). Ponderosa pine provenance for windbreaks in eastern South Dakota. Northern Journal of Forestry, 2, 105-107. Schaefer, P. R., & Baer, N. W. (1992). Stability of ponderosa pine provenance: results after 21 years in eastern South Dakota. Northern Journal of Forestry, 9, 102-107. Van Haverbeke, D. F. (1986). Genetic variation in ponderosa pine: A 15-year test of provenances in the Great Plains. USDA Forest Ser- vice Rocky Mountain Forest Range Experiment Station Research Paper 80526, 16 p. Copyright © 2013 SciRes. 78 |