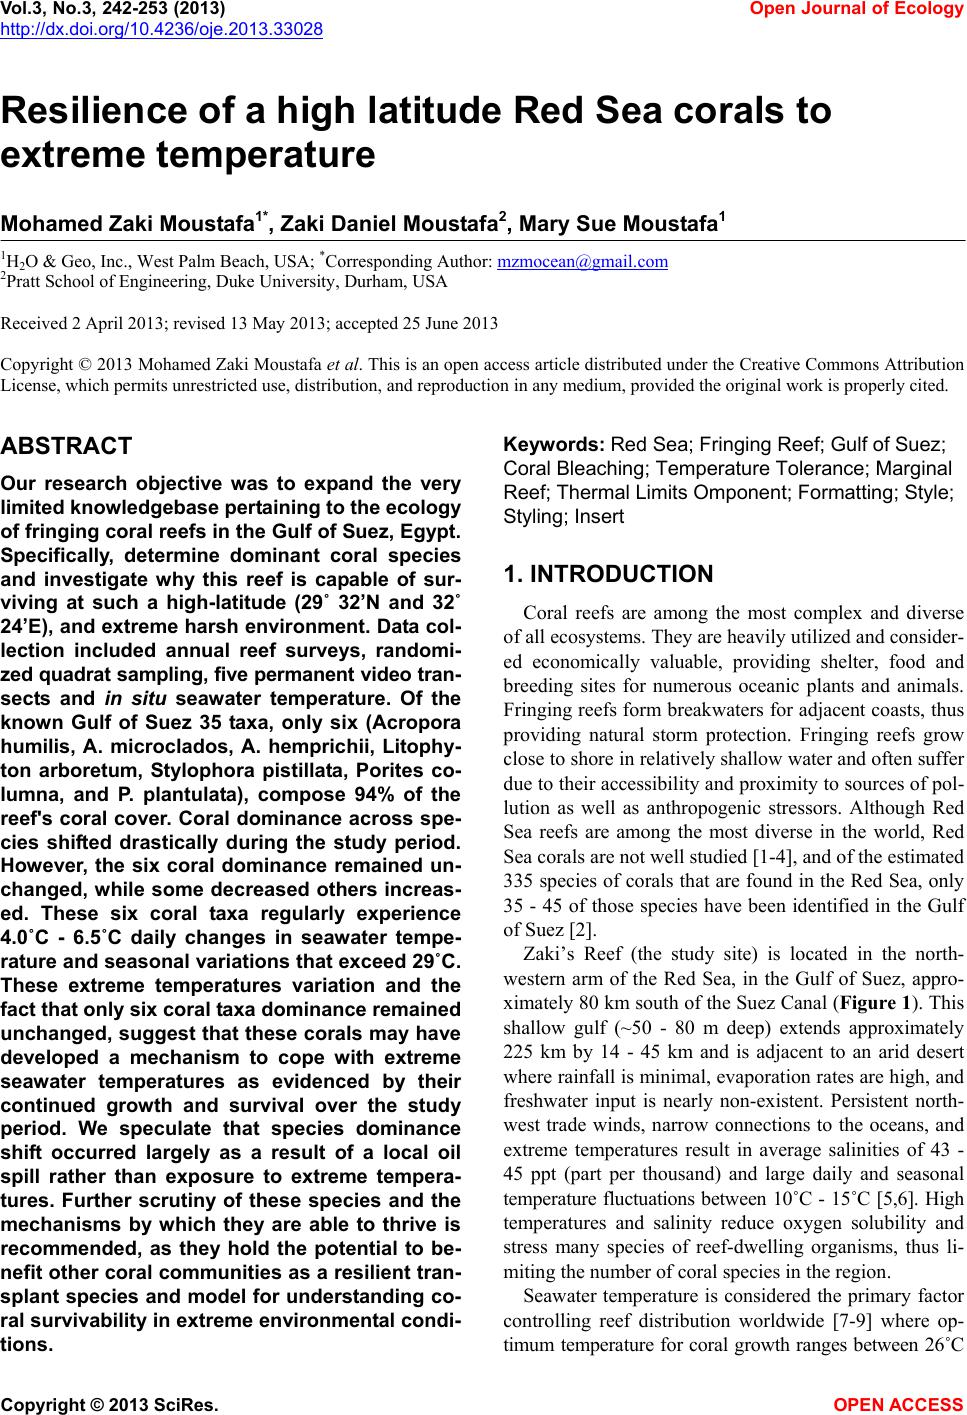
 Vol.3, No.3, 242-253 (2013) Open Journal of Ecology http://dx.doi.org/10.4236/oje.2013.33028 Resilience of a high latitude Red Sea corals to extreme temperature Mohamed Zaki Moustafa1*, Zaki Daniel Moustafa2, Mary Sue Moustafa1 1H2O & Geo, Inc., West Palm Beach, USA; *Corresponding Author: mzmocean@gmail.com 2Pratt School of Engineering, Duke University, Durham, USA Received 2 April 2013; revised 13 May 2013; accepted 25 June 2013 Copyright © 2013 Mohamed Zaki Moustafa et al. This is an open access article distributed under the Creative Commons Attribution License, which permits unrestricted use, distribution, and reproduction in any medium, provided the original work is properly cited. ABSTRACT Our research objective was to expand the very limited knowledgebase pertaining to the ecology of fringing coral reefs in the Gulf of Suez, Egypt. Specifically, determine dominant coral species and investigate why this reef is capable of sur- viving at such a high-latitude (29˚ 32’N and 32˚ 24’E), and extreme harsh environment. Data col- lection included annual reef surveys, randomi- zed quadrat sampling, five permanent video tran- sects and in situ seawater temperature. Of the known Gulf of Suez 35 taxa, only six (Acropora humilis, A. microclados, A. hemprichii, Litophy- ton arboretum, Stylophora pistillata, Porites co- lumna, and P. plantulata), compose 94% of the reef's coral cover. Coral dominance across spe- cies shifted drastically during the study period. However, the six coral dominance remained un- changed, while some decreased others increas- ed. These six coral taxa regularly experience 4.0˚C - 6.5˚C daily changes in seawater tempe- rature and seasonal variations that exceed 29˚C. These extreme temperatures variation and the fact that only six coral taxa dominance remained unchanged, suggest that these corals may have developed a mechanism to cope with extreme seawater temperatures as evidenced by their continued growth and survival over the study period. We speculate that species dominance shift occurred largely as a result of a local oil spill rather than exposure to extreme tempera- tures. Further scrutiny of these species and the mechanisms by which they are able to thrive is recommended, as they hold the potential to be- nefit other coral communities as a resilient tran- splant species and model for understanding co- ral survivability in extreme environmental condi- tions. Keywords: Red Sea; Fringing Reef; Gulf of Suez; Coral Bleaching; Temperature Tolerance; Marginal Reef; Thermal Limits Omponent; Formatting; Style; Styling; Insert 1. INTRODUCTION Coral reefs are among the most complex and diverse of all ecosystems. They are heavily utilized and consider- ed economically valuable, providing shelter, food and breeding sites for numerous oceanic plants and animals. Fringing reefs form breakwaters for adjacent coasts, thus providing natural storm protection. Fringing reefs grow close to shore in relatively shallow water and often suffer due to their accessibility and proximity to sources of pol- lution as well as anthropogenic stressors. Although Red Sea reefs are among the most diverse in the world, Red Sea corals are not well studied [1-4], and of the estimated 335 species of corals that are found in the Red Sea, only 35 - 45 of those species have been identified in the Gulf of Suez [2]. Zaki’s Reef (the study site) is located in the north- western arm of the Red Sea, in the Gulf of Suez, appro- ximately 80 km south of the Suez Canal (Figure 1). This shallow gulf (~50 - 80 m deep) extends approximately 225 km by 14 - 45 km and is adjacent to an arid desert where rainfall is minimal, evaporation rates are high, and freshwater input is nearly non-existent. Persistent north- west trade winds, narrow connections to the oceans, and extreme temperatures result in average salinities of 43 - 45 ppt (part per thousand) and large daily and seasonal temperature fluctuations between 10˚C - 15˚C [5,6]. High temperatures and salinity reduce oxygen solubility and stress many species of reef-dwelling organisms, thus li- miting the number of coral species in the region. Seawater temperature is considered the primary factor controlling reef distribution worldwide [7-9] where op- timum temperature for coral growth ranges between 26˚C Copyright © 2013 SciRes. OPEN ACCESS  M. Z. Moustafa et al. / Open Journal of Ecology 3 (2013) 242-253 Figure 1. Location of Zaki’s Reef in the Red Seas Gulf of Suez, approximate 80 km south of the highly trafficked Suez Canal. Panel a, General location of the study area. Panel b: Location of five water monitoring stations at Zaki’s reef. 27˚C [10,11]. Distribution of coral reefs has been report- ed to be aligned with a monthly minimum seawater tem- perature of 18˚C [12,13]. Cold seawater temperature also causes coral bleaching and mortality [14]. Coral bleaching commonly occurs when water temperatures get too high, but life-threaten- ing stress and bleaching also occur when water tempera- tures drop too low. While cold-temperature tolerance is not well defined for all coral species, early experiments documenting the impact of prolonged exposure to low seawater temperatures (<16˚C) found that they adversely affected coral health [14]. Exposure of corals to even lower seawater temperatures (e.g ., <14˚C for less than 9 hours) resulted in mortality [15-17]. There are no known long-term studies investigating fringing coral reefs in the Gulf of Suez prior to the re- search reported here [18,19]. Further, the existence of oceanographic and biological data for this region is ex- tremely limited. Therefore, the overarching goal for this mul ti -year study (2004-2007) was to establish a knowl- edge base for fringing coral reefs in the Gulf of Suez and provide the basic information necessary for current and future reef management, as reef-related activities gener- ate a significant portion of the country’s tourism revenue. Specific objectives of this research are: • Determine resident species and their abundance, • Determine resident coral’s vulnerability to reported worldwide bleaching events, resident coral’s thermal limits vulnerability, and compare them to other high- latitude coral reefs, and, • Discuss why this fringing coral reef is able to thrive at this northernmost limit for subtropical reefs. Annual reef surveys, which included random quadrat digital photos and fixed video transects, were used to de- termine baseline conditions (2004) including dominant coral populations and resident reef inhabitants. We ex- panded our original data collection effort to include in situ air and water temperature, mainly to investigate resi- dent biota thermal susceptibility and their tolerance to worldwide bleaching events. Data collected under this research create a knowledge base for fringing coral reefs in the Gulf of Suez and provide the basic information necessary for current and future reef management 2. MATERIAL AND METHODS 2.1. Study Site Zaki’s reef is located in the Gulf of Suez in the Red Sea off the coast of Egypt, near a town called Ain Sok- hna (29˚ 32’N and 32˚ 24’E). Zaki’s reef is an isolated fringing coral reef that extends approximately one-k ilo- meter parallel to shore and located 100 - 200 m offshore (Figure 1). Global Positioning Systems (GPS) and satel- lite image analysis were used to survey the reef and de- termine the exact reef boundaries. We discovered that what was thought to be a separate fringing reef to the south is actually part of the same reef system. The south- ern extension of this ecosystem (a very popular public beach) is completely destroyed. 2.2. Data Collection 2.2.1. Digital Photo Quadrat Annual random quadrat digital photo surveys recorded the bottom substrate from across the reef to establish spatial variation, percent coral cover and species domi- nance. Approximately 30 - 40 quadrats were taken in each of the three reef regions (Figure 1). Swim direction and distance of travel for each quadrat sample was de- termined from the roll of two die where the first roll represents a direction and the second number multiplied by a constant factor of three represents the number of kicks to be taken by the swimmer. A 0.25 m2 quadrat frame was then tossed and allowed to settle to the bottom, and the contents were subsequently photographed. Two to three digital photos were taken for each quadrat sam- ple and the highest quality one was later selected for computer analysis. Copyright © 2013 SciRes. OPEN ACCESS  M. Z. Moustafa et al. / Open Journal of Ecology 3 (2013) 242-253 2.2.2. Video Transect Survey Underwater video surveys were performed annually using methods adapted from [20], and involved filming along each of five fixed 10-meter long transects placed randomly across the reef to document coral species, coral cover, benthic invertebrates, and to capture changes over time (Figure 1). Transects were staked and their GPS positions were recorded. Before photographing, a one- meter incremented line and tape measure was strung across the transect endpoints to use as a reference while video recording. The photographer then swam slowly along the center line of a transect while video recording. The process was repeated on the swim back to the start point several times to ensure data quality at each of the five estab lished transect locations. 2.2.3. In Situ Seawater Temperat ure High frequency underwater temperature observations was measured by deploying a minimum of five in situ temperature sensors (i.e., T1, T2, T3, T4, T5 and T6) across the reef to sample every 15 minutes for two weeks in the summer of 2005 and 2006 (Table 1). In addition, a total of four temperature sensors were deployed and re- covered after 14 months between June 2006, and August, 2007, with a sampling frequency of 30 minutes. Another four temperature sensors were deployed with 30-minute sampling intervals between August 2007 and June 2008 (Table 1). All temperature sensors were deployed at each of the five permanent 10-meter transects. The temperature sensor (Optic Stow Away-TEMP(C) ONSET) has an operating range between −20˚C to 70˚C. Table 1. Temperature sensors deployment dates at Zaki’s reef. Vandalism and losses are a major issue at the study site for il- legal tropical fish catching/selling. For example, all short dura- tion sensors listed in Table 1 (i.e., T1, T2, T3, and T4) were re- deployed after the two weeks testing period. Yet, T1 and T2 were not recovered the following year. Start End T1 06/21/2006 07/05/2006 14 15 T2 06/21/2006 07/05/2006 14 15 T3 (short) 06/21/2006 07/05/2006 14 15 T4 (short) 06/21/2006 06/27/2006 5 15 T3 (long) 07/06/2006 08/09/2007 399 30 T4 (long) 070/6/2006 08/07/2007 397 30 T5 06/21/2006 08/08/2007 413 30 T6 07/06/2006 08/21/2007 411 30 2007-2008 T1 08/09/2007 06/19/2008 315 30 T2 08/09/2007 06/19/2008 315 30 T3 08/09/2007 06/21/2008 316 30 T4 08/09/2007 08/15/2007 5 15 seconds Sensor accuracy is 0.2˚C over a 0˚ to 50˚C range, with a resolution of 0.02˚C at 25˚C, and stability of 0.1˚C per year. All sensors were deployed approximately 0.25 m from the bottom in 1.5 - 2.5 m water depth. Temperature readings during deployment and retrieval days (first and last day observations) were excluded from our analysis (mainly the time it took to deploy or retrieve all sensors). We calculated and used daily seawater temperature means as the main dataset for all statistical analysis conducted in this research. We defined the cold and hot temperature season to be the period between January 1st through March 31st (92 days) and July 1st and September 30th (92 days), respec- tively. This definition is based on observed temperature values and the extent of these two periods may differ from typical summer and winter season extents elsewhere. Since cold-temperature tolerances are not well defined for corals, we decided to use both 16˚C and 18˚C as ref- erence points in our analyses and for comparisons with extreme temperatures reported for high-latitude subtro- pical coral reef sites. 2.3. Data Analysis and Presentation A combination of descriptive statistics together with graphical techniques [21,22] was employed to reveal da- ta characteristics and describe relationships among vari- ables. Statistics were calculated with JMP (John’s Mac- intosh Project’s a computer program for statistics devel- oped by the JMP business unit of SAS Institute Version 7, SAS Institute Inc., Cary, NC), or SigmaPlot (Version 11.0, SPSS, Inc. Chicago, IL). The level of significance (α) was set at 0.05 for all analyses. In addition, multiple techniques were used to scrutinize the data for bi-variate and multivariate relationships. Correlations (JMP; Pear- son product-moments coefficients) quantified the strength of association between pairs of variables. Seawater tem- perature probability plots were constructed following [23, 24]. 2.3.1. Quadrat/Transect Analysis Each year, statistics for percent bottom coverage by coral taxa were derived from the analysis of approxi- mately 120 random quadrat digital images. Coral Point Count (CPCe) software [25] was employed to determine coverage area for each species. Coverage analysis cate- gories included bottom/sand, long and short-spine sea ur- chins, as well as various other sessile organisms. A Red Sea comprehensive guidebook (Myers & Lieske 2004) was used to identify coral taxa and reef inhabitants. The sharpest digital images were extracted from all transect and quadrat survey data to identify coral taxa and calculate percent benthic coverage. Coral Point Count was used to evaluate coral coverage along each 10-m transect by analyzing 25 consecutive frames representing Copyright © 2013 SciRes. OPEN ACCESS  M. Z. Moustafa et al. / Open Journal of Ecology 3 (2013) 242-253 a strip approximately 0.5 m × 2 m wide area. Percent coral cover was calculated by identifying the bottom type at 60 randomly generated points projected onto each frame as analysis showed that data from 60 points were statis- tically identical to identifying the total coverage area from each photo. For each quadrat photo the total surface area (in cm2) covered by each coral taxa was determined using CPCe software. 3. RESULTS 3.1. Coral Diversity and Dominance 3.1.1. Quadrat Survey (Photo) A total of 35 - 40 coral taxa were identified in the Gulf of Suez [2]. Only six of these 35 taxa make up 94% of the coral cover on Zaki’s Reef including Acropora humi- lis, A. microclados, A. hemprichii, Litophyton arboretum, Stylophora pistillata, Porites columna, and P. plantulata, approximately 80% hard corals and 20% soft corals (Ta- ble 2). Dominant hard corals included Staghorn (Acro- pora), Neptheidae (Litophyton), as well as Finger (Sty- lophra) and Anemone (Porites) corals. On average, 24% of the coral (primarily Acropora) was dead in 2004. This value increased significantly to 35% dead by 2007 (Ta- ble 2). The percentage of dead coral varied over time, and the dominant bottom-coverage types have shifted de- pending on location on the reef. In general, spatial pat- terns of coral coverage and health indicate that the off- shore regions of the reef where the water is deepest are healthiest. Based on quadrat survey results, staghorn was the do- minant species (25%) at the outset of this research and continued to grow to more than 35% in 2005 (Figure 2). However, both staghorn (down to 14% from 35%) and crystal coral (down to <0.3% from 7%) declined drama- tically between 2005 and 2006. Yet there was no ob- served change in the percentage of dead coral that year, suggesting that the loss of staghorn and crystal corals was compensated for by the growth of other species (Fig- ure 2). 3.1.2. Transect Survey (Video) At all five transects Faviidae, anemone, finger, Nepth- eidae, and staghorn were the dominant species (Table 3). When the 2007 coral coverage was compared to previous years, a net loss in coral was observed at Transects 2 and 4 while overall growth was observed at the other three transects (Table 3). The Kruskal-Wallis statistical test for population equality [26] validated the null hypothesis of no significant differences (α ≤ 0.05) in coral coverage at all transects. Therefore, despite noted differences in species coverage between years (Table 3), differences remained statistically insignificant (α = 0.05); as some Figure 2. Percent change in coral coverage over the four years based on the random 0.25 m squared quadrat survey of the reef conducted each year. Note the increase in dead corals by 2007. Values are reported to the nearest whole number. Table 2. Dominant coral species at the study site for all surveyed years (2004-2007), and percent change in coral coverage at each of the five permanent transects monitored since 2004; baseline observation year. Year/Species Staghorn Coral (Acropora) Finger Coral (Stylophra) Crystal Coral (Galaxea fascicularis) Nephtheidae (Litophyton) Anemone Coral (Porites) Faviidae (Favia lacuna) Dead Coral 2004 25.19 14.07 2.7 17.38 11.6 3.24 23.44 2005 35.33 15.02 6.58 12.68 5.91 1.74 16.46 2006 14.13 19.3 0.26 15.52 17.11 13.77 16.61 2007 14.25 16.14 9.94 8.58 12.87 3.23 34.74 Mean 22.23 16.13 4.87 13.54 11.87 5.50 22.81 Standard Error 5.08 1.14 2.13 1.92 2.31 2.78 4.30 % change since 2004-2005 40.25 6.75 143.70 −27.04 −49.05 −46.30 −29.78 % change since 2004-2006 −43.91 37.17 −90.37 −10.70 47.50 325.00 −29.14 % change since 2004-2007 −43.43 14.71 268.15 −50.63 10.95 −0.31 48.21 Copyright © 2013 SciRes. OPEN ACCESS 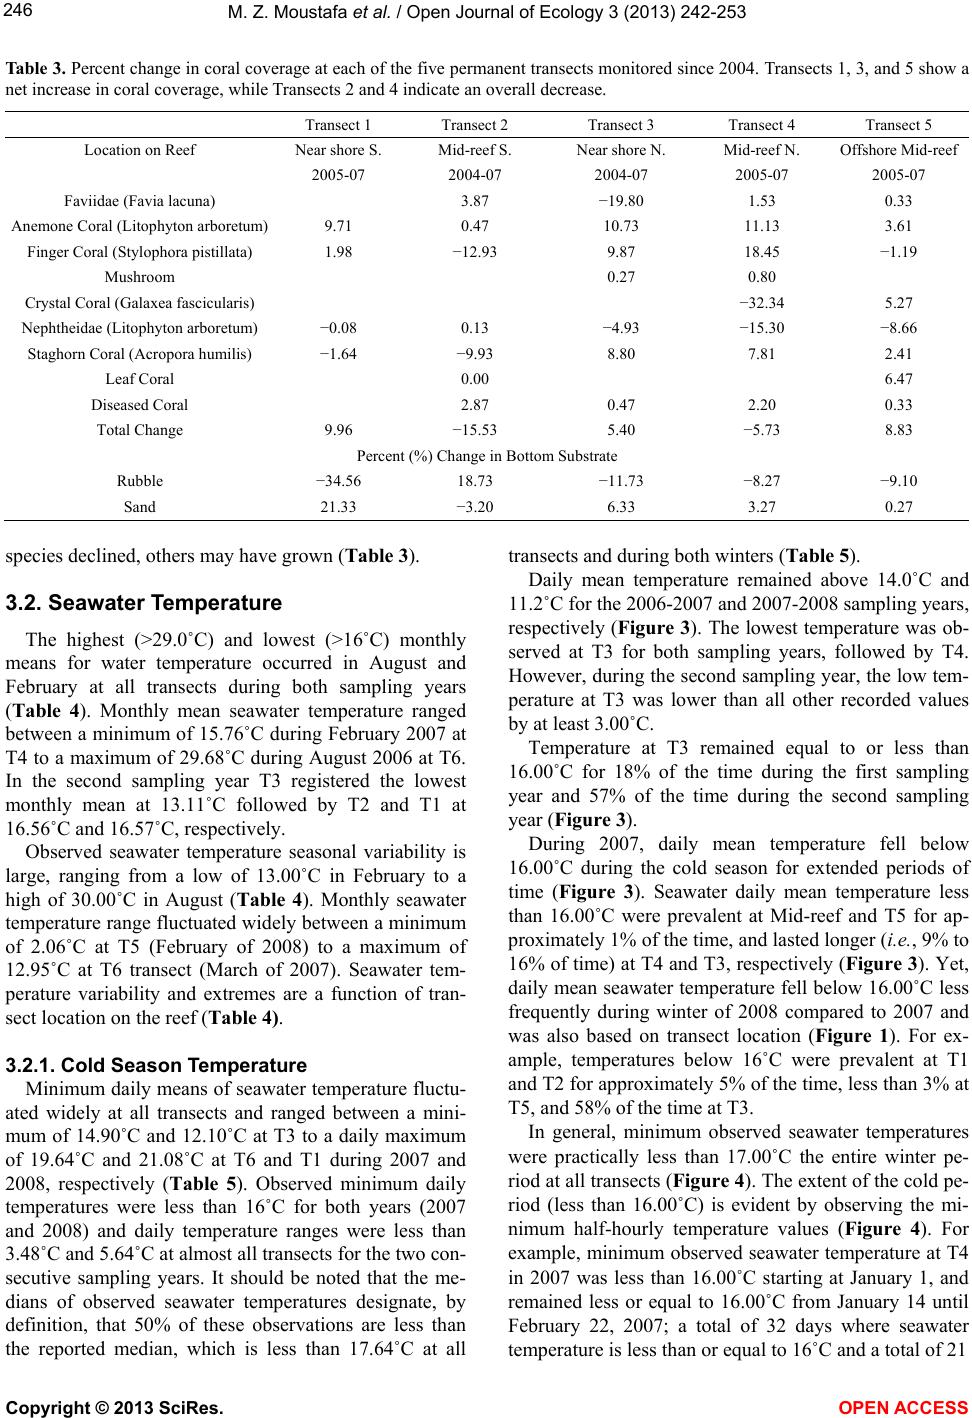 M. Z. Moustafa et al. / Open Journal of Ecology 3 (2013) 242-253 Table 3. Percent change in coral coverage at each of the five permanent transects monitored since 2004. Transects 1, 3, and 5 show a net increase in coral coverage, while Transects 2 and 4 indicate an overall decrease. Location on Reef Near shore S. Mid-reef S. Near shore N. Mid-reef N. Offshore Mid-reef 2005-07 2004-07 2004-07 2005-07 2005-07 Faviidae (Favia lacuna) 3.87 −19.80 1.53 0.33 Anemone Coral (Litophyton arboretu m) 9.71 0.47 10.73 11.13 3.61 Finger Coral (Stylophora pistillata) 1.98 −12.93 9.87 18.45 −1.19 Mushroom 0.27 0.80 Crystal Coral (Galaxea fascicularis) −32.34 5.27 Nephtheidae (Litophyton arboretum) −0.08 0.13 −4.93 −15.30 −8.66 Staghorn Coral (Acropora humilis) −1.64 −9.93 8.80 7.81 2.41 Leaf Coral 0.00 6.47 Diseased Coral 2.87 0.47 2.20 0.33 Total Change 9.96 −15.53 5.40 −5.73 8.83 Percent (%) Change in Bottom Substrate Rubble −34.56 18.73 −11.73 −8.27 −9.10 Sand 21.33 −3.20 6.33 3.27 0.27 species declined, others may have grown (Table 3). 3.2. Seawater Temperature The highest (>29.0˚C) and lowest (>16˚C) monthly means for water temperature occurred in August and February at all transects during both sampling years (Table 4). Monthly mean seawater temperature ranged between a minimum of 15.76˚C during February 2007 at T4 to a maximum of 29.68˚C during August 2006 at T6. In the second sampling year T3 registered the lowest monthly mean at 13.11˚C followed by T2 and T1 at 16.56˚C and 16.57˚C, respectively. Observed seawater temperature seasonal variability is large, ranging from a low of 13.00˚C in February to a high of 30.00˚C in August (Table 4). Monthly seawater temperature range fluctuated widely between a minimum of 2.06˚C at T5 (February of 2008) to a maximum of 12.95˚C at T6 transect (March of 2007). Seawater tem- perature variability and extremes are a function of tran- sect location on the reef (Table 4). 3.2.1. Cold Season Tempe rat ure Minimum daily means of seawater temperature fluctu- ated widely at all transects and ranged between a mini- mum of 14.90˚C and 12.10˚C at T3 to a daily maximum of 19.64˚C and 21.08˚C at T6 and T1 during 2007 and 2008, respectively (Table 5). Observed minimum daily temperatures were less than 16˚C for both years (2007 and 2008) and daily temperature ranges were less than 3.48˚C and 5.64˚C at almost all transects for the two con- secutive sampling years. It should be noted that the me- dians of observed seawater temperatures designate, by definition, that 50% of these observations are less than the reported median, which is less than 17.64˚C at all transects and during both winters (Table 5). Daily mean temperature remained above 14.0˚C and 11.2˚C for the 2006-2007 and 2007-2008 sampling years, respectively (Figure 3). The lowest temperature was ob- served at T3 for both sampling years, followed by T4. However, during the second sampling year, the low tem- perature at T3 was lower than all other recorded values by at least 3.00˚C. Temperature at T3 remained equal to or less than 16.00˚C for 18% of the time during the first sampling year and 57% of the time during the second sampling year (Figure 3). During 2007, daily mean temperature fell below 16.00˚C during the cold season for extended periods of time (Figure 3). Seawater daily mean temperature less than 16.00˚C were prevalent at Mid-reef and T5 for ap- proximately 1% of the time, and lasted longer (i.e., 9% to 16% of time) at T4 and T3, respectively (Figure 3). Yet, daily mean seawater temperature fell below 16.00˚C less frequently during winter of 2008 compared to 2007 and was also based on transect location (Figure 1). For ex- ample, temperatures below 16˚C were prevalent at T1 and T2 for approximately 5% of the time, less than 3% at T5, and 58% of the time at T3. In general, minimum observed seawater temperatures were practically less than 17.00˚C the entire winter pe- riod at all transects (Figure 4). The extent of the cold pe- riod (less than 16.00˚C) is evident by observing the mi- nimum half-hourly temperature values (Figure 4). For example, minimum observed seawater temperature at T4 in 2007 was less than 16.00˚C starting at January 1, and remained less or equal to 16.00˚C from January 14 until February 22, 2007; a total of 32 days where seawater temperature is less than or equal to 16˚C and a total of 21 Copyright © 2013 SciRes. OPEN ACCESS  M. Z. Moustafa et al. / Open Journal of Ecology 3 (2013) 242-253 Table 4. Summary statistics of monthly seawater temperature collected between June 2006 and August 2007 at T3, T4, T5, and T6 temperature sensors, and summary statistics of monthly seawater temperature collected between August 2007 and June 2008 at T1, T2, T3 & T5 temperature sensors. Month/Year T3 T4 6/15/2006 27.65 25.33 29.68 4.35 8/15/2006 29.54 27.31 32.15 4.84 29.38 27.76 31.54 3.78 9/15/2006 27.95 25.99 31.08 5.09 27.49 25.14 30.49 5.35 12/15/2006 19.24 16.12 22.15 6.03 18.98 16.27 21.37 5.10 1/15/2007 16.87 15.24 18.49 3.25 16.31 14.81 18.04 3.23 4/15/2007 18.99 16.71 22.47 5.76 18.58 16.86 21.06 4.20 5/15/2007 21.67 18.49 25.01 6.52 21.43 18.34 23.87 5.53 8/15/2007 26.20 24.69 29.33 4.64 26.50 25.47 27.76 2.29 Mean Min imum Maximu m Range Mean Mi nimum Maximum Range 7/15/2006 28.05 25.99 29.67 3.68 28.52 25.44 31.93 6.49 8/15/2006 29.16 27.31 31.07 3.76 29.68 27.42 32.66 5.24 11/15/2006 23.09 20.62 25.34 4.72 22.89 20.41 25.44 5.03 12/15/2006 20.07 17.33 22.17 4.84 19.83 16.51 22.57 6.06 3/15/2007 18.38 16.74 20.32 3.58 18.49 9.82 21.33 11.51 4/15/2007 20.02 18.52 22.79 4.27 20.34 18.29 24.48 6.19 7/15/2007 28.43 26.65 31.07 4.42 29.05 26.10 33.02 6.92 8/15/2007 29.36 28.31 30.72 2.41 29.60 27.76 33.39 5.63 08/15/2007 29.62 27.56 31.71 4.15 29.50 27.72 31.17 3.45 09/15/2007 28.05 24.62 32.07 7.45 28.03 24.44 31.53 7.09 10/15/2007 26.13 23.98 28.91 4.93 26.13 24.12 28.39 4.27 11/15/2007 23.58 21.16 26.90 5.74 23.68 20.67 26.39 5.72 12/15/2007 20.47 18.13 23.03 4.90 20.64 18.26 22.86 4.60 01/15/2008 17.64 14.60 19.93 5.33 17.73 14.71 20.06 5.35 02/15/2008 16.57 14.31 18.43 4.12 16.56 14.41 18.26 3.85 03/15/2008 19.12 16.35 22.40 6.05 19.09 16.47 22.22 5.75 04/15/2008 21.46 17.84 24.94 7.10 21.52 17.96 24.77 6.81 05/15/2008 23.75 20.54 28.23 7.69 23.75 20.67 27.38 6.71 06/15/2008 26.29 23.98 28.57 4.59 26.34 24.12 28.06 3.94 Copyright © 2013 SciRes. OPEN ACCESS  M. Z. Moustafa et al. / Open Journal of Ecology 3 (2013) 242-253 Continued 09/15/2007 24.63 21.53 28.99 7.46 27.97 25.59 30.65 5.06 12/15/2007 17.04 14.94 19.39 4.45 20.70 19.03 22.40 3.37 01/15/2008 14.20 11.47 16.42 4.95 17.80 15.18 19.63 4.45 04/15/2008 17.81 14.36 21.22 6.86 21.12 18.43 24.62 6.19 05/15/2008 20.00 17.01 24.37 7.36 23.33 20.85 26.24 5.39 Table 5. Summary statistics of daily seawater temperature collected during winter season (January 1, through end of March) for 2007 and 2008 sampling years. January-March (2007) T3 T4 T6 T5 Standard Error 0.07 0.08 0.08 0.08 Median 16.32 16.95 17.64 16.95 Max imum 18.00 18.54 19.64 18.54 Count 90 90 90 90 Standard Error 0.14 0.14 0.13 0.13 Median 17.46 17.43 13.99 17.61 Max imum 21.08 21.08 17.61 20.46 Count 91 91 91 91 days less than or equal to 15.00˚C (Figure 3). The long- est cold period (temperature < 16.00˚C) was observed at T3 and lasted from January 1, 2008 through March 24, 2008 (Figure 3). 3.2.2. Hot/Summer Season Tempera ture Frequency of coral bleaching temperatures at the study site occurred almost every year. In situ max imum daily seawater temperatures at the study site were above the coral bleaching temperature of 28.00˚C during all four summers: 2005 (world-wide bleaching event), 2006, 2007, and 2008 (Figure 5). For the most part, observed seawater temperature remained above 28.00˚C and reached as high as 32.00˚C for the two week deployment time during the summer of 2005; a total of six continu- ous days of temperatures exceeding 30.00˚C (Figure 5). During the summer of 2006, which was not reported as a world-wide bleaching event, the maximum temperature remained above 28.00˚C from June 26th through Sep- tember 5th at all transects (Figure 5). At T6 (mid-region) on September 12th, 2006, in situ seawater temperature reached 34.90˚C and remained above 30.00˚C between September 12 and September 17, 2006 (Figure 5). This location is more prone to extreme low tide episodes, where corals are directly exposed to prevailing air tempe- ratures (Figure 6). Similarly and during the summer of 2007, maximum temperatures remained far above previ- ously reported lethal temperature coral limits (>28.00˚C) for an extended period of time, reaching as high as 33˚C almost every two weeks, synchronized with extreme low tide episodes (Figure 5). 4. DISCUSSION 4.1. Resident Coral Vulnerability and Thermal Limits Water temperatures and elevated salinity are vitally important environmental stressors to consider when eva- luating coral health, made even more so by the fact that it has been shown that excessive warming can en- Copyright © 2013 SciRes. OPEN ACCESS 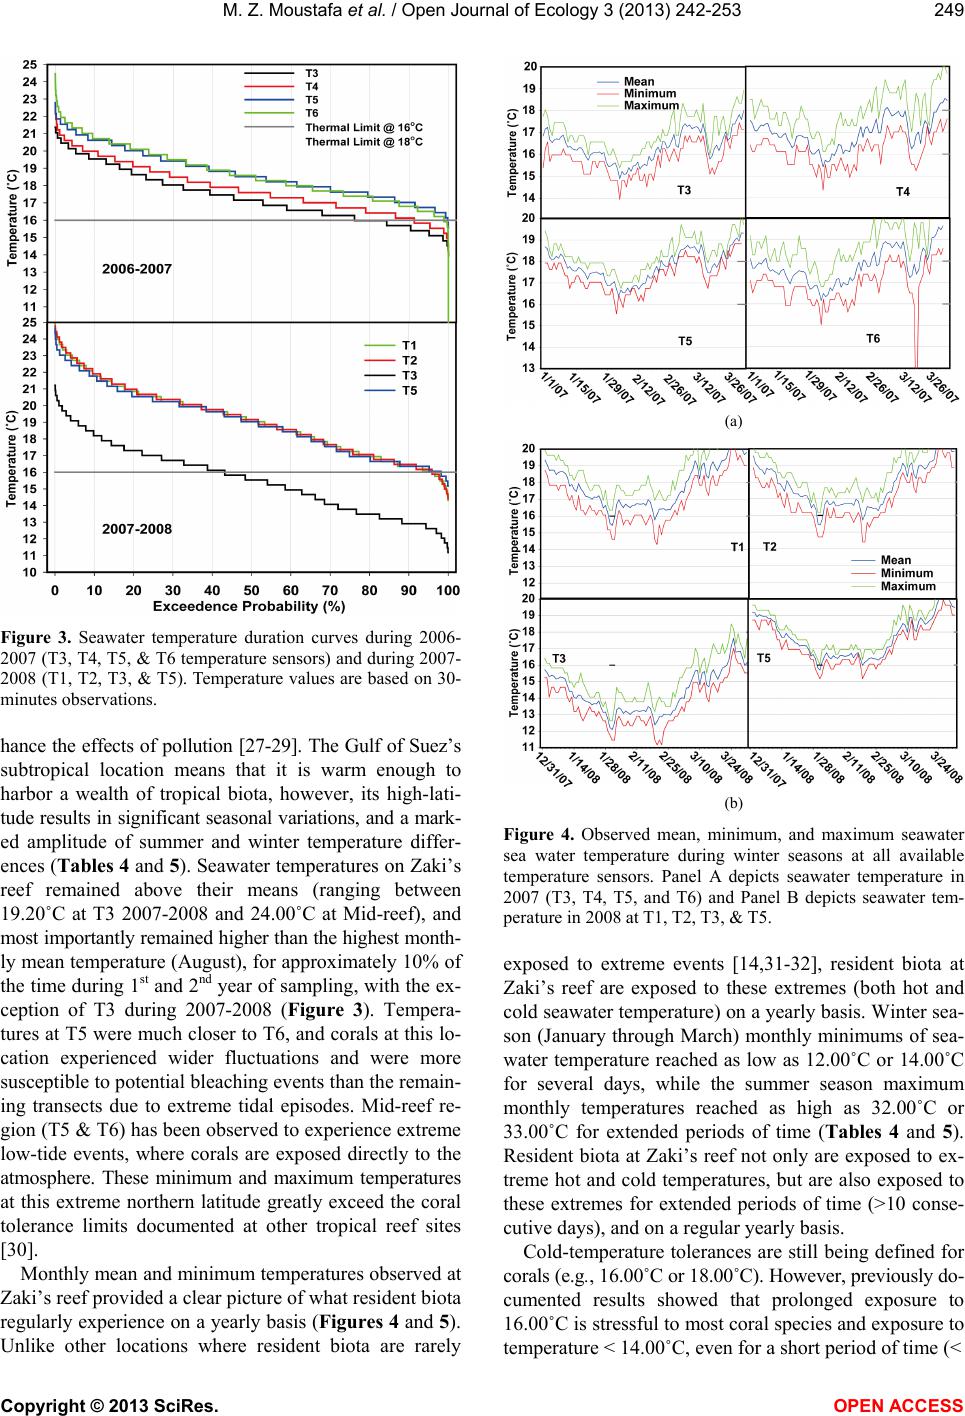 M. Z. Moustafa et al. / Open Journal of Ecology 3 (2013) 242-253 Figure 3. Seawater temperature duration curves during 2006- 2007 (T3, T4, T5, & T6 temperature sensors) and during 2007- 2008 (T1, T2, T3, & T5). Temperature values are based on 30- minutes observations. hance the effects of pollution [27-29]. The Gulf of Suez’s subtropical location means that it is warm enough to harbor a wealth of tropical biota, however, its high-lati- tude results in significant seasonal variations, and a mark- ed amplitude of summer and winter temperature differ- ences (Tables 4 and 5). Seawater temperatures on Zaki’s reef remained above their means (ranging between 19.20˚C at T3 2007-2008 and 24.00˚C at Mid-reef), and most importantly remained higher than the highest month- ly mean temperature (August), for approximately 10% of the time during 1st and 2nd year of sampling, with the ex- ception of T3 during 2007-2008 (Figure 3). Tempera- tures at T5 were much closer to T6, and corals at this lo- cation experienced wider fluctuations and were more susceptible to potential bleaching events than the remain - ing transects due to extreme tidal episodes. Mid-reef re- gion (T5 & T6) has been observed to experience extreme low-tide events, where corals are exposed directly to the atmosphere. These minimum and maximum temperatures at this extreme northern latitude greatly exceed the coral tolerance limits documented at other tropical reef sites [30]. Monthly mean and minimum temperatures observed at Zaki’s reef provided a clear picture of what resident biota regularly experience on a yearly basis (Figures 4 and 5). Unlike other locations where resident biota are rarely (a) (b) Figure 4. Observed mean, minimum, and maximum seawater sea water temperature during winter seasons at all available temperature sensors. Panel A depicts seawater temperature in 2007 (T3, T4, T5, and T6) and Panel B depicts seawater tem- perature in 2008 at T1, T2, T3, & T5. exposed to extreme events [14,31-32], resident biota at Zaki’s reef are exposed to these extremes (both hot and cold seawater temperature) on a yearly basis. Winter sea- son (January through March) monthly minimums of sea- water temperature reached as low as 12.00˚C or 14.00˚C for several days, while the summer season maximum monthly temperatures reached as high as 32.00˚C or 33.00˚C for extended periods of time (Tables 4 and 5). Resident biota at Zaki’s reef not only are exposed to ex- treme hot and cold temperatures, but are also exposed to these extremes for extended periods of time (>10 conse- cutive days), and on a regular yearly basis. Cold-temperature tolerances are still being defined for corals (e.g., 16.00˚C or 18.00˚C). However, previously do- cumented results showed that prolonged exposure to 16.00˚C is stressful to most coral species and exposure to temperature < 14.00˚C, even for a short period of time (< Copyright © 2013 SciRes. OPEN ACCESS 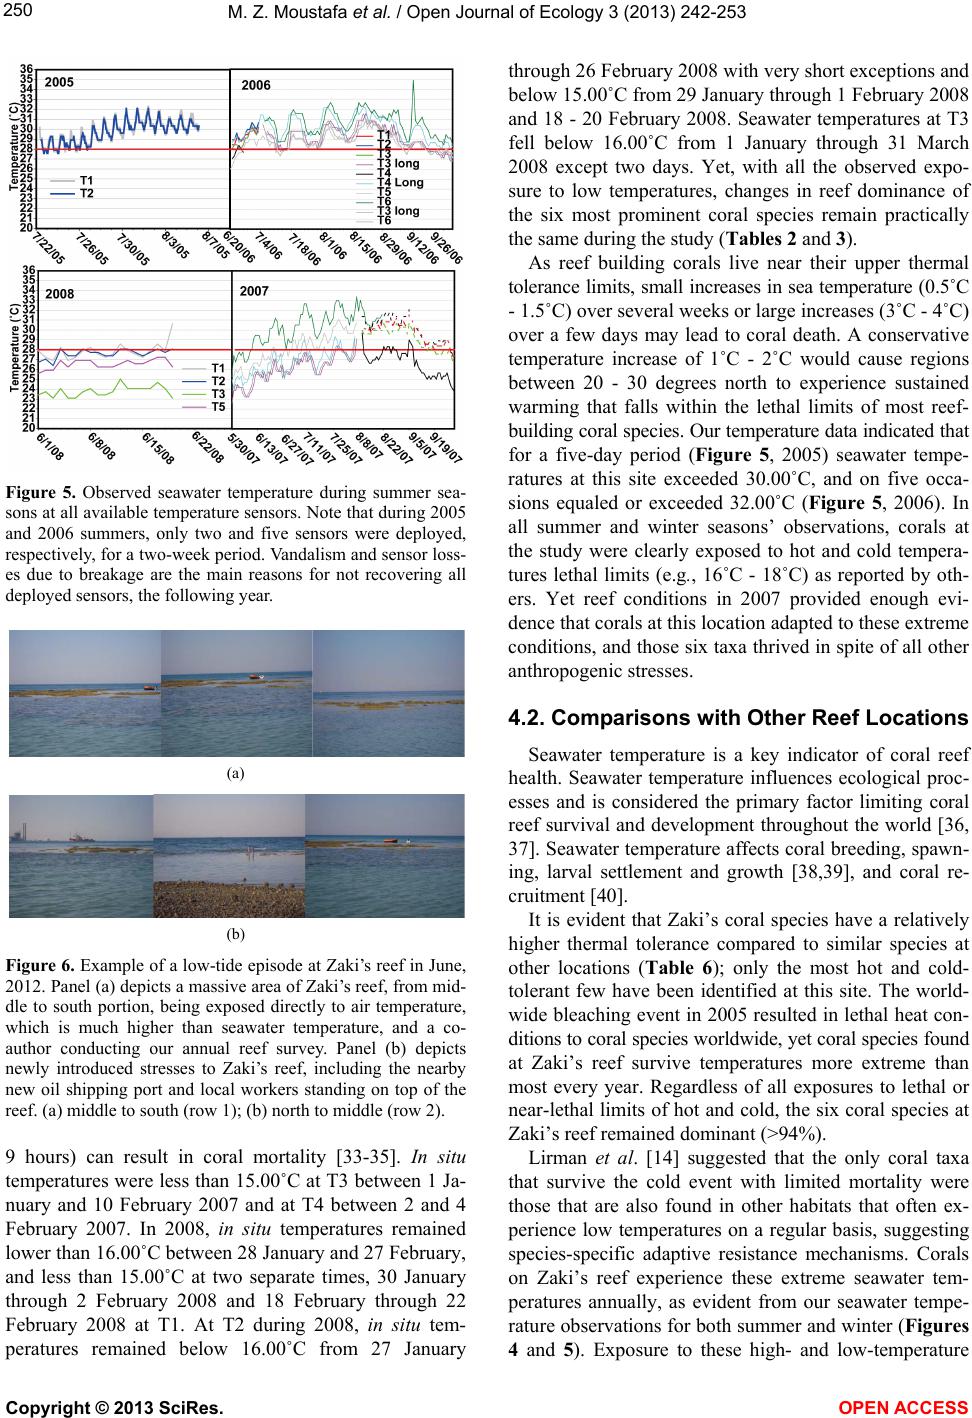 M. Z. Moustafa et al. / Open Journal of Ecology 3 (2013) 242-253 Figure 5. Observed seawater temperature during summer sea- sons at all available temperature sensors. Note that during 2005 and 2006 summers, only two and five sensors were deployed, respectively, for a two-week period. Vandalism and sensor loss- es due to breakage are the main reasons for not recovering all deployed sensors, the following year. (a) (b) Figure 6. Example of a low-tide episode at Zaki’s reef in June, 2012. Panel (a) depicts a massive area of Zaki’s reef, from mid- dle to south portion, being exposed directly to air temperature, which is much higher than seawater temperature, and a co- author conducting our annual reef survey. Panel (b) depicts newly introduced stresses to Zaki’s reef, including the nearby new oil shipping port and local workers standing on top of the reef. (a) middle to south (row 1); (b) north to middle (row 2). 9 hours) can result in coral mortality [33-35]. In situ temp e r atures were less than 15.00˚C at T3 between 1 Ja- nuary and 10 February 2007 and at T4 between 2 and 4 February 2007. In 2008, in situ temperatures remained lower than 16.00˚C between 28 January and 27 February, and less than 15.00˚C at two separate times, 30 January through 2 February 2008 and 18 February through 22 February 2008 at T1. At T2 during 2008, in situ tem- peratures remained below 16.00˚C from 27 January through 26 February 2008 with very short exceptions and below 15.00˚C from 29 January through 1 February 2008 and 18 - 20 February 2008. Seawater temperatures at T3 fell below 16.00˚C from 1 January through 31 March 2008 except two days. Yet, with all the observed expo- sure to low temperatures, changes in reef dominance of the six most prominent coral species remain practically the same during the study (Tables 2 and 3). As reef building corals live near their upper thermal tolerance limits, small increases in sea temperature (0.5˚C - 1.5˚C) over several weeks or large increases (3˚C - 4˚C) over a few days may lead to coral death. A conservative temperature increase of 1˚C - 2˚C would cause regions between 20 - 30 degrees north to experience sustained warming that falls within the lethal limits of most reef- building coral species. Our temperature data indicated that for a five-day period (Figure 5, 2005) seawater tempe- ratures at this site exceeded 30.00˚C, and on five occa- sions equaled or exceeded 32.00˚C (Figure 5, 2006). In all summer and winter seasons’ observations, corals at the study were clearly exposed to hot and cold tempera- tures lethal limits (e.g., 16˚C - 18˚C) as reported by oth- ers. Yet reef conditions in 2007 provided enough evi- dence that corals at this location adapted to these extreme conditions, and those six taxa thrived in spite of all other anthropogenic stresses. 4.2. Comparisons with Other Reef Locations Seawater temperature is a key indicator of coral reef health. Seawater temperature influences ecological proc- esses and is considered the primary factor limiting coral reef survival and development throughout the world [36, 37]. Seawater temperature affects coral breeding, spawn- ing, larval settlement and growth [38,39], and coral re- cruitment [40]. It is evident that Zaki’s coral species have a relatively higher thermal tolerance compared to similar species at other locations (Table 6); only the most hot and cold- tolerant few have been identified at this site. The world- wide bleaching event in 2005 resulted in lethal heat con- ditions to coral species worldwide, yet coral species found at Zaki’s reef survive temperatures more extreme than most every year. Regardless of all exposures to lethal or near-lethal limits of hot and cold, the six coral species at Zaki’s reef remained dominant (>94 %). Lirman et al. [14] suggested that the only coral taxa that survive the cold event with limited mortality were those that are also found in other habitats that often ex- perience low temperatures on a regular basis, suggesting species-specific adaptive resistance mechanisms. Corals on Zaki’s reef experience these extreme seawater tem- peratures annually, as evident from our seawater tempe- rature observations for both summer and winter (Figures 4 and 5). Exposure to these high- and low-temperature Copyright © 2013 SciRes. OPEN ACCESS 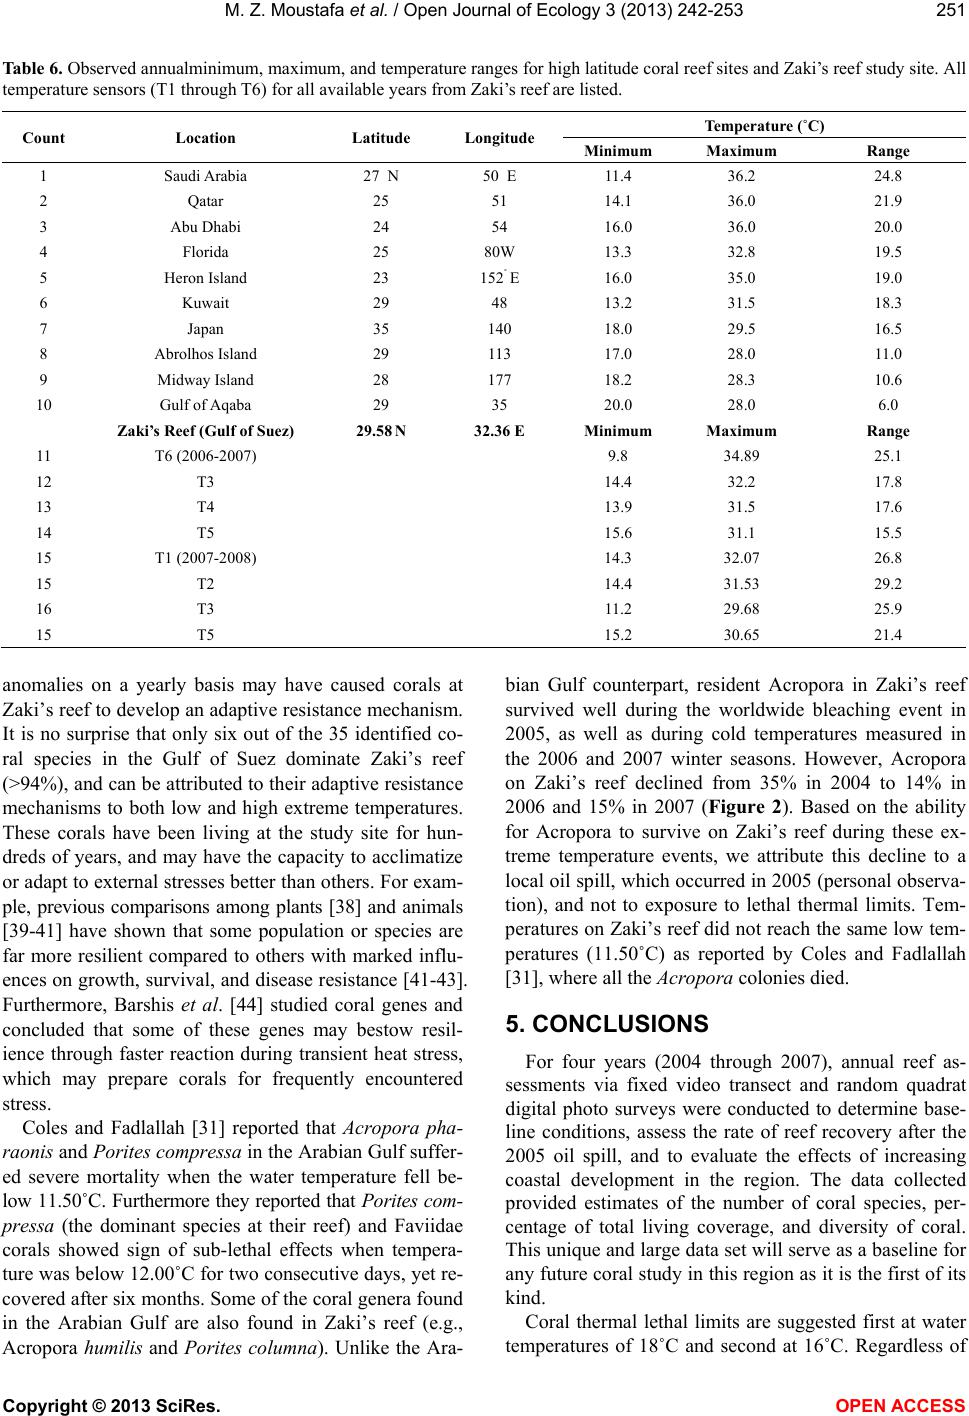 M. Z. Moustafa et al. / Open Journal of Ecology 3 (2013) 242-253 Table 6. Observed annualminimum, maximum, and temperature ranges for high latitude coral reef sites and Zaki’s reef study site. All temperature sensors (T1 through T6) for all available years from Zaki’s reef are listed. Count Location Latitude Longitude Minimum Maximum Range 2 Qatar 25 51 14.1 36.0 21.9 3 Abu Dhabi 24 54 16.0 36.0 20.0 5 Heron Island 23 152˚ E 16.0 35.0 19.0 6 Kuwait 29 48 13.2 31.5 18.3 7 Japan 35 140 18.0 29.5 16.5 10 Gulf of Aqaba 29 35 20.0 28.0 6.0 Zaki’s Reef (Gulf of Suez) 29.58 N 32.36 E Minimum Maximum Range 13 T4 13.9 31.5 17.6 14 T5 15.6 31.1 15.5 15 T2 14.4 31.53 29.2 16 T3 11.2 29.68 25.9 15 T5 15.2 30.65 21.4 anomalies on a yearly basis may have caused corals at Zaki’s reef to develop an adaptive resistance mechanism. It is no surprise that only six out of the 35 identified co- ral species in the Gulf of Suez dominate Zaki’s reef (>94%), and can be attributed to their adaptive resistance mechanisms to both low and high extreme temperatures. These corals have been living at the study site for hun- dreds of years, and may have the capacity to acclimatize or adapt to external stresses better than others. For exam- ple, previous comparisons among plants [38] and animals [39-41] have shown that some population or species are far more resilient compared to others with marked influ- ences on growth, survival, and disease resistance [41-43]. Furthermore, Barshis et al. [44] studied coral genes and concluded that some of these genes may bestow resil- ience through faster reaction during transient heat stress, which may prepare corals for frequently encountered stress. Coles and Fadlallah [31] reported that Acropora pha- raonis and Porites compressa in the Arabian Gulf suffer- ed severe mortality when the water temperature fell be- low 11.50˚C. Furthermore they reported that Porites com- pressa (the dominant species at their reef) and Faviidae corals showed sign of sub-lethal effects when tempera- ture was below 12.00˚C for two consecutive days, yet re- covered after six months. Some of the coral genera found in the Arabian Gulf are also found in Zaki’s reef (e.g., Acropora humilis and Porites columna). Unlike the Ara- bian Gulf counterpart, resident Acropora in Zaki’s reef survived well during the worldwide bleaching event in 2005, as well as during cold temperatures measured in the 2006 and 2007 winter seasons. However, Acropora on Zaki’s reef declined from 35% in 2004 to 14% in 2006 and 15% in 2007 (Figure 2). Based on the ability for Acropora to survive on Zaki’s reef during these ex- treme temperature events, we attribute this decline to a local oil spill, which occurred in 2005 (personal observa- tion), and not to exposure to lethal thermal limits. Tem- peratures on Zaki’s reef did not reach the same low tem- peratures (11.50˚C) as reported by Coles and Fadlallah [31], where all the Acrop ora colonies died. 5. CONCLUSIONS For four years (2004 through 2007), annual reef as- sessments via fixed video transect and random quadrat digital photo surveys were conducted to determine base- line conditions, assess the rate of reef recovery after the 2005 oil spill, and to evaluate the effects of increasing coastal development in the region. The data collected provided estimates of the number of coral species, per- centage of total living coverage, and diversity of coral. This unique and large data set will serve as a baseline for any future coral study in this region as it is the first of its kind. Coral thermal lethal limits are suggested first at water temperatures of 18˚C and second at 16˚C. Regardless of Copyright © 2013 SciRes. OPEN ACCESS  M. Z. Moustafa et al. / Open Journal of Ecology 3 (2013) 242-253 the currently known thermal lethal limits, corals at Zaki’s reef appear to be more resilient to extreme low and high seawater temperatures. Coral species at this location have adapted to those extreme seawater temperatures, and their wide range of temperature tolerance can be beneficial to local eco-tourism. Further scrutiny of these species and the mechanisms by which they are able to thrive is rec- ommended, as they hold the potential to benefit other coral communities as a resilient transplant species and model for understanding coral survivability in extreme environmental conditions. Transplants of coral species from Zaki’s reef to other reef locations (e.g., Hurghada a divers’ haven approximately 400 km south of the study site) can help restore some of the impacted reef sites, be- cause of their proven resilience and ability to survive exposure to both high and low temperatures. 6. ACKNOWLEDGEMENTS Special thanks to Samiah and Zachariah Moustafa for providing field assistance. Drs. Magda and Salah in Cairo, Egypt, allowed us to use their microbiology laboratories. We are greatly appreciative of PADI and the North Carolina Research Consortium for their financial support of this research, which allowed for the purchase of a weather station. Special thanks to Kory Wagner and his staff at Onset Computer corpo- ration for their donated time, equipment, and technical expertise in re- trieving sensor data. REFERENCES [1] Loya, Y. (1972) Community structure and species diver- sity of hermatypic corals at Eilat, Red Sea. Marine Biolo- gy, 13, 100-123. doi:10.1007/BF00366561 [2] Mustafa, F. (2000) Status of Coral Reefs in the Middle East, AIMS. http://www.aims.gov.au [3] Rinkevich, B. (2005) What do we know about Eilat (Red Sea) reef degradation? A critical examination of the pub- lished literature. Journal of Experimental Marine Biology and Ecology, 327, 183-200. doi:10.1016/j.jembe.2005.06.014 [4] Yassien, M.H., El-Ganainy, A.A. and Hasan, M.H. (2009) Shellfish fishery in the north western part of the Red Sea. World Journal of F [5] ish and Marine Sciences, 1, 97-104. [6] Hastenrath, S. and Lamb, P.J. (1979) Climatic atlas of the Indian Ocean, Part 2. The Ocean Heat Budget, University of Wisconsin, Madison. [7] Moustafa, M.Z. (1983) On water masses of the Red Sea. M.S. Thesis, Physical Oceanography Department, College of William and Mary. [8] Rowan, R. (2004) Coral bleaching—Thermal adaptation in reef coral symbionts. Nature, 430, 742-742. doi:10.1038/430742a [9] Baird, A.H., Bhagooli, R. , Ralph, P. J. and Takahashi, S. (2009) Coral bleaching: The role of the host. Tree, 24, 16- 20. doi:10.1016/j.tree.2008.09.005 [10] Brown, B.E. and Cossins, A.R. (2011) The potential for temperature acclimatization of reef corals in the face of climate change. In: Dubinsky, Z. and Stambler, N., Eds., Coral reefs: An ecosystem in transition. Springer, Dordre- cht Heidelberg London New York, 421-433. [11] Edmunds, P.J. (1994) Evidence that reef-wide patterns of coral bleaching may be the result of the distribution of bleaching susceptible clones. Marine Biology (Berlin), 121, 137-142. doi:10.1007/BF00349482 [12] Glynn, P.W., Mate, J.L., Baker, A.C. and Calderon, M.O. (2001) Coral bleaching and mortality in Panama and Ec- uador during the 1997-98 El Nino-Southern Oscillation event: Spatial/temporal patterns and comparisons with the 1982-1983 event. Bulletin of Marine Science, 69, 79-109. [13] Krishnan, P., Roy, S.D., George, G. , Srivastava, R.C., An- and, A., et al. (2011) Elevated sea surface temperature du- ring May 2010 induces mass bleaching of corals in the Andaman. Current Scinece , 100, 111-117. [14] Baria, M.V.B., de la Cruz, D.W., Villanueva, R.D. and Guest, J.R. (2012) Spawning of three-year-old Acropora millepora corals reared from larvae in northwestern Phil- ippines. The Bulletin of Materials Science, 88, 61-62. doi:10.5343/bms.2011.1075 [15] Lirman, D., Schopmeyer, S., Manzello, D., Gramer, L.J., Precht, W.F., et al. (2011) Cold-water event caused unpre- cedented mortality to corals of the florida reef tract and reversed previous survivorship patterns. PLoS ONE, 6, e23047. doi:10.1371/journal.pone.0023047 [16] Van Oppen, M.J.H. and Gates, R.D. (2006) Conservation genetics and the resilience of reef-building corals. Mo- lecular Ecology, 15, 3863-3883. doi:10.1111/j.1365-294X.2006.03026.x [17] Mumby, P.J . , Elliott, I.A., Eakin, C.M., Skirving, W., Pa- ris, C .P. , Edwards, H.J., Enriquez, S., Iglesias-Prieto, R., Cherubin, L. and Stevens, J.R. (2011) Reserve design for uncertain responses of coral reefs to climate change. Ecology Letters, 14, 132-140. doi:10.1111/j.1461-0248.2010.01562.x [18] Donner, S.D. (2011) An evaluation of the effect of recent temperature variability on the prediction of coral bleach- ing events. Ecological Applications, 21, 1718-1730. doi:10.1890/10-0107.1 [19] Moustafa, Z. D., Hallock, P., Moustafa, M.S. and Mous- tafa, M.Z. (2008) Survivalship of a red sea fringing coral reef under extreme environmental conditions. Proceedings of the 11th International Coral Reef Symposium, Lauder- dale. [20] Moustafa, Z.D., Moustafa, M.S. and Moustafa, M.Z. (200 8) What is normal? Extreme temperature variability on a high latitude, fringing red sea coral reef. ASLO/AGU Ocean Science Meeting, Orlando. [21] Page, C., Coleman, G. , Ninio, R. and Osborn, K. (2001) Surveys of sessile benthic communities using the video technique. AIMS standard operational procedure. AIMS. http://www.aims.gov.au [22] du Toit, S.H.C., Steyn, A.G.W. and Stumpf, R.H. (1986) Graphical exploratory data analysis. Spring-Verlag, New Copyright © 2013 SciRes. OPEN ACCESS  M. Z. Moustafa et al. / Open Journal of Ecology 3 (2013) 242-253 York, 314. [23] Jacoby, W.B. (1988) Statistical graphics for visualizing multivariate data. Sage University Paper Series on Quan- titative Application in the Social Science, Sage Publica- tions, Thousand Oaks, 102. [24] Chow, V.T. and Maidment, D.R.M (1988) Applied hydro- logy. McGraw-Hill, New York. [25] Stedinger, J.R., Vogel, R.M. and Foufoula-Georgious, E. (1993) Frequency analysis of extreme events in handbook of hydrology, McGraw-Hill. [26] Kohler, K.E. and Gill, S.M. (2006) Coral point count with excel extensions (CPCe): A visual basic program for the determination of coral and substrate coverage using ran- dom point count methodology. Computers and Geosci- ences, 32, 1259-1269. doi:10.1016/j.cageo.2005.11.009 [27] Myers, R. and Lieske, E. (2004) Coral reef guide red sea. Collins Publishers, London, England. [28] Conover, W.J. (1999) Practical nonparametric statistic s. 3rd Edition, Wiley, New York. [29] Hoegh-Guldberg, O. and Smith, G. J. (1989) The effect of sudden changes in temperature, light and salinity on the population density and export of zooxanthallae from the reef corals Stylophora pistillata (Esper) and Seriatopora hystrix (Dana). Journal of Experimental Marine Biology and Ecology, 129, 279-303. doi:10.1016/0022-0981(89)90109-3 [30] Schiedek, D., Sundelin, B., Readman, J.W.R., MacDonald, R.W. (2007) Interactions between climate change and con- taminants. Marine Pollution Bulletin, 54, 1845-1856. doi:10.1016/j.marpolbul.2007.09.020 [31] Hughes, T.P., Baird, A.H., Bellwood, D.R., Card, M., Con- nolly, S.R., Folke, C., Grosberg, R., Hoegh-Guldberg, O., Jackson, J.B.C., Kleypas, J., Lough, J.M., Marshall, P., Ny- strom, M., Palumbi, S.R., Pandolfi, J.M., Rosen, B. and Roughgarden, J (2003) Climate change, human impacts, and the resilience of coral reefs. Science, 301, 929-933. doi:10.1126/science.1085046 [32] Coles, S.L. and Fadlallah, Y. H. (1991) Reef coral survival and mortality at low temperatures in the Arabian Gulf: New species-specific lower temperature limits. Coral Reefs, 9, 231-237. doi:10.1007/BF00290427 [33] Muhando, C.A. (2002) Seawater temperature on shallow reefs off zanzibar town, Tanzania. In: Linden, O., Souter, D., Wilhelmsson, D. and Obura, D., Eds., Coral reef degra- dation in the Indian Ocean. Status Report 2002. CORDIO, Kalmar, 40-46. [34] Goreau, T.J. and Haye s , R.L. (1994) Coral bleaching and ocean “hot spots”. Ambio, 23, 176-180. [35] Winter, A. and Appeldoon, R. S., Bruckner, A., Williams Jr., E.H. and Goenaga, C. (1998) Sea surface temperature and coral reef bleaching off La Parguera, Puerto Rico (nor- theastern Caribbean Sea). Coral Reefs, 17, 377-382. doi:10.1007/s003380050143 [36] Szmant, A.M. and Gassman, N.J. (1990) The effects of pro- longed ‘‘bleaching’’ on the tissue biomass and reproduc- tion of the reef coral Montastrea annularis. Coral Reefs, 8, 217-224. doi:10.1007/BF00265014 [37] Mendes, J.M. and, Woodley, J.D. (2002) Effect of the 1995-1996 bleaching event on polyp tissue depth, growth, reproduction and skeletal band formation in Montastraea annularis. Marine Ecology Progress Series, 235, 93-102. doi:10.3354/meps235093 [38] Jokiel, P.L. and Coles, S.L. (1990) Response of Hawaiian and other Indo-Pacific reef corals to elevated temperature. Coral Reefs, 8, 155-162. doi:10.1007/BF00265006 [39] Ingram, J. and Bartels, D. (1996) The molecular basis of dehydration tolerance in plants. Annual Review of Plant Physiology and Plant Molecular Biology, 47, 377-403. doi:10.1146/annurev.arplant.47.1.377 [40] Huey, R.B. and Kingsolver, J . G. (1993) Evolution of re- sistance to high-temperatures in ectotherms. The Ameri- can Naturalist, 142, S21-S46. doi:10.1086/285521 [41] Somero, G.N. (2002) Thermal physiology and vertical zo- nation of intertidal animals: Optima, limits, and costs of living. Integrative and Comparative Biology, 42, 780-789. doi:10.1093/icb/42.4.780 [42] Hochachka, P.W. and Somero, G. N . (2002) Biochemical adaptation: Mechanism and process in physiological evo- lution. Oxford University Press, New York. [43] Nevo, E. (2001) Evolution of genome-phenome diversity under environmental stress. Proceedings of National Aca- demy of Science of the USA, 98, 6233-6240. doi:10.1073/pnas.101109298 [44] Parsons, P.A. (2005) Environments and evolution: Inter- actions between stress, resource inadequacy and energetic efficiency. Biological Reviews of the Cambridge Philo- sophical Society, 80, 589-610. doi:10.1017/S1464793105006822 [45] Barshis, D.J., Lander, J.T., Oliver, T.A ., Seneca, F.O., Tay- lor-Knowles, N. and Palumbi, S.R. (2012) Genomic basis for coral resilience to climate change. www.pnas.org/content/early/2013/01/02/1210224110.full. pdf Copyright © 2013 SciRes. OPEN ACCESS
|