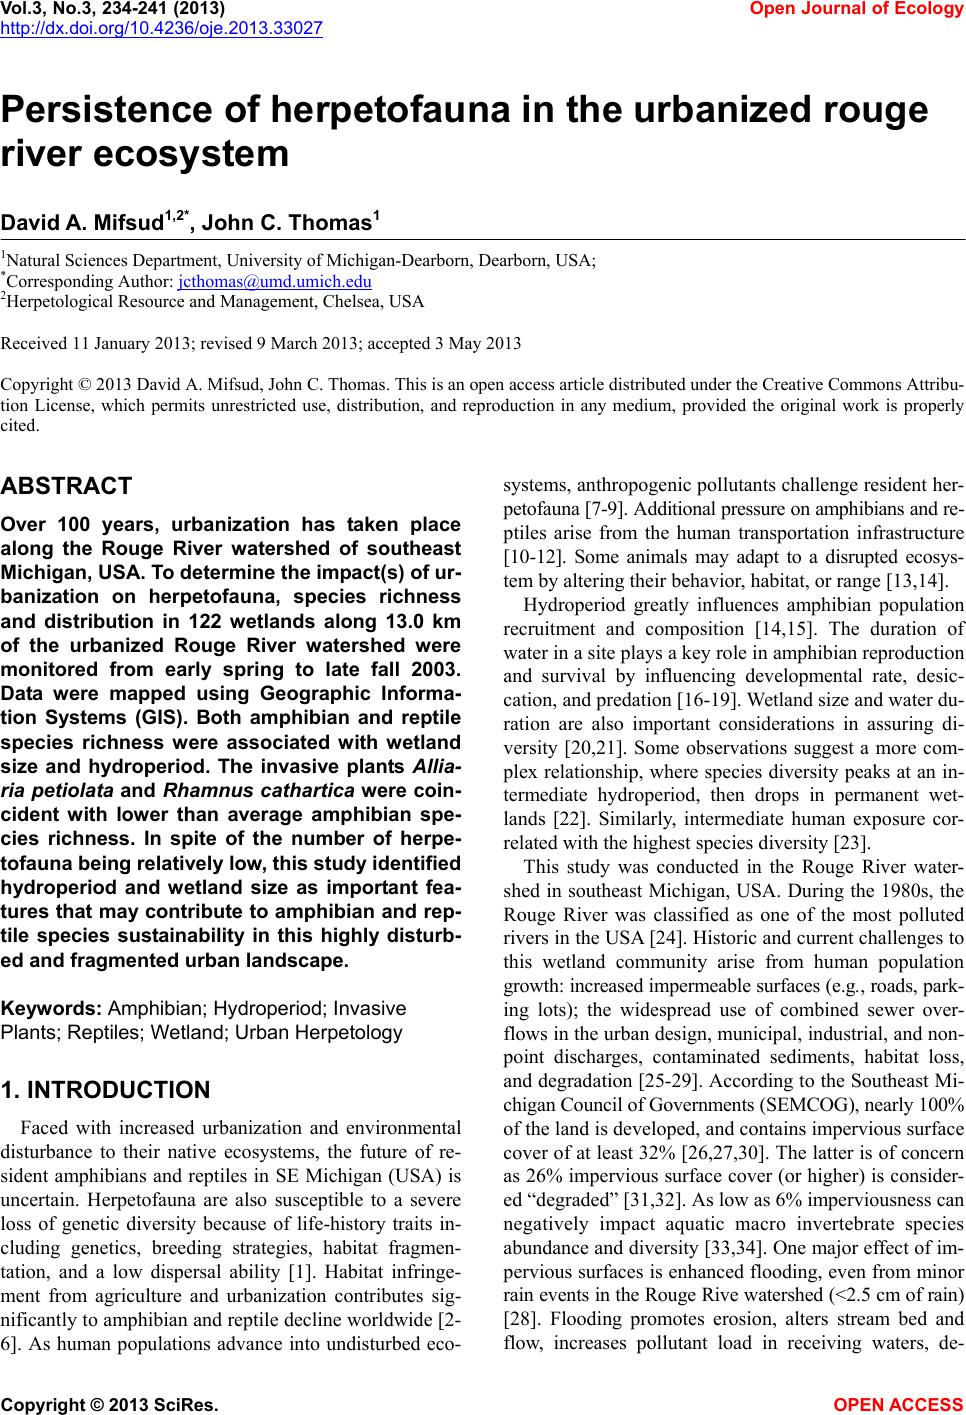
 Vol.3, No.3, 234-241 (2013) Open Journal of Ecology http://dx.doi.org/10.4236/oje.2013.33027 Persistence of herpetofauna in the urbanized rouge river ecosystem David A. Mifsud1,2*, John C. Thomas1 1Natural Sciences Department, University of Michigan-Dearborn, Dearborn, USA; *Corresponding Author: jcthomas@umd.umich.edu 2Herpetological Resource and Management, Chelsea, USA Received 11 January 2013; revised 9 March 2013; accepted 3 May 2013 Copyright © 2013 David A. Mifsud, John C. Thomas. This is an open access article distributed under the Creative Commons Attribu- tion License, which permits unrestricted use, distribution, and reproduction in any medium, provided the original work is properly cited. ABSTRACT Over 100 years, urbanization has taken place along the Rouge River watershed of southeast Michigan, USA. To determine the impact(s) of ur- banization on herpetofauna, species richness and distribution in 122 wetlands along 13.0 km of the urbanized Rouge River watershed were monitored from early spring to late fall 2003. Data were mapped using Geographic Informa- tion Systems (GIS). Both amphibian and reptile species richness were associated with wetland size and hydroperiod. The invasive plants Allia- ria petiolata and Rhamnus cathartica were coin- cident with lower than average amphibian spe- cies richness. In spite of the number of herpe- tofauna bein g re lati v ely low, this stu d y identified hydroperiod and wetland size as important fea- tures that may contribute to amphibian and rep- tile species sustainability in this highly disturb- ed and fragmented urban landscape. Keywords: Amphibian; Hydroperi od; Invasive Plants; Reptiles; Wetland; Urban Herpet ology 1. INTRODUCTION Faced with increased urbanization and environmental disturbance to their native ecosystems, the future of re- sident amphibians and reptiles in SE Michigan (USA) is uncertain. Herpetofauna are also susceptible to a severe loss of genetic diversity because of life-history traits in- cluding genetics, breeding strategies, habitat fragmen- tation, and a low dispersal ability [1]. Habitat infringe- ment from agriculture and urbanization contributes sig- nificantly to amphibian and reptile decline worldwide [2- 6]. As human populations advance into undisturbed eco- systems, anthropogenic pollutants challenge resident her- petofauna [7-9]. Additional pressure on amphibians and re- ptiles arise from the human transportation infrastructure [10-12]. Some animals may adapt to a disrupted ecosys- tem by altering their behavior, habitat, or range [13,14]. Hydroperiod greatly influences amphibian population recruitment and composition [14,15]. The duration of water in a site plays a key role in amphibian reproduction and survival by influencing developmental rate, desic- cation, and predation [16-19]. Wetland size and water du- ration are also important considerations in assuring di- versity [20,21]. Some observations suggest a more com- plex relationship, where species diversity peaks at an in- termediate hydroperiod, then drops in permanent wet- lands [22]. Similarly, intermediate human exposure cor- related with the highest species diversity [23]. This study was conducted in the Rouge River water- shed in southeast Michigan, USA. During the 1980s, the Rouge River was classified as one of the most polluted rivers in the USA [24]. Historic and current challenges to this wetland community arise from human population growth: increased impermeable surfaces (e.g., roads, park- ing lots); the widespread use of combined sewer over- flows in the urban design, municipal, industrial, and non- point discharges, contaminated sediments, habitat loss, and degradation [25-29]. According to the Southeast Mi- chigan Council of Governments (SEMCOG), nearly 100% of the land is developed, and contains impervious surface cover of at least 32% [26,27,30]. The latter is of concern as 26% impervious surface cover (or higher) is consider- ed “degraded” [31,32]. As low as 6% imperviousness can negatively impact aquatic macro invertebrate species abundance and diversity [33,34]. One major effect of im- pervious surfaces is enhanced flooding, even from minor rain events in the Rouge Rive watershed (<2.5 cm of rain) [28]. Flooding promotes erosion, alters stream bed and flow, increases pollutant load in receiving waters, de- Copyright © 2013 SciRes. OPEN A CCESS 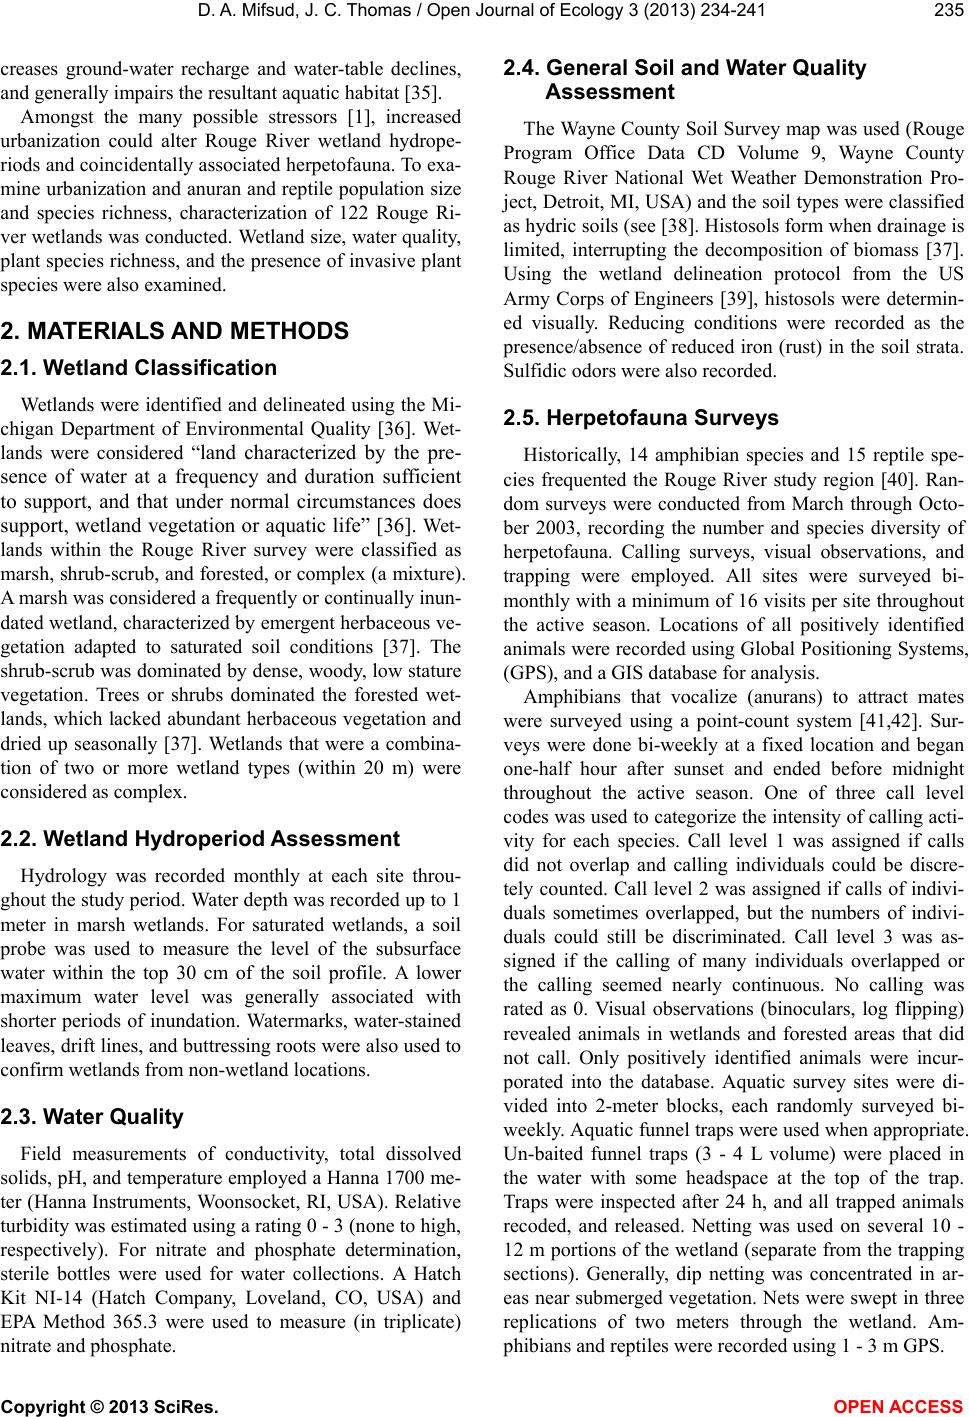 D. A. Mifsud, J. C. Thomas / Open Journal of Ecology 3 (2013) 234-241 235 creases ground-water recharge and water-table declines, and generally impairs the resultant aquatic habitat [35]. Amongst the many possible stressors [1], increased urbanization could alter Rouge River wetland hydrope- riods and coincidentally associated herpetofauna. To exa- mine urbanization and anuran and reptile population size and species richness, characterization of 122 Rouge Ri- ver wetlands was conducted. Wetland size, water quality, plant species richness, and the presence of invasive plant species were also examined. 2. MATERIALS AND METHODS 2.1. Wetland Classification Wetlands were identified and delineated using the Mi- chigan Department of Environmental Quality [36]. Wet- lands were considered “land characterized by the pre- sence of water at a frequency and duration sufficient to support, and that under normal circumstances does support, wetland vegetation or aquatic life” [36]. Wet- lands within the Rouge River survey were classified as marsh, shrub-scrub, and forested, or complex (a mixture). A marsh was considered a frequently or continually inun- dated wetland, characterized by emergent herbaceous ve- getation adapted to saturated soil conditions [37]. The shrub-scrub was dominated by dense, woody, low stature vegetation. Trees or shrubs dominated the forested wet- lands, which lacked abundant herbaceous vegetation and dried up seasonally [37]. Wetlands that were a combina- tion of two or more wetland types (within 20 m) were considered as complex. 2.2. Wetland Hydroperiod Assessment Hydrology was recorded monthly at each site throu- ghout the study period. Water depth was recorded up to 1 meter in marsh wetlands. For saturated wetlands, a soil probe was used to measure the level of the subsurface water within the top 30 cm of the soil profile. A lower maximum water level was generally associated with shorter periods of inundation. Watermarks, water-stained leaves, drift lines, and buttressing roots were also used to confirm wetlands from non-wetland locations. 2.3. Water Quality Field measurements of conductivity, total dissolved solids, pH, and temperature employed a Hanna 1700 me- ter (Hanna Instruments, Woonsocket, RI, USA). Relative turbidity was estimated using a rating 0 - 3 (none to high, respectively). For nitrate and phosphate determination, sterile bottles were used for water collections. A Hatch Kit NI-14 (Hatch Company, Loveland, CO, USA) and EPA Method 365.3 were used to measure (in triplicate) nitrate and phosphate. 2.4. General Soil and Water Quality Assessment The Wayne County Soil Survey map was used (Rouge Program Office Data CD Volume 9, Wayne County Rouge River National Wet Weather Demonstration Pro- ject, Detroit, MI, USA) and the soil types were classified as hydric soils (see [38]. Histosols form when drainage is limited, interrupting the decomposition of biomass [37]. Using the wetland delineation protocol from the US Army Corps of Engineers [39], histosols were determin- ed visually. Reducing conditions were recorded as the presence/absence of reduced iron (rust) in the soil strata. Sulfidic odors were also recorded. 2.5. Herpetofauna Surveys Historically, 14 amphibian species and 15 reptile spe- cies frequented the Rouge River study region [40]. Ran- dom surveys were conducted from March through Octo- ber 2003, recording the number and species diversity of herpetofauna. Calling surveys, visual observations, and trapping were employed. All sites were surveyed bi- monthly with a minimum of 16 visits per site throughout the active season. Locations of all positively identified animals were recorded using Global Positioning Systems, (GPS), and a GIS database for analysis. Amphibians that vocalize (anurans) to attract mates were surveyed using a point-count system [41,42]. Sur- veys were done bi-weekly at a fixed location and began one-half hour after sunset and ended before midnight throughout the active season. One of three call level codes was used to categorize the intensity of calling acti- vity for each species. Call level 1 was assigned if calls did not overlap and calling individuals could be discre- tely counted. Call level 2 was assigned if calls of indivi- duals sometimes overlapped, but the numbers of indivi- duals could still be discriminated. Call level 3 was as- signed if the calling of many individuals overlapped or the calling seemed nearly continuous. No calling was rated as 0. Visual observations (binoculars, log flipping) revealed animals in wetlands and forested areas that did not call. Only positively identified animals were incur- porated into the database. Aquatic survey sites were di- vided into 2-meter blocks, each randomly surveyed bi- weekly. Aquatic funnel traps were used when appropriate. Un-baited funnel traps (3 - 4 L volume) were placed in the water with some headspace at the top of the trap. Traps were inspected after 24 h, and all trapped animals recoded, and released. Netting was used on several 10 - 12 m portions of the wetland (separate from the trapping sections). Generally, dip netting was concentrated in ar- eas near submerged vegetation. Nets were swept in three replications of two meters through the wetland. Am- phibians and reptiles were recorded using 1 - 3 m GPS. Copyright © 2013 SciRes. OPEN A CCESS 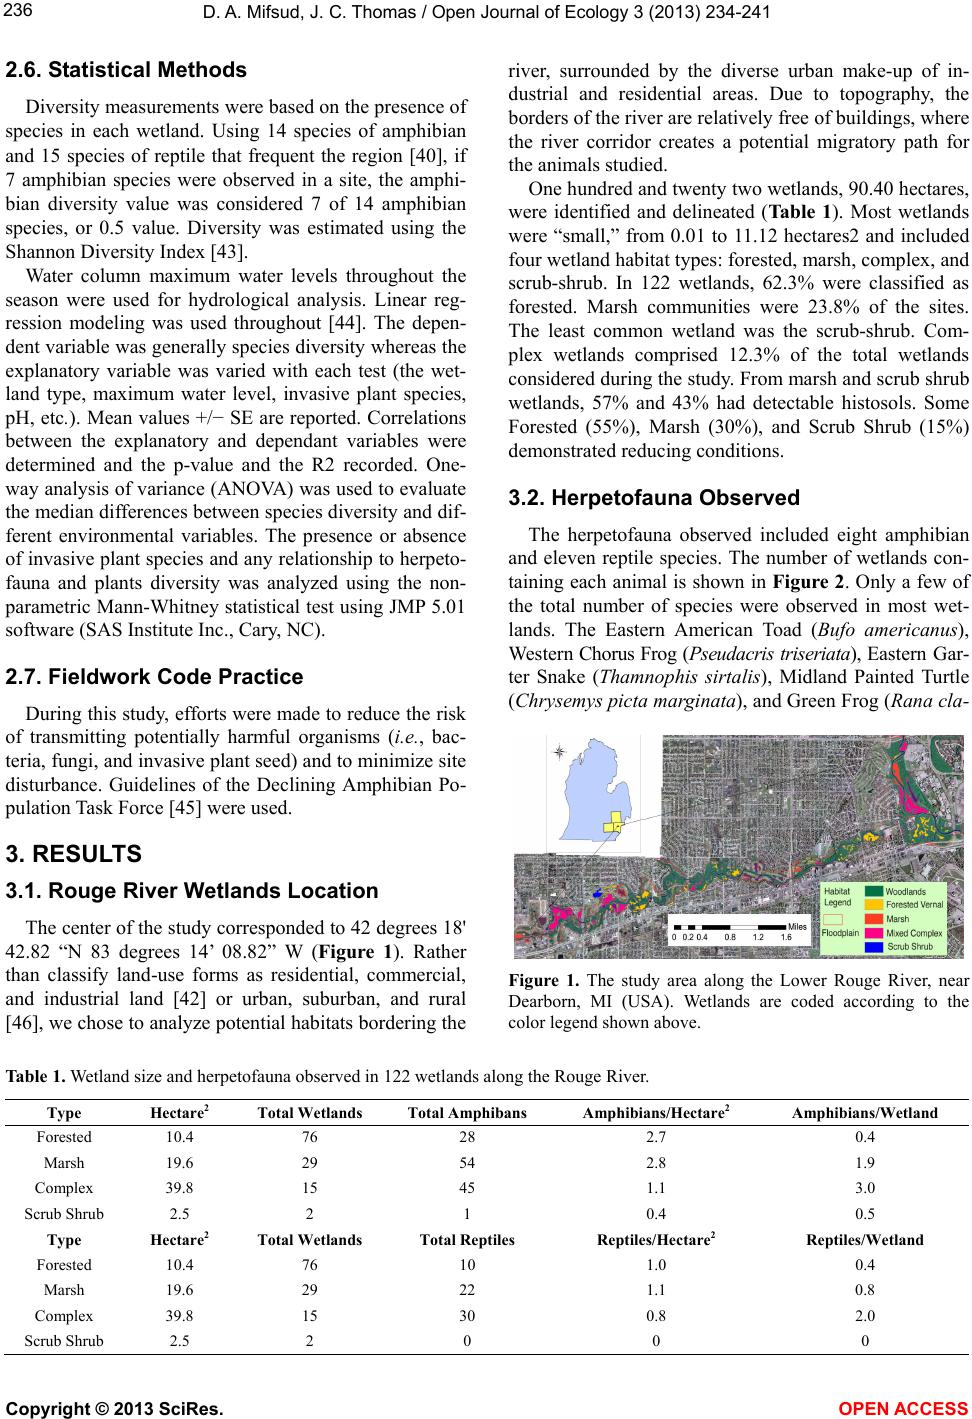 D. A. Mifsud, J. C. Thomas / Open Journal of Ecology 3 (2013) 234-241 Copyright © 2013 SciRes. 236 2.6. Statistical Methods Diversity measurements were based on the presence of species in each wetland. Using 14 species of amphibian and 15 species of reptile that frequent the region [40], if 7 amphibian species were observed in a site, the amphi- bian diversity value was considered 7 of 14 amphibian species, or 0.5 value. Diversity was estimated using the Shannon Diversity Index [43]. OPEN A CCESS Water column maximum water levels throughout the season were used for hydrological analysis. Linear reg- ression modeling was used throughout [44]. The depen- dent variable was generally species diversity whereas the explanatory variable was varied with each test (the wet- land type, maximum water level, invasive plant species, pH, etc.). Mean values +/− SE are reported. Correlations between the explanatory and dependant variables were determined and the p-value and the R2 recorded. One- way analysis of variance (ANOVA) was used to evaluate the median differences between species diversity and dif- ferent environmental variables. The presence or absence of invasive plant species and any relationship to herpeto- fauna and plants diversity was analyzed using the non- parametric Mann-Whitney statistical test using JMP 5.01 software (SAS Institute Inc., Cary, NC). 2.7. Fieldwork Code Practice During this study, efforts were made to reduce the risk of transmitting potentially harmful organisms (i.e., bac- teria, fungi, and invasive plant seed) and to minimize site disturbance. Guidelines of the Declining Amphibian Po- pulation Task Force [45] were used. 3. RESULTS 3.1. Rouge River Wetlands Location The center of the study corresponded to 42 degrees 18' 42.82 “N 83 degrees 14’ 08.82” W (Figure 1). Rather than classify land-use forms as residential, commercial, and industrial land [42] or urban, suburban, and rural [46], we chose to analyze potential habitats bordering the river, surrounded by the diverse urban make-up of in- dustrial and residential areas. Due to topography, the borders of the river are relatively free of buildings, where the river corridor creates a potential migratory path for the animals studied. One hundred and twenty two wetlands, 90.40 hectares, were identified and delineated (Ta b l e 1 ). Most wetlands were “small,” from 0.01 to 11.12 hectares2 and included four wetland habitat types: forested, marsh, complex, and scrub-shrub. In 122 wetlands, 62.3% were classified as forested. Marsh communities were 23.8% of the sites. The least common wetland was the scrub-shrub. Com- plex wetlands comprised 12.3% of the total wetlands considered during the study. From marsh and scrub shrub wetlands, 57% and 43% had detectable histosols. Some Forested (55%), Marsh (30%), and Scrub Shrub (15%) demonstrated reducing conditions. 3.2. Herpetofauna Observed The herpetofauna observed included eight amphibian and eleven reptile species. The number of wetlands con- taining each animal is shown in Figure 2. Only a few of the total number of species were observed in most wet- lands. The Eastern American Toad (Bufo americanus), Western Chorus Frog (Pseudacris triseriata), Eastern Gar- ter Snake (Thamnophis sirtalis), Midland Painted Turtle (Chrysemys picta marginata), and Green Frog (Rana cla- Figure 1. The study area along the Lower Rouge River, near Dearborn, MI (USA). Wetlands are coded according to the color legend shown above. Table 1. Wetland size and herpetofauna observed in 122 wetlands along the Rouge River. Type Hectare2 Total Wetlands Total Amphibans Amphibians/Hectare2 Amphibians/Wetland Forested 10.4 76 28 2.7 0.4 Marsh 19.6 29 54 2.8 1.9 Complex 39.8 15 45 1.1 3.0 Scrub Shrub 2.5 2 1 0.4 0.5 Type Hectare2 Total Wetlands Total Reptiles Reptiles/Hectare2 Reptiles/Wetland Forested 10.4 76 10 1.0 0.4 Marsh 19.6 29 22 1.1 0.8 Complex 39.8 15 30 0.8 2.0 Scrub Shrub 2.5 2 0 0 0  D. A. Mifsud, J. C. Thomas / Open Journal of Ecology 3 (2013) 234-241 237 (a) (b) Figure 2. (a) Distribution of amphibians (Figure 2(a)) in the wetland habitats; (b) Distribution of reptiles (Figure 2(b)) with- in the wetland habitats. mitans melanota) were the most often observed. Examin- ing the species found in each wetland habitat, more rep- tiles and amphibians were found in marsh and complex wetlands compared to the other habitats surveyed (Table 2). 3.3. Diversity, Wetland Area, Hydrology, and Habitat Classes Three surveyed wetlands contained the maximum spe- cies richness seen (5 amphibian species per wetland). Reptile species richness (overall) averaged 0.51 species (SE of 0.12) per wetland with the maximum of 10 spe- cies in one wetland. Shannon Diversity determinations were highest in Complex and Mash wetlands (Table 2). 3.4. Wetland Area, Hydroperiod, and Herpetofaunal Species Richness Hydroperiod data (maximum water level) were exam- ined with respect to species richness. ANOVA analysis showed an association between amphibian and reptile species richness and hydroperiod (Ta ble 3). Amphibian and reptile species richness were also associated with Table 2. Diversity determination using the Shannon index [43]. Symbol key, species richness (H), and evenness (Shannon’s Equ- itability). Habitat Amphibians + Reptiles Shannon Diversity Index (H) Shannon’s Equitability EH Forested38 1.49 0.80 Marsh 76 2.17 0.94 Complex71 2.52 0.89 Scrub Shrub1 0 0 plant species richness (Ta b l e 3 ). Distance (153 m) from the river system, water temperature, pH, conductivity, to- tal dissolved solids, nitrate and phosphate did not show significant effects on herpetofauna species richness (not shown). 3.5. Plant Diversity and Wetland Area The extent of wetland area was the most significant determinant in contributing to plant species richness, where the R2 is 0.90 (Ta ble 4). Some effects correlated with phosphate, and total dissolved solids were also ob- served (Table 4). Variables such as distance (153 m) from the river, water temperature, pH, conductivity, tur- bidity, and nitrogen levels did not significantly influen- ced plant community composition. In plants, the mean species richness per wetland (overall) was 16.02 species (SE of 0.75). Plant species richness was greatest in fores- ted wetlands (Figure 3). 3.6. Invasive Plant Species and Diversity Initial regression analysis between amphibian and rep- tile species richness versus invasive plant species reveal- ed some potential interactions. Spatial Analyses were done using ESRI ArcMap 8.3 with prevalence of garlic mustard (Allia ria petiolata) compared to overall herpeto- faunal species richness. For wetlands where garlic mus- tard was abundant or dominant (n = 9), herpetofauna ne- ver exceeded two species. In comparison, in wetlands with little or no garlic mustard, as high as 8 species of herpetofauna were observed (n = 82). Using the Mann- Whitney test to compare the two sets of unpaired data, amphibian species richness significantly declined with the co-presence of Garlic Mustard (Alliaria petiolata) or Buckthorn (Rhamnus cathartica) in wetlands (nearly 2 fold using a 2-tailed test, P value of 0.001). 4. DISCUSSION Until the early 20th century and the emergence of the auto industry, Southeast Michigan was largely forested or used as farmland. Today urbanization has created many paved roads that bisect the study site. Average daily traf- fic along selected principal highways (Michigan Avenue, Ford Road, and Telegraph Road) ranged from 39,000 Copyright © 2013 SciRes. OPEN A CCESS  D. A. Mifsud, J. C. Thomas / Open Journal of Ecology 3 (2013) 234-241 238 Table 3. ANOVA of amphibian and reptile species richness compared to several environmental variables. *Indicates a sig- nificant difference. Amphibians Dftotal R2 F Ratio P-value Wetland Area 121 0.17 4.93 0.0005* Hydroperiod 121 0.44 6.46 <0.0001* Plant Species Richness 121 0.20 5.81 <0.0001* Reptiles Dftotal R2 F Ratio P-value Wetland Area 121 0.44 14.96 <0.0001* Hydroperiod 121 0.27 3.20 <0.0006* Plant Species Richness 121 0.26 6.78 <0.0001* Table 4. ANOVA of plant species richness compared to several environmental factors. *Indicates a significant difference between diversity and the variable considered. Factors Dftotal R2 F Ratio P-value Wetland Area 121 0.90 26.11 <0.0001* Hydroperiod 121 0.23 2.43 0.0064 Dissolved Solids 121 0.62 2.23 0.008* Phosphate 121 0.79 2.94 0.008* 19.6 38.6 12.5 11.5 0.0 5.0 10.0 15.0 20.0 25.0 30.0 35.0 40.0 45.0 MarshForested Scrub-shrubComplex Plant Species/hectare Figure 3. Density of plant species, density/hectare 2. Values above bars indicate the actual value. to 58,000 vehicles per day [47]. This single impediment likely contributes to the paucity of herpetofauna in this area [12]. A survey of the amphibian and reptile commu- nity (including the Henry Ford mansion) in this frag- mented ecosystem was done to determine animal po- pulations and investigate species richness and distribu- tion. Hydroperiod and wetland size were both associated with amphibian and reptile species richness (Table 3) [17, 18,21,22]. Altered hydroperiod and habitat fragmentation resulting from intense agricultural land-use are known to significantly lower amphibian diversity [48-50]. Under fragmentation, “small” wetlands, such as those described here, likely provide significant habitat and refuge oppor- tunities for herpetofauna [22,28,49]. Plant species richness was also positively linked to amphibian and reptile species richness. Wetland area was the greatest determinant in plant species richness (Table 4). Invasive species garlic mustard and Buckthorn re- stricted herpetofaunal species richness by a factor of 2. This data is important, as the ecological plant community greatly influences the nature of the wetland (Marsh, Scrub Shrub, etc.) and amphibian and reptile populations. For example, particular plant species are known to pro- mote or inhibit herpetofauna diversity [23,51]. The observed herpetofaunal diversity (Table 2) provi- ded a reflection of the historic species coverage in this urban landscape [40,52]. Diversity of over 2.0 on the Shannon Diversity Index was found in Marsh and Com- plex habitats (Table 2). While encouraging, the total number of individual species/site was quite small (Fig- ure 2, Table 1), compared to a protected non-urban wet- land containing more than 360,000 individuals counted per year [31,53]. Given the low numbers of total indivi- duals per species recorded, it is surprising that moderate species richness was observed. Several reasons for this could include; the reproductive prowess of the herpe- tofauna studied here, the presence of Golf Course refugia [28], upstream emigration, resilience, the adaptive nature of these species, and perhaps even human re-introduction. The presence of Marsh and Complex vegetation and the general lack of fish (seen in only 3 marsh wetlands) in most small wetlands also likely contributed to the re- maining amphibian and reptile survival. Should road- crossing impediments and other “stressors” [1] become minimized, herpetofaunal abundance could increase in this region. One caveat is that this single season survey fails to account for innate dynamic population turnover sometimes observed in these animals [54]. 5. CONCLUSION Assuming a large mortality of herpetofauna likely due to the extensive road networks [10,12], this study found that wetland hydroperiod and size were linked to herpe- tofaunal species richness in relatively small Marsh and Scrub Shrub wetlands along the Rouge River. Plant spe- cies richness also had a positive effect on herpetofaunal species richness. Thinking forward, designed corridors and wetland connectivity could create accessible and lar- ger habitat areas in this urban setting, supporting greater amphibian and reptile populations and maintain species diversity. Knowledge of wetland size and hydrology, to- gether with a better understanding of the role of invasive plant species, herpetofaunal migratory patterns, and the use of buffer zones could greatly contribute to maintain- ning amphibian and reptile abundance and diversity in the urban Rouge River ecosystem [55]. This information could also aid in environmental planning and manage- ment to provide conservation-minded approaches to re- duce the risks caused by human infringement to herpe- tofauna. Copyright © 2013 SciRes. OPEN A CCESS 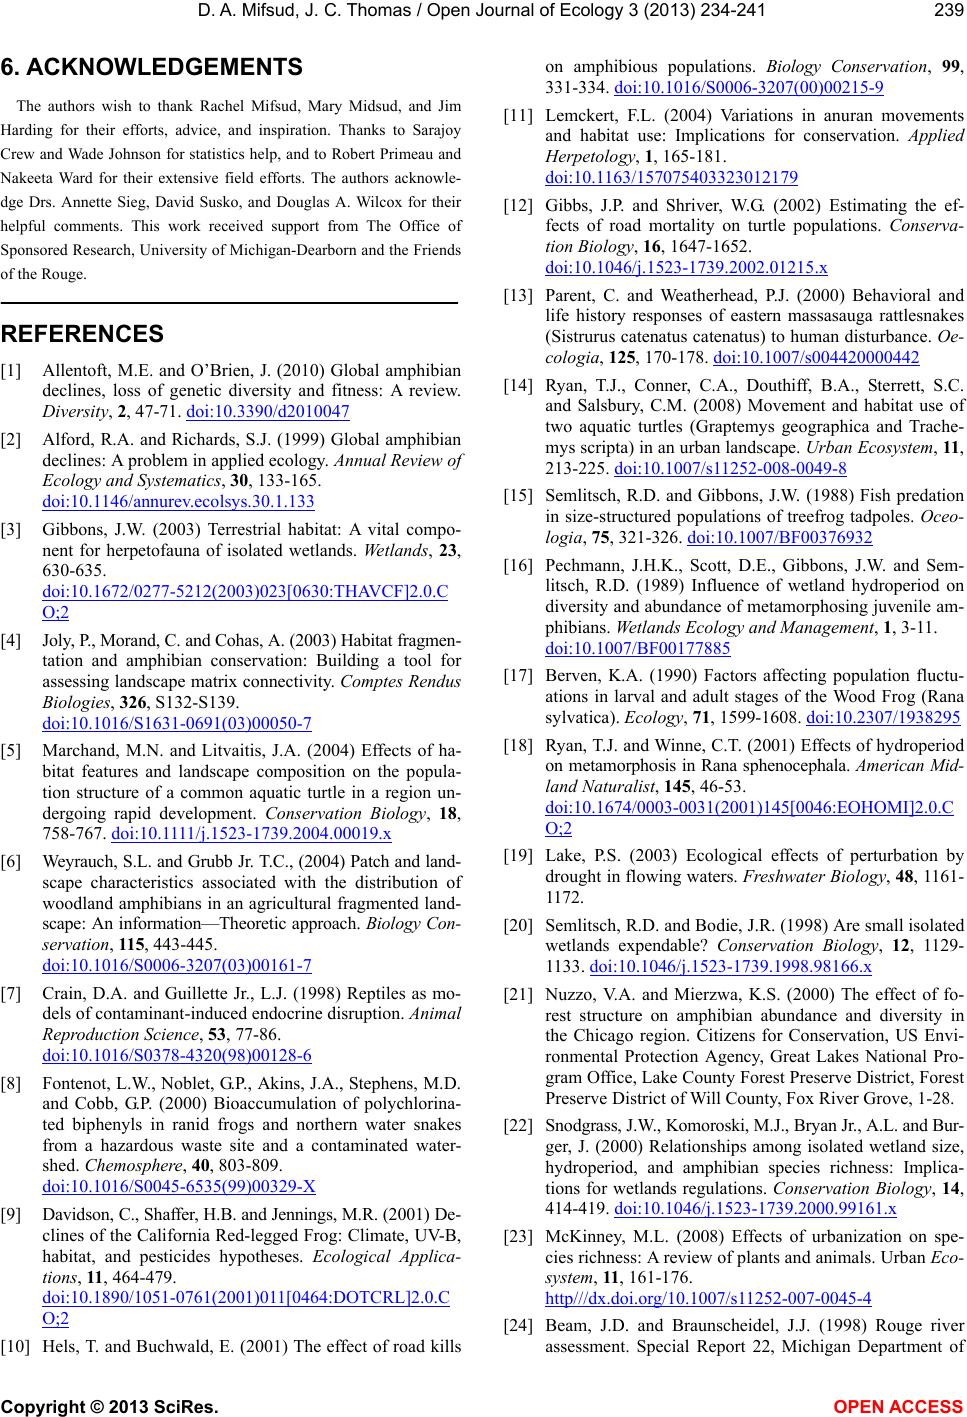 D. A. Mifsud, J. C. Thomas / Open Journal of Ecology 3 (2013) 234-241 239 6. ACKNOWLEDGEMENTS The authors wish to thank Rachel Mifsud, Mary Midsud, and Jim Harding for their efforts, advice, and inspiration. Thanks to Sarajoy Crew and Wade Johnson for statistics help, and to Robert Primeau and Nakeeta Ward for their extensive field efforts. The authors acknowle- dge Drs. Annette Sieg, David Susko, and Douglas A. Wilcox for their helpful comments. This work received support from The Office of Sponsored Research, University of Michigan-Dearborn and the Friends of the Rouge. REFERENCES [1] Allentoft, M.E. and O’Brien, J. (2010) Global amphibian declines, loss of genetic diversity and fitness: A review. Diversity, 2, 47-71. doi:10.3390/d2010047 [2] Alford, R.A. and Richards, S.J. (1999) Global amphibian declines: A problem in applied ecology. Annual Review of Ecology and Systematics, 30, 133-165. doi:10.1146/annurev.ecolsys.30.1.133 [3] Gibbons, J.W. (2003) Terrestrial habitat: A vital compo- nent for herpetofauna of isolated wetlands. Wetlands, 23, 630-635. doi:10.1672/0277-5212(2003)023[0630:THAVCF]2.0.C O;2 [4] Joly, P., Morand, C. and Cohas, A. (2003) Habitat fragmen- tation and amphibian conservation: Building a tool for assessing landscape matrix connectivity. Comptes Rendus Biologies, 326, S132-S139. doi:10.1016/S1631-0691(03)00050-7 [5] Marchand, M.N. and Litvaitis, J.A. (2004) Effects of ha- bitat features and landscape composition on the popula- tion structure of a common aquatic turtle in a region un- dergoing rapid development. Conservation Biology, 18, 758-767. doi:10.1111/j.1523-1739.2004.00019.x [6] Weyrauch, S.L. and Grubb Jr. T.C., (2004) Patch and land- scape characteristics associated with the distribution of woodland amphibians in an agricultural fragmented land- scape: An information—Theoretic approach. Biology Con- servation, 115, 443-445. doi:10.1016/S0006-3207(03)00161-7 [7] Crain, D.A. and Guillette Jr., L.J. (1998) Reptiles as mo- dels of contaminant-induced endocrine disruption. Animal Reproduction Science, 53, 77-86. doi:10.1016/S0378-4320(98)00128-6 [8] Fontenot, L.W., Noblet, G.P., Akins, J.A., Stephens, M.D. and Cobb, G.P. (2000) Bioaccumulation of polychlorina- ted biphenyls in ranid frogs and northern water snakes from a hazardous waste site and a contaminated water- shed. Chemosphere, 40, 803-809. doi:10.1016/S0045-6535(99)00329-X [9] Davidson, C., Shaffer, H.B. and Jennings, M.R. (2001) De- clines of the California Red-legged Frog: Climate, UV-B, habitat, and pesticides hypotheses. Ecological Applica- tions, 11, 464-479. doi:10.1890/1051-0761(2001)011[0464:DOTCRL]2.0.C O;2 [10] Hels, T. and Buchwald, E. (2001) The effect of road kills on amphibious populations. Biology Conservation, 99, 331-334. doi:10.1016/S0006-3207(00)00215-9 [11] Lemckert, F.L. (2004) Variations in anuran movements and habitat use: Implications for conservation. Applied Herpetology, 1, 165-181. doi:10.1163/157075403323012179 [12] Gibbs, J.P. and Shriver, W.G. (2002) Estimating the ef- fects of road mortality on turtle populations. Conserva- tion Biology, 16, 1647-1652. doi:10.1046/j.1523-1739.2002.01215.x [13] Parent, C. and Weatherhead, P.J. (2000) Behavioral and life history responses of eastern massasauga rattlesnakes (Sistrurus catenatus catenatus) to human disturbance. Oe- cologia, 125, 170-178. doi:10.1007/s004420000442 [14] Ryan, T.J., Conner, C.A., Douthiff, B.A., Sterrett, S.C. and Salsbury, C.M. (2008) Movement and habitat use of two aquatic turtles (Graptemys geographica and Trache- mys scripta) in an urban landscape. Urban Ecosystem, 11, 213-225. doi:10.1007/s11252-008-0049-8 [15] Semlitsch, R.D. and Gibbons, J.W. (1988) Fish predation in size-structured populations of treefrog tadpoles. Oceo- logia, 75, 321-326. doi:10.1007/BF00376932 [16] Pechmann, J.H.K., Scott, D.E., Gibbons, J.W. and Sem- litsch, R.D. (1989) Influence of wetland hydroperiod on diversity and abundance of metamorphosing juvenile am- phibians. Wetlands Ecology and Management, 1, 3-11. doi:10.1007/BF00177885 [17] Berven, K.A. (1990) Factors affecting population fluctu- ations in larval and adult stages of the Wood Frog (Rana sylvatica). Ecology, 71, 1599-1608. doi:10.2307/1938295 [18] Ryan, T.J. and Winne, C.T. (2001) Effects of hydroperiod on metamorphosis in Rana sphenocephala. American Mid- land Naturalist, 145, 46-53. doi:10.1674/0003-0031(2001)145[0046:EOHOMI]2.0.C O;2 [19] Lake, P.S. (2003) Ecological effects of perturbation by drought in flowing waters. Freshwater Biology, 48, 1161- 1172. [20] Semlitsch, R.D. and Bodie, J.R. (1998) Are small isolated wetlands expendable? Conservation Biology, 12, 1129- 1133. doi:10.1046/j.1523-1739.1998.98166.x [21] Nuzzo, V.A. and Mierzwa, K.S. (2000) The effect of fo- rest structure on amphibian abundance and diversity in the Chicago region. Citizens for Conservation, US Envi- ronmental Protection Agency, Great Lakes National Pro- gram Office, Lake County Forest Preserve District, Forest Preserve District of Will County, Fox River Grove, 1-28. [22] Snodgrass, J.W., Komoroski, M.J., Bryan Jr., A.L. and Bur- ger, J. (2000) Relationships among isolated wetland size, hydroperiod, and amphibian species richness: Implica- tions for wetlands regulations. Conservation Biology, 14, 414-419. doi:10.1046/j.1523-1739.2000.99161.x [23] McKinney, M.L. (2008) Effects of urbanization on spe- cies richness: A review of plants and animals. Urban Eco- system, 11, 161-176. http///dx.doi.org/10.1007/s11252-007-0045-4 [24] Beam, J.D. and Braunscheidel, J.J. (1998) Rouge river assessment. Special Report 22, Michigan Department of Copyright © 2013 SciRes. OPEN A CCESS  D. A. Mifsud, J. C. Thomas / Open Journal of Ecology 3 (2013) 234-241 240 Natural Resources, Fisheries Division, Lansing, MI 48909, Ann Arbor. http://www.michigan.gov/dnr/0,4570,7-153-10364_52259 _19056-46270--,00.html [25] Murray, K.S., Cauvet, D.C., Lybeer, M. and Thomas, J.C. (1999) Particle size and chemical control of heavy metals in bed sediment from the Rouge River, southeast Michi- gan. Environmental Science and Technology, 3, 987-992. doi:10.1021/es9807946 [26] Barnes, J.D., Cave, K., Cox, D., Dittmar, R., El-Gharib, R., Giberson, K., Graham, J., Heise, K., Lakhani, M., Lam- kin, G., Mullet, N., Powell, J., Sienkiewicz, S., Udoji, G. and Zoumbaris, J. (2001) Lower 2 rouge river subwa- tershed management plan. Rouge River Nat. Wet Wea- ther Demonstration Project, The Wayne County Rouge Program, Wayne Count. http://www.rougeriver.com/ [27] Beaudrie, C., Cave, K., Giberson, K., Graham, J., Heise, K., Kibby, M., Kozuh, J., Mullet, N., Powell, J., Sienkie- wicz, S., Snage, L., Udoji, G. and Witte, E.W. (2001) Main 3-4 rouge river subwatershed management plan. The Way- ne County Rouge Program, Wayne County. http://www.rougeriver.com/ [28] Mifsud, D.A. (2004) Influence of urban land use on her- petofaunal diversity and distribution within the Rouge Ri- ver Watershed. Southeast Michigan, USA. Natural Sci- ences Department, University of Michigan-Dearborn, Dearborn. [29] Thomas, J.C., Cable, E., Dabkowski, R.T., Gargala, S., McCall, D., Pangrazzi, G., Pierson, A., Ripper M., Russell, D.K. and Rugh, C.L. (2012) Native Michigan plants sti- mulate soil microbial species changes and PAH remedia- tion at a legacy steel mill. International Journal of Phy- tore mediation, 15, 1-15. doi:10.1080/15226514.2012.669800 [30] Rogers, J. (2003) Land-use change in southeast Michigan: Causes and consequences. SEMCOG. Detroit. [31] Arnold, C.L. and Gibbons, C.J. (1996) Impervious surface coverage. Journal of the American Planning Association, 62, 243-258. doi:10.1080/01944369608975688 [32] Schueler, T.R. and Holland H.K. (2000) The practice of watershed protection; techniques for protecting our na- tion’s streams, lakes, rivers, and estuaries. Center for Wa- tershed Protection Publishers, Ellicott City. [33] Paul, M.J. and Meyer, J.L. (2001) Streams in the urban land- scape. Annual Review of Ecology and Systematics, 32, 333-365. doi:10.1146/annurev.ecolsys.32.081501.114040 [34] Morse, C.C., Huryn, A.D. and Cronan. C. (2003) Imper- vious surface area as a predictor of the effects of urbani- zation on stream insect communities. Environmental Mo- nitoring and Assessment, 89, 95-127. doi:10.1023/A:1025821622411 [35] Benfield, F.K., Raimi, M.D. and Chen, D.T. (1999) Once there were greenfields. Natural Resources Defense Coun- cil and Surface Transportation Policy Project, New York. [36] MDEQ (2001) Wetland identification manual. Michigan Department of Environmental Quality, Lansing. [37] Mitsch, W.J. and Gosselink J.G. (2007) Wetlands. 4th Edition, John Wiley & Sons, Inc., Hoboken. [38] USDA (1987) Hydric soils of the United States. United States Department of Agriculture, USA. ftp://ftp-fc.sc.egov.usda.gov/NSSC/Hydric_Soils/FieldInd icators_v7.pdf [39] Engineers, U.A.C.O. (1987) Corps of engineers wetlands delineation manual. Environmental Laboratory. Wetlands Research Program Technical Report. http://www.sac.usace.army.mil/.../43/.../1987_wetland_de lineation_manual_reg.pdf [40] Great Lakes Region (1997) The University Michigan Press, Ann Arbor. [41] Stevens, C.E. and Paszkowski, C.A. (2004) Using chorus- size ranks from call surveys to estimate reproductive ac- tivity of the wood frog (Rana sylvatica). Journal of Her- petology, 38, 404-410. doi:10.1670/195-03A [42] Gagné, S.A. and Fahrig, L. (2007) Effect of landscape context on anuran communities in breeding ponds in the National Capital Region, Canada. Landscape Ecology, 22, 205-215. doi:10.1007/s10980-006-9012-3 [43] Shannon, C. (1948) A mathematical theory of communi- cation. Bell Systems Technological Journal, 27, 379-423. [44] Wheater, C.P. and Cook, P.A. (2000) Using statistics to understand the environment. Routledge, New York. [45] USFWS (2004) The declining amphibian population task force. U.S. Fish and Wildlife Service, Ventura. [46] Rubbo, M.J. and Kiesecker, J.M. (2005) Amphibian bree- ding distribution in an urbanized landscape. Conservation Biology, 19, 504-511. doi:10.1111/j.1523-1739.2005.000101.x [47] MDOT (2003) Average daily transportation map. Michi- gan Department of Transportation, Michigan. [48] Bonin, J.J., DesGranges, I., Rodrigue, J. and Ouellet, M. (1997) Anuran species richness in agricultural landscapes of Quebec: Foreseeing long-term results of road call sur- veys. In: Green, D.M, Ed., Amphibians in Decline: Cana- dian Studies of a Global Problem, Society for the Study of Amphibians and Reptiles, St. Louis, 141-149. [49] Hecnar, S.J. and M’Closkey, R.T. (1996) Regional dyna- mics and the status of amphibians. Ecology, 77, 2091- 2097. doi:10.2307/2265703 [50] Knutson, M.G., Sauer, J.R., Olsen, D.A., Mossman, M.J., Hemesath, L.M. and Lannoo, M.J. (1999) Effects of land- scape composition and wetland fragmentation on frog and toad abundance and species richness in Iowa and Wis- consin, USA. Conservation Biology, 13, 1437-1446. doi:10.1046/j.1523-1739.1999.98445.x [51] Russell, K.R., Guynn Jr., D.C. and Hanlin, H.G. (2002) Importance of small isolated wetlands for herpetofauna diversity in managed young growth forests in the Costal Plain of South Carolina. Ecology and Forest Management, 163, 43-59. doi:10.1016/S0378-1127(01)00526-6 [52] Magurran, A.E. (2004) Measuring biological diversity. Wiley, London. [53] Gibbons, J.W., Winne, C.T., Scott, D.E., Willson, J.D., Glaudas, X., Andrews, K.M., Todd, B.D., Fedewa, L.A., Wilkinson, L., Tsaliagos, R.N., Harper, S.J., Greene, J.L., Tuberville, T.D., Metts, B.S., Dorcas, M.E., Nestor, J.P., Copyright © 2013 SciRes. OPEN A CCESS  D. A. Mifsud, J. C. Thomas / Open Journal of Ecology 3 (2013) 234-241 Copyright © 2013 SciRes. OPEN A CCESS 241 Young, C.A., Akre, T., Reed, R.N., Buhlmann, K.A., Norman, J., Croshaw, D.A., Hagen, C. and Rothermel, B.B. (2006) Remarkable amphibian biomass and abun- dance in an isolated wetland: Implications for wetland conservation. Conservation Biology, 20, 1457-1465. doi:10.1111/j.1523-1739.2006.00443.x [54] Werner, E.E., Yurewicz, K.L., Skelly, D.K. and Relyea, R.A. (2007) Turnover in an amphibian metacommunity: The role of local and regional factors. Oikos, 116, 1713- 1725. doi:10.1111/j.0030-1299.2007.16039.x [55] Semlitsch, R.D. and Bodie, J.R. (2003) Biological criteria for buffer zones around wetlands and riparian habitats for amphibians and reptiles. Conservation Biology, 17, 1219- 1228. doi:10.1046/j.1523-1739.2003.02177.x
|