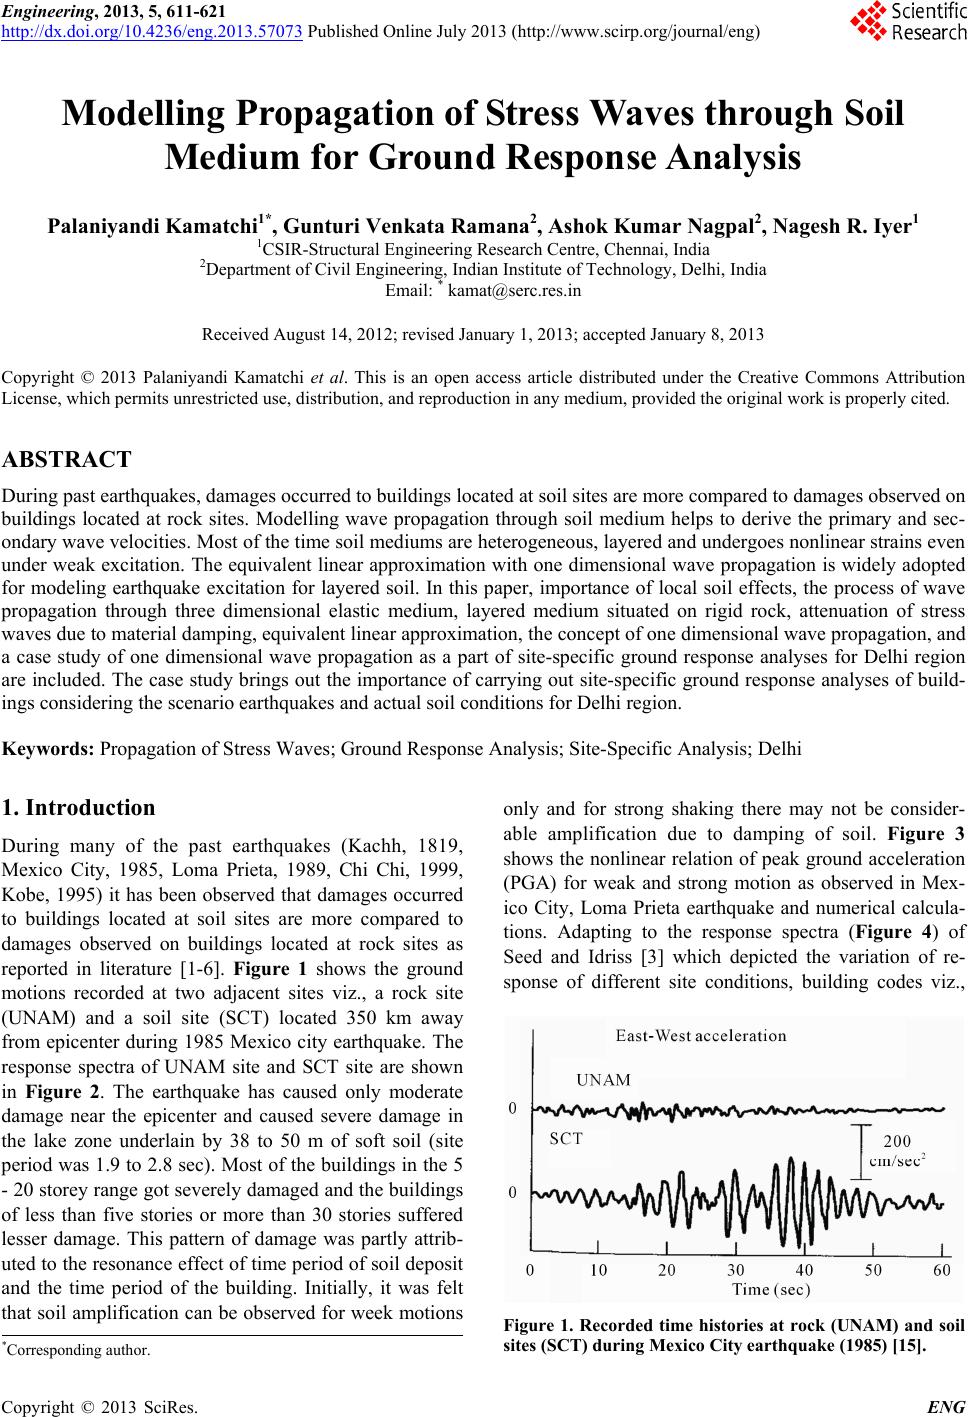
 Engineering, 2013, 5, 611-621 http://dx.doi.org/10.4236/eng.2013.57073 Published Online July 2013 (http://www.scirp.org/journal/eng) Modelling Propagation of Stress Waves through Soil Medium for Ground Response Analysis Palaniyandi Kamatchi1*, Gunturi Venkata Ramana2, Ashok Kumar Nagpal2, Nagesh R. Iyer1 1CSIR-Structural Engineering Research Centre, Chennai, India 2Department of Civil Engineering, Indian Institute of Technology, Delhi, India Email: * kamat@serc.res.in Received August 14, 2012; revised January 1, 2013; accepted January 8, 2013 Copyright © 2013 Palaniyandi Kamatchi et al. This is an open access article distributed under the Creative Commons Attribution License, which permits unrestricted use, distribution, and reproduction in any medium, provided the original work is properly cited. ABSTRACT During past earthquakes, damages occurred to buildings located at soil sites are more compared to damages observed on buildings located at rock sites. Modelling wave propagation through soil medium helps to derive the primary and sec- ondary wave velocities. Most of the time soil mediums are heterogeneous, layered and undergoes nonlinear strains even under weak excitation. The equivalent linear approximation with one dimensional wave propagation is widely adopted for modeling earthquake excitation for layered soil. In this paper, importance of local soil effects, the process of wave propagation through three dimensional elastic medium, layered medium situated on rigid rock, attenuation of stress waves due to material damping, equivalent linear approximation, the concept of one dimensional wave propagation, and a case study of one dimensional wave propagation as a part of site-specific ground response analyses for Delhi region are included. The case study brings out the importance of carrying out site-specific ground response analyses of build- ings considering the scenario earthquakes and actual soil conditions for Delhi region. Keywords: Propagation of Stress Waves; Ground Response Analysis; Site-Specific Analysis; Delhi 1. Introduction During many of the past earthquakes (Kachh, 1819, Mexico City, 1985, Loma Prieta, 1989, Chi Chi, 1999, Kobe, 1995) it has been observed that damages occurred to buildings located at soil sites are more compared to damages observed on buildings located at rock sites as reported in literature [1-6]. Figure 1 shows the ground motions recorded at two adjacent sites viz., a rock site (UNAM) and a soil site (SCT) located 350 km away from epicenter during 1985 Mexico city earthquake. The response spectra of UNAM site and SCT site are shown in Figure 2. The earthquake has caused only moderate damage near the epicenter and caused severe damage in the lake zone underlain by 38 to 50 m of soft soil (site period was 1.9 to 2.8 sec). Most of the buildings in the 5 - 20 storey range got severely damaged and the buildings of less than five stories or more than 30 stories suffered lesser damage. This pattern of damage was partly attrib- uted to the resonance effect of time period of soil deposit and the time period of the building. Initially, it was felt that soil amplification can be observed for week motions only and for strong shaking there may not be consider- able amplification due to damping of soil. Figure 3 shows the nonlinear relation of peak ground acceleration (PGA) for weak and strong motion as observed in Mex- ico City, Loma Prieta earthquake and numerical calcula- tions. Adapting to the response spectra (Figure 4) of Seed and Idriss [3] which depicted the variation of re- sponse of different site conditions, building codes viz., Figure 1. Recorded time histories at rock (UNAM) and soil sites (SCT) during Mexico City earthquake (1985) [15]. *Corresponding author. C opyright © 2013 SciRes. ENG 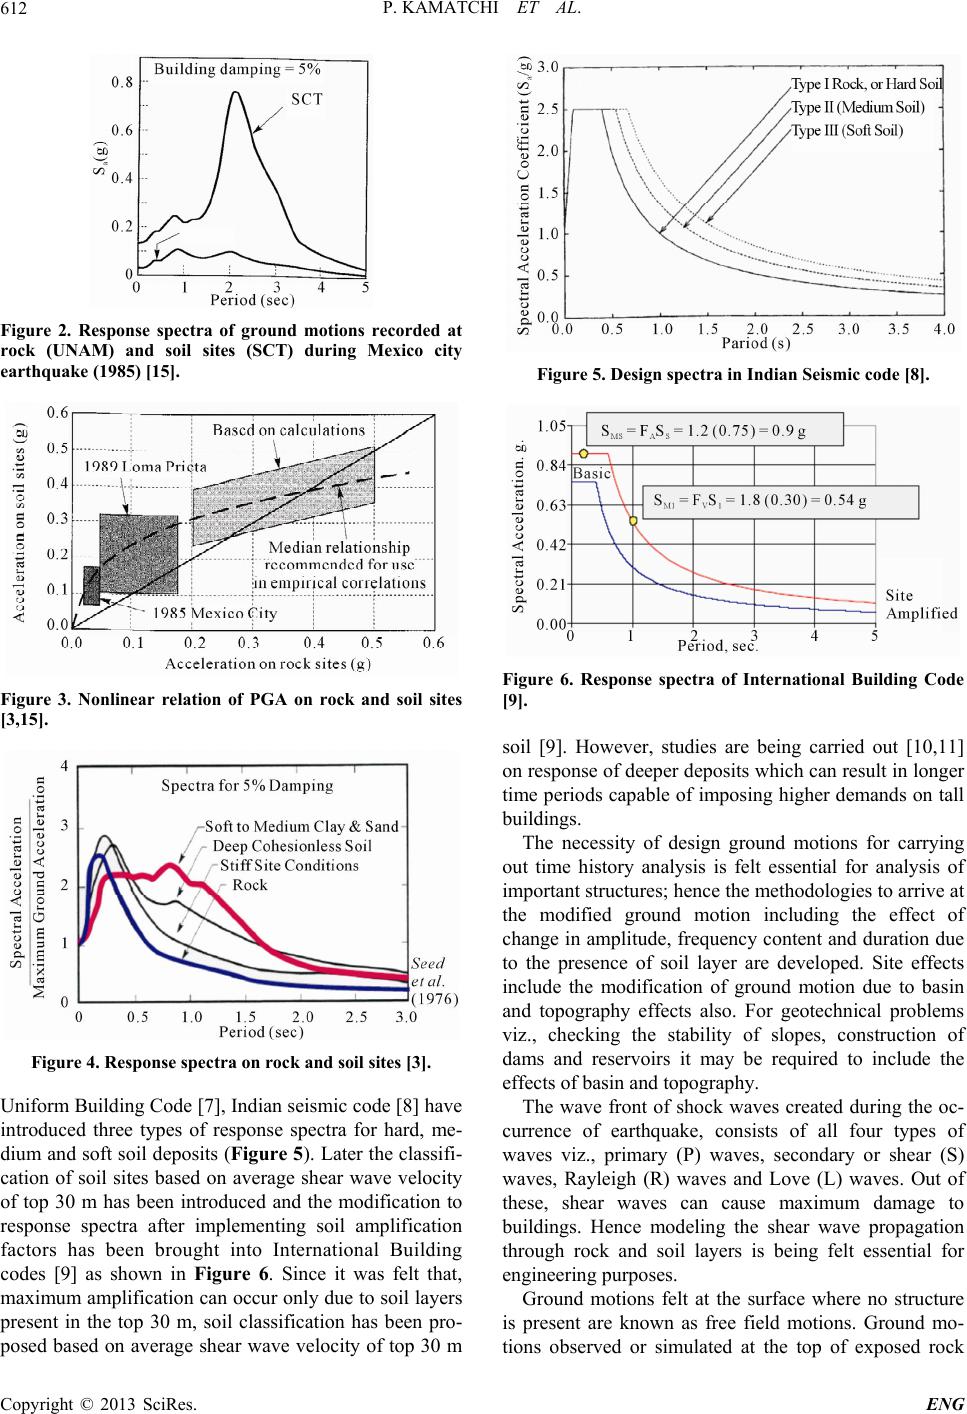 P. KAMATCHI ET AL. 612 Figure 2. Response spectra of ground motions recorded at rock (UNAM) and soil sites (SCT) during Mexico city earthquake (1985) [15]. Figure 3. Nonlinear relation of PGA on rock and soil sites [3,15]. Figure 4. Response spectra on rock and soil sites [3]. Uniform Building Code [7], Indian seismic code [8] have introduced three types of response spectra for hard, me- dium and soft soil deposits (Figure 5). Later the classifi- cation of soil sites based on average shear wave velocity of top 30 m has been introduced and the modification to response spectra after implementing soil amplification factors has been brought into International Building codes [9] as shown in Figure 6. Since it was felt that, maximum amplification can occur only due to soil layers present in the top 30 m, soil classification has been pro- posed based on average shear wave velocity of top 30 m Figure 5. Design spectra in Indian Seismic code [8]. Figure 6. Response spectra of International Building Code [9]. soil [9]. However, studies are being carried out [10,11] on response of deeper deposits which can result in longer time periods capable of imposing higher demands on tall buildings. The necessity of design ground motions for carrying out time history analysis is felt essential for analysis of important structures; hence the methodologies to arrive at the modified ground motion including the effect of change in amplitude, frequency content and duration due to the presence of soil layer are developed. Site effects include the modification of ground motion due to basin and topography effects also. For geotechnical problems viz., checking the stability of slopes, construction of dams and reservoirs it may be required to include the effects of basin and topography. The wave front of shock waves created during the oc- currence of earthquake, consists of all four types of waves viz., primary (P) waves, secondary or shear (S) waves, Rayleigh (R) waves and Love (L) waves. Out of these, shear waves can cause maximum damage to buildings. Hence modeling the shear wave propagation through rock and soil layers is being felt essential for engineering purposes. Ground motions felt at the surface where no structure is present are known as free field motions. Ground mo- tions observed or simulated at the top of exposed rock Copyright © 2013 SciRes. ENG  P. KAMATCHI ET AL. Copyright © 2013 SciRes. ENG 613 esponse analysis will include the pr are known as outcrop motions and the ground motions buildings and structures. In this paper, brief introduction about wave propagation through soil medium and a case study of site-specific ground response analysis for Delhi region are included. felt below the soil layer are denoted as bedrock motions. There are different definitions for bedrock, seismic bed- rock (shear wave velocity in the range of 3.2 km/sec) or engineering bedrock (shear wave velocity more than 400 m/sec). When the foundation is proposed to be located below the ground level for specific applications it is re- quired to arrive at the ground motion at the base of the soil layer using the surface level ground motions (simu- lated or recorded design ground motion for a specified risk level on surface). This process of obtaining the bed- rock motion from free field motion is known as de-convolution. Knowledge of propagation of horizontal component of shear wave through soil medium located on rigid or elastic rock is essential for carrying out soil amplification studies. A complete ground r 2. Wave Propagation through Soil Medium For carrying out dynamic analysis, structural elements made of materials viz., Reinforced Concrete (RC) and steel can be idealized as discrete elements with quantifi- able stiffness and mass. When the dynamic load is ap- plied to continuous medium like soil, the deformation that takes place in the soil medium causes stress waves. Propagation of stress waves through soil can be modelled by either of these three methods 1) stress waves in an elastic unbounded medium 2) stress waves in a longitu- dinal bar 3) stress waves in elastic half space. ocess of modeling the rupture mechanism at the source and the path attenuation and wave propagation through soil medium. The response spectrum at the soil surface is significantly different from that of bedrock response spectrum due to the modification of ground motion as it passes through the soil layers overlying the bedrock. Building codes are simplified tools and do not adequately represent any single earthquake event from a probable source for the site under consideration. Recently, it has been recommended [11-14] that in addition to the use of seismic codes, site-specific analysis which includes gen- eration of strong ground motion at bedrock level and propagating it through soil layers and arriving at the de- sign ground motions and response spectra at surface should also be carried out in the design of important 2.1. Three Dimensional Modeling of Wave Propagation through Soil Medium Situated on Rigid Rock To understand the propagation of stress waves in infinite elastic medium and bounded elastic medium equations of motion can be written in terms of stresses. Let the normal and shear stresses acting on a soil element with sides dx, dy and dz are x, y, z and xy, yx, yz, zy, zx, and xz respectively as shown in Figure 7. When u, v, and w are the displacement components in x, y and z directions the equation of equilibrium along x, y and z directions can be written as given in Equations (1)-(3) [16,17] wherein the unbalanced external forces are balanced by an inertial force, where is the mass per unit volume or the density. dx x xy xy dx x x x dx x xz xz z zx zy dy y y y dy y yz yz dy y yx yx yx σy yz dz z zy zy dz z z z dz z zx zx xz xy σx y x z Y X Figure 7. Stresses in an elastic solid. 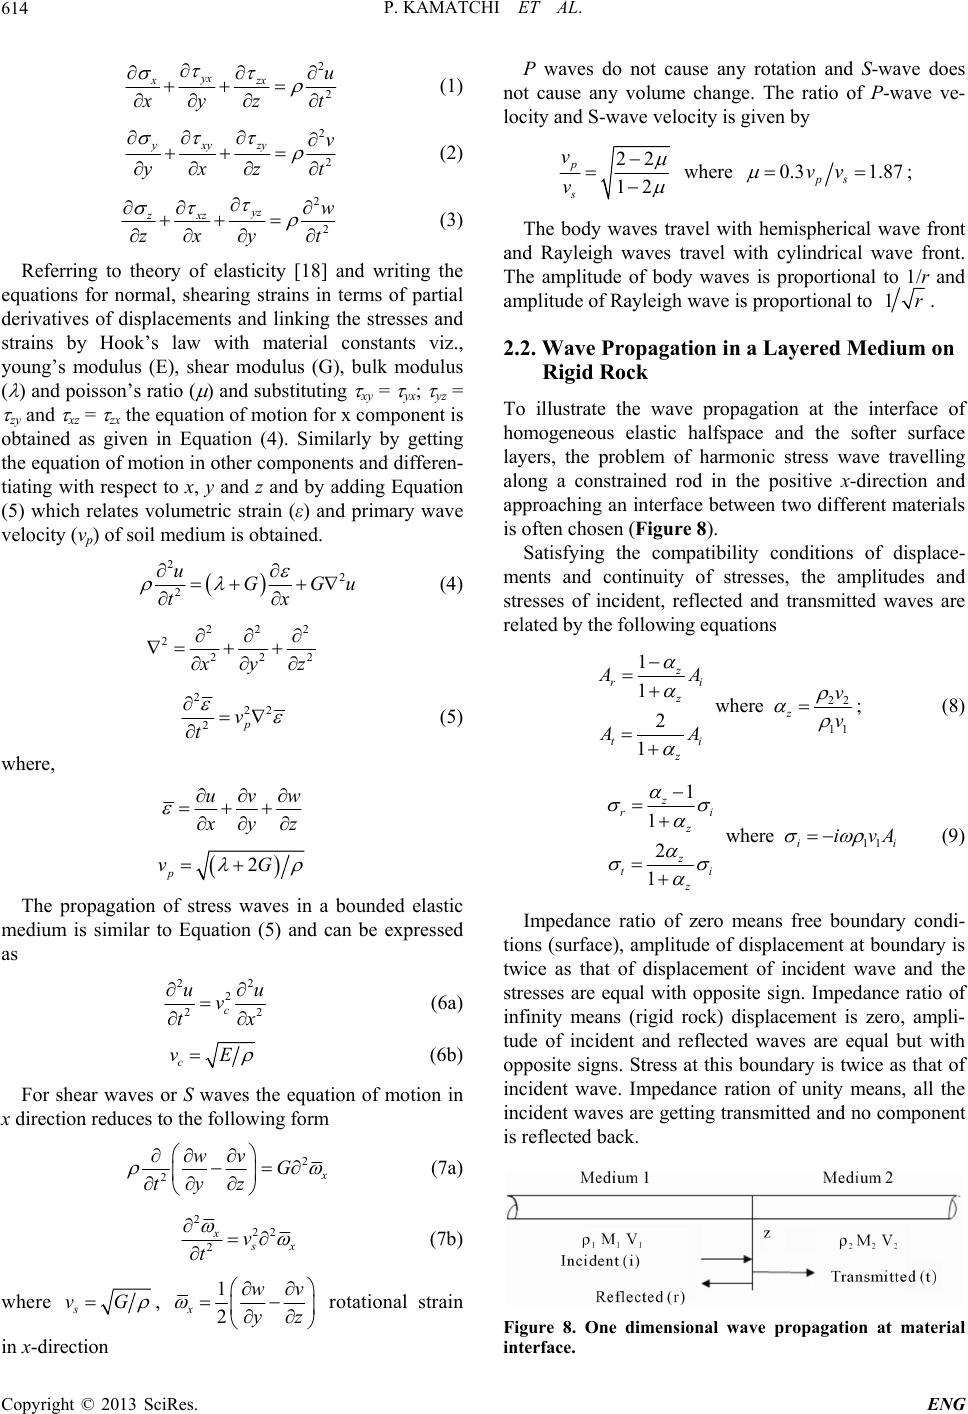 P. KAMATCHI ET AL. 614 2 2 yx xzx u yz t (1) 2 2 yxyzy v yxz t (2) 2 2 yz xz zw zxy t (3) Referring to theory of elasticity [18] and writing the eq o uations for normal, shearing strains in terms of partial derivatives of displacements and linking the stresses and strains by Hook’s law with material constants viz., young’s modulus (E), shear modulus (G), bulk modulus ( ) and poisson’s ratio ( ) and substituting xy = yx; yz = zy and xz = zx the equation of motion for x component is btained as given in Equation (4). Similarly by getting the equation of motion in other components and differen- tiating with respect to x, y and z and by adding Equation (5) which relates volumetric strain (ε) and primary wave velocity (vp) of soil medium is obtained. 2u 2 2GG u tx (4) 222 2 222 yz 2 22 2p v t (5) where, uvw yz 2 p vG The propagation of stress waves in a bounded elastic medium is similar to Equation (5) and can be expressed as 22 2 2 c uu v t 2 x (6a) c vE (6b) For shear waves or S waves the equation of motion in x direction reduces to the following form 2 2 wvG tyz (7a) 2 22 2 x x v t (7b) where s vG , 1 2 x wv yz rotational strain in x-direction ot cause any rotation and S-wave does volume change. The ratio of P-wave ve- lo P waves do n not cause any city and S-wave velocity is given by 22 p v 12 s v where 0.3v1.87 ps v ; The body waves t hemispherical wa front and Rayleigh waves travel with cylindrical wave front. Th ravel withve e amplitude of body waves is proportional to 1/r and amplitude of Rayleigh wave is proportional to 1r. 2.2. Wave Propagation in a Layered Med on ium Rigid Rock homoge halfspace and the softer surface esses, the amplitudes and st To illustrate the wave propagation at the interface of neous elastic layers, the problem of harmonic stress wave travelling along a constrained rod in the positive x-direction and approaching an interface between two different materials is often chosen (Figure 8). Satisfying the compatibility conditions of displace- ments and continuity of str resses of incident, reflected and transmitted waves are related by the following equations 22 11 1z ri AA 1where 2 1 z z ti z v v AA ; (8) 11 1 1where 2 1 z ri z ii z ti z ivA (9) Impedance ratio of zero means free boundary condi- tions (surface), amplitude of displacement at boundary is twice as that of displacement of incident wave and the stresses are equal with opposite sign. Impedance ratio of infinity means (rigid rock) displacement is zero, ampli- tude of incident and reflected waves are equal but with opposite signs. Stress at this boundary is twice as that of incident wave. Impedance ration of unity means, all the incident waves are getting transmitted and no component is reflected back. Figure 8. One dimensional wave propagation at materia interface. l Copyright © 2013 SciRes. ENG 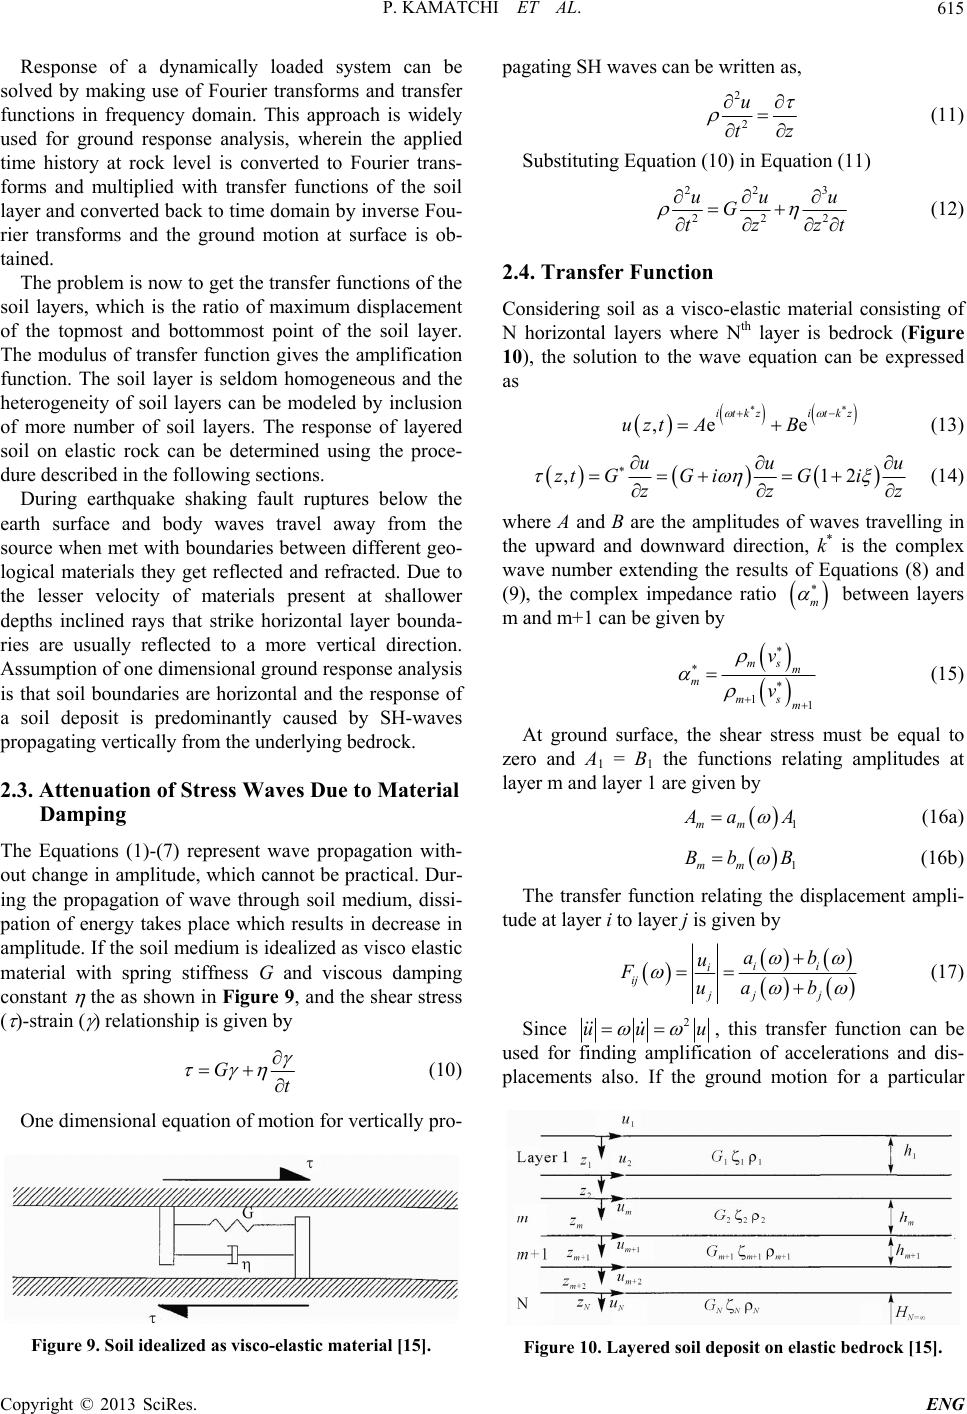 P. KAMATCHI ET AL. 615 Response of a dynamically loaded system can be solved by making use of Fourier transforms and transfer functions in frequency domain. This approach is widely used for ground response analysis, wherein the applied time history at rock level is converted to Fourier trans- forms and multiplied with transfer functions of the soil layer and converted back to time domain by inverse Fou- rier transforms and the ground motion at surface is ob- tained. The problem is now to get the transfer functions of the soil layers, which is the ratio of maximum displacement of the topmost and bottommost point of the soil layer. The modulus of transfer function gives the amplification function. The soil layer is seldom homogeneous and the heterogeneity of soil layers can be modeled by inclusion of more number of soil layers. The response of layered soil on elastic rock can be determined using the proce- dure described in the following sections. During earthquake shaking fault ruptures below the earth surface and body waves travel away from the source when met with boundaries between different geo- logical materials they get reflected and refracted. Due to the lesser velocity of materials present at shallower depths inclined rays that strike horizontal layer bounda- ries are usually reflected to a more vertical direction. Assumption of one dimensional ground response analysis is that soil boundaries are horizontal and the response of a soil deposit is predominantly caused by SH-waves propagating vertically from the underlying bedrock. 2.3. Attenuation of Stress Waves Due to Material The )-(7) represent wave propagation with- Damping Equations (1 out change in amplitude, which cannot be practical. Dur- ing the propagation of wave through soil medium, dissi- pation of energy takes place which results in decrease in amplitude. If the soil medium is idealized as visco elastic material with spring stiffness G and viscous damping constant the as shown in Figure 9, and the shear stress ( )-strain ( ) relationship is given by Gt (10) One dimensional equation of moti on for vertically pro- Figure 9. Soil idealized as visco-elastic material [15]. pagating SH waves can be written as, 2 2 u tz (11) Substituting Equation (10) in Equation (11) 22 3 22 uu G tzz 2 u t (12 Considering soil as a visco-elastic m N horizontal layers where Nth layer is bedrock ( 10 expressed as ) 2.4. Transfer Function aterial consisting of Figure ), the solution to the wave equation can be ,e e itkzitk uzt AB z (13) , u ztGG i 12 u u G i zz z where A and B are the amplitudes of waves travelling in the upward and downward direction, k* is the complex wave number extending the results of Equations (8) and (9), (14) the complex impedance ratio m between layers m and m+1 can be given by 11 ms m m ms m v v (15) At ground surface, the shear stress must be equal to zero and A1 = B1 the functions relating amplitudes at layer m and layer 1 are given by m 1m aA (16a) The transfer function relating the displacement ampli- tude at lay (16b) 1mm Bb B er i to layer j is given by ii i ij jj ab u Fua j b Since (17) 2 uu ,u this tran used for finding amplification of a placements also. If the ground motion for a particula sfer function can be r ccelerations and dis- Figure 10. Layered soil deposit on elastic bedrock [15]. Copyright © 2013 SciRes. ENG  P. KAMATCHI ET AL. 616 layer is known, the ground motion for the any other layer can be calculated using the transfer functions. 2.5. Equivalent Linear Approximation Soil undergoes inelastic strains even under very small level of ground shaking, hence nonlinear behavior of soil needs to be accounted. The hysteresis loop of soil under symmetric cyclic loading is given in Figure 11. The slope and width are the properties that define the charac cant shear entified as property of - ter t modulus will vary throughout the cycle of loading hence the average of tangent modulus denoted as se istics of ideal hysteresis loop of soil. The tangen modulus (Gsec) and the damping ratio ( ) are id the key parameters to define the hysteresis soil. sec c c G (18a) loop 2 sec 1 2c A G (18b) where c and c are the shear stress and shear strain am- plitudes, Aloop is the area of the hysteresis loop. Equiva- lent linear model is an approximation to the nonlinear behavior of soil. The secant shear modulus of an element of soil varies with cyclic shear strain amplitude. At low strain values Gsec is high but de increases. The locus of the points corresponding to the tips of hysteresis loops of various cyclic strain ampli- tudes is called a backbone curve (Fi origin represent largest values of shear modulus, Gmax. At creases as the strain value gure 12). It’s slope at greater cyclic strain amplitudes the modulus ratio Gsec/Gmax (same as G/Gsec) drops to values of less than 1. The variation of modulus ratio with strain is described by modulus reduction curve as shown in Figure 13. The value of Gmax is often determined by making use of the shear wave velocities measured from geophysical tests (which are carried out under the strain level of 3 × Figure 12. Backbone curve for shear modul [15]. us Figure 13. Tit shea 10−4%) using the relation ypical variation of shear modulus ratio w r strain [15]. h 2 max Gv th increase i . The width of the hysteretic loop increase win cyclic shear strain hence the damping ratio increases with increase in shear strain. Both modulus reduction ratio and damping ratio are influenced by plasticity characteristics, and the variation of modulus reduction ratio and damping ratio curves for different plasticity indices as developed by Vucetic and Dobry [19] are reproduced from Kramer in Figures 14 and 15. 2.6. Two and Three Dimensional Analyses ces, heavy structures, stiff or embedded structures, e two dime l strong ground motions including source path effects using stochastic finite fault model [20, One dimensional analysis may not be adequate for the structures located on sloping and irregular ground sur- fa walls and tunnels and hencnsional or possibly three dimensional analysis may need to be carried out. 3. Site-Specific Ground Response Analysis for Delhi Region—A Case Study In order to bring out the importance of site-specific analysis, three soil sites (viz., site 1, site 2 and site 3) have been chosen at Delhi, capital city of India as shown in Figure 16. Artificia Figure 11. Hysteresis loop of typical soil subjected to sym- metric cyclic loading [15]. Copyright © 2013 SciRes. ENG  P. KAMATCHI ET AL. 617 Figure 14. Modulus reduction curves for fine grained soil with different plasticity Indices after Vucetic Dobry [19]. Figure 15. Damping ratios curves for fine grained soil with different plasticity Indices after Vucetic Dobry [15]. (a) (b) Figure 16. Three soil sites of Delhi city. 21] are generated for a long distance scenario earth- quakes of moment magnitude (Mw) 7.5; 8.0 and 8.5 for a rock site at Delhi as shown in Figures 17(a)-(c) and (c) Figure 17. Comparison of artificial ground motions gener- ated for a rock site at Delhi for earthquakes from central seismic gap with similar generations from literature; (a) Mw = 7.5; (b) Mw = 8.0; (c) Mw = 8.5. Copyright © 2013 SciRes. ENG 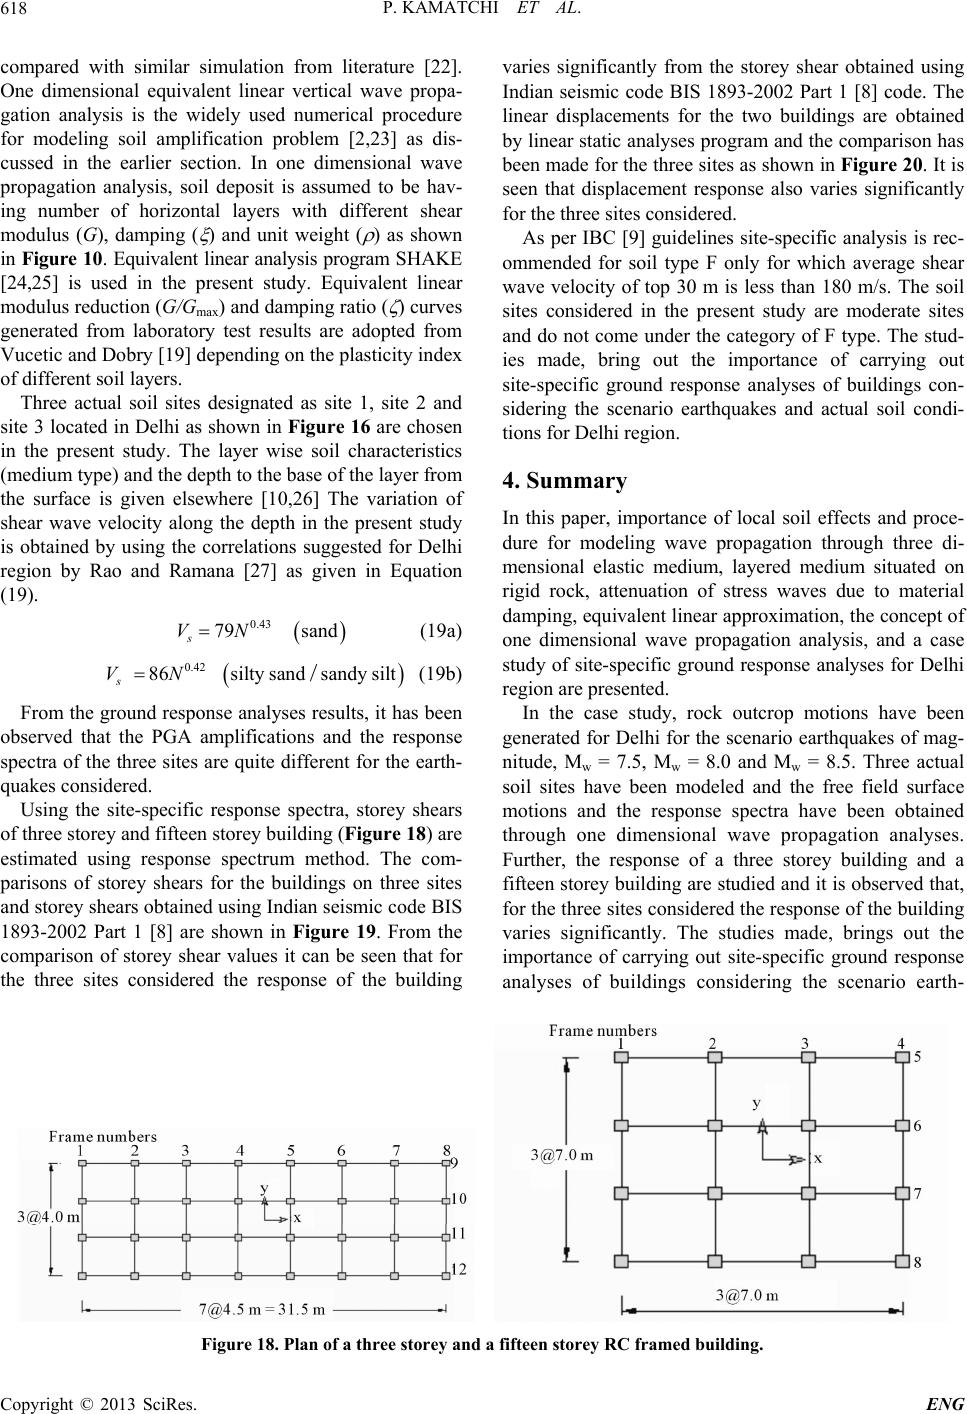 P. KAMATCHI ET AL. Copyright © 2013 SciRes. ENG 618 compared with similar simulation from literature [22]. One dimensional equivalent linear vertical wave propa- gation analysis is the widely used numerical procedure for modeling soil amplification problem [2,23] as dis- cussed in the earlier section. In one dimensional wave propagation analysis, soil deposit is assumed to be hav- ing number of horizontal layers with different shear modulus (G), damping ( ) and unit weight ( ) as shown in Figure 10. Equivalent linear analysis program SHAKE [24,25] is used in the present study. Equivalent linear modulus reduction (G/Gmax) and damping ratio ( ) curves generated from laboratory test results are adopted from Vucetic and Dobry [19] depending on the plasticity index of different soil layers. Three actual soil sites designated as site 1, site 2 and site 3 located in Delhi as shown in Figure 16 are chosen in the present study. The layer wise soil characteristics (medium type) and the depth to the base of the layer from the surface is given elsewhere [10,26] The variation of shear wave velocity along the depth in the present study is obtained by using the correlations suggested for Delhi region by Rao and Ramana [27] as given in Equation (19). (19a) (19b) From the ground response analyses results, it has been observed that the PGA amplifications and the response spectra of the three sites are quite different for the earth- quakes considered. Using the site-specific response spectra, storey shear of three storey and fifteen storey building (Figure 18) are estimated using response spm method. The com- hree sites considered. As per IBC [9] guidelines site-specific a ommended for soil type F only for which a wave velocity of top 30 m is less than 180 m/s. T sites considered in the present study are moderate sites an damping, equivalent linear approximation, the concept of one dimensional wave propagation analysis, and a case study of site-specific ground response analyses for Delhi region are presented. In the case study, rock outcrop motions have been generated for Delhi for the scenario earthquakes of mag- nitude, Mw = 7.5, Mw = 8.0 and Mw = 8.5. Three actual soil sites have been modeled and the free field surface motions and the response spectra have been obtained through one dimensional wave propagation analyses. Further, the response of a three storey building and a fifteen storey building are studied and it is observed that, for the three sites considered the response of the building varies significantly. The studies made, brings out the importance of carrying out site-specific ground response analyses of buildings considering the scenario earth- varies significantly from the storey shear obtained using Indian seismic code BIS 1893-2002 Part 1 [8] code. The linear displacements for the two buildings are obtained by linear static analyses program and the comparison has been made for the three sites as shown in Figure 20. It is seen that displacement response also varies significantly for the t nalysis is rec- verage shear he soil d do not come under the category of F type. The stud- ies made, bring out the importance of carrying out site-specific ground response analyses of buildings con- sidering the scenario earthquakes and actual soil condi- tions for Delhi region. 4. Summary In this paper, importance of local soil effects and proce- dure for modeling wave propagation through three di- mensional elastic medium, layered medium situated on rigid rock, attenuation of stress waves due to material 0.43 79 sand s VN 0.42 86silty sandsandy silt s VN/ s ectru parisons of storey shears for the buildings on three sites and storey shears obtained using Indian seismic code BIS 1893-2002 Part 1 [8] are shown in Figure 19. From the comparison of storey shear values it can be seen that for the three sites considered the response of the building Figure 18. Plan of a three storey and a fifteen storey RC framed building. 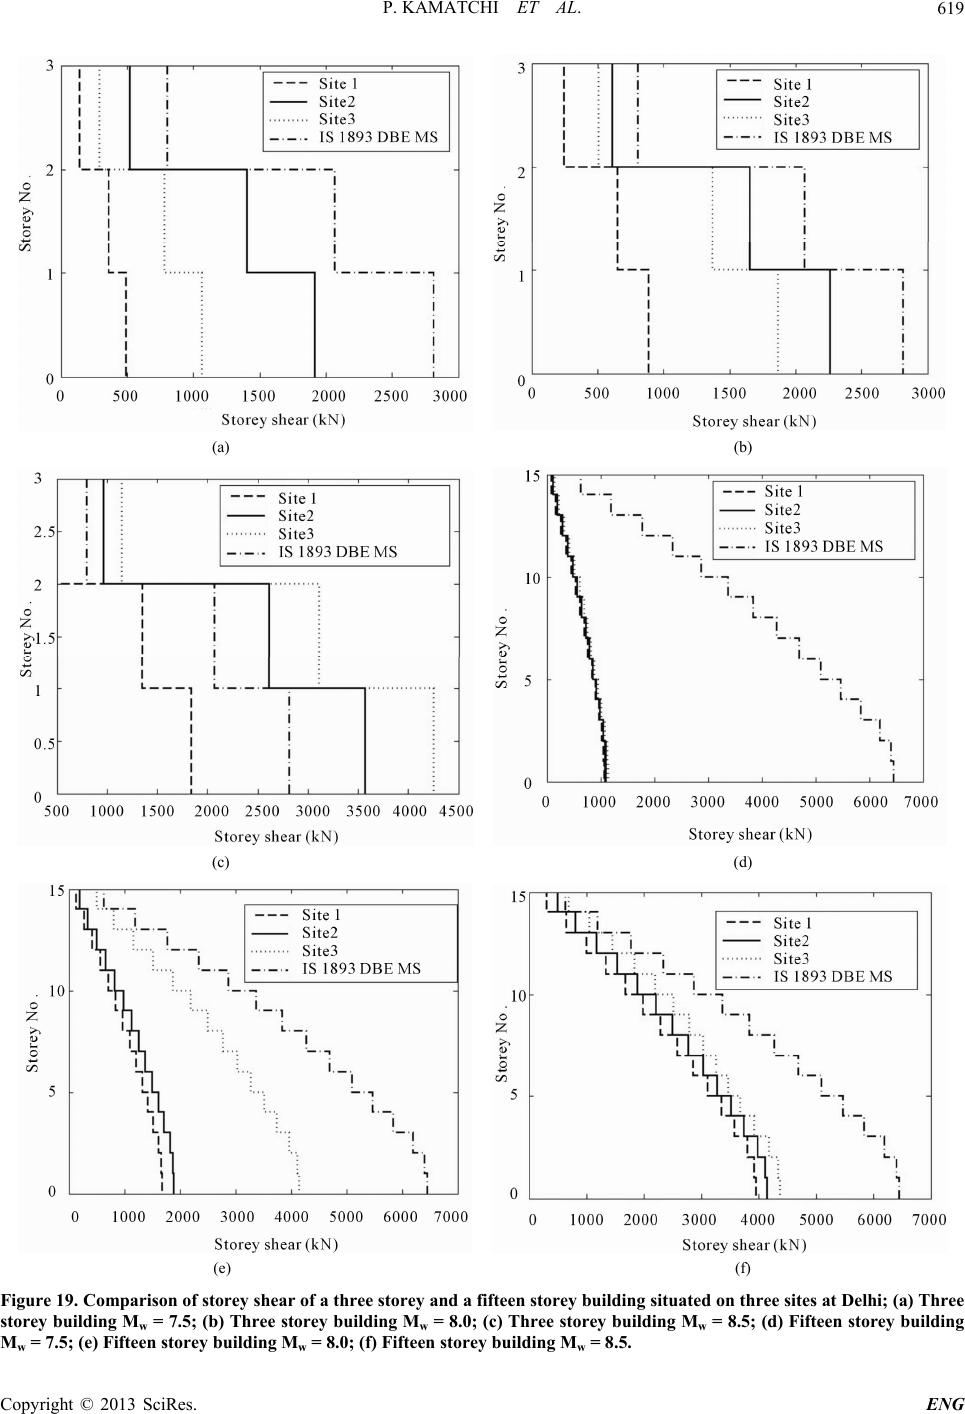 P. KAMATCHI ET AL. 619 (b) (a) (c) (d) (e) (f) Figure 19. Comparison of storey shear of a three storey and a fifteen storey building situated on three sites at Delhi; (a) Three storey building Mw = 7.5; (b) Three storey building Mw = 8.0; (c) Three storey building Mw = 8.5; (d) Fifteen storey building Mw = 7.5; (e) Fifteen storey building Mw = 8.0; (f) Fifteen storey building Mw = 8.5. Copyright © 2013 SciRes. ENG 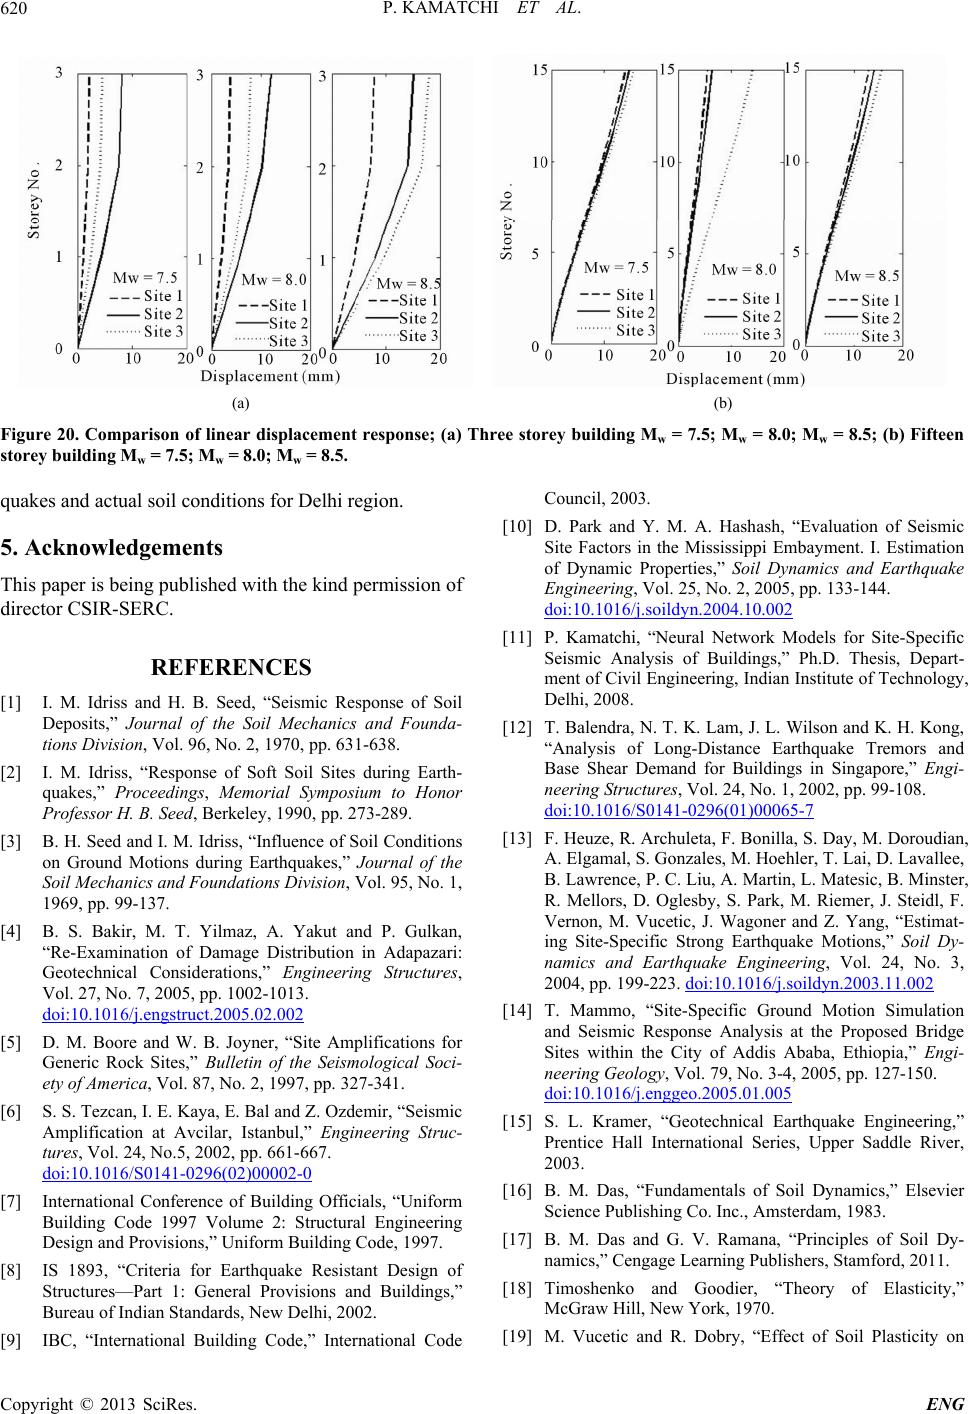 P. KAMATCHI ET AL. Copyright © 2013 SciRes. ENG 620 (a) (b) Figure 20. Comparison of linea.0; Mw = 8.5; (b) Fifteen storey building Mw = 7.5; M quakes and actual soil conditions for Delhi region. 5. Acknowledgements This paper is being published with the kind permission of director CSIR-SERC. REFERENCES [1] I. M. Idriss and H. B. Seed, “Seismic Response of Soil Deposits,” Journal of the Soil Mechanics and Founda- tions Division, Vol. 96, No. 2, 1970, pp. 631-638. [2] I. M. Idriss, “Response of Soft Soil Sites during Earth- quakes,” Proceedings, Memorial Symposium to Honor Professor H. B. Seed, Berkeley, 1990, pp. 273-289. [3] B. H. Seed and I. M. Idriss, “Influence of on Ground Motions du “Re-Examination of Damage Distribution in Adapazari: Geotechnical Considerations,” Engineering Structures, Vol. 27, No. 7, 2005, pp. 1002-1013. doi:10.1016/j.engstruct.2005.02.002 r displacement response; (a) ee storey building Mw = 7.5; Mw = 8 w = 8.0; Mw = 8.5. Thr Soil Conditions ring Earthquakes,” Journal of the Soil Mechanics and Foundations Division, Vol. 95, No. 1, 1969, pp. 99-137. [4] B. S. Bakir, M. T. Yilmaz, A. Yakut and P. Gulkan, [5] D. M. Boore and W. B. Joyner, “Site Amplifications for Generic Rock Sites,” Bulletin of the Seismological Soci- ety of America, Vol. 87, No. 2, 1997, pp. 327-341. [6] S. S. Tezcan, I. E. Kaya, E. Bal and Z. Ozdemir, “Seismic Amplification at Avcilar, Istanbul,” Engineering Struc- tures, Vol. 24, No.5, 2002, pp. 661-667. doi:10.1016/S0141-0296(02)00002-0 [7] International Conference of Building Officials, “Uniform Building Code 1997 Volume 2: Structural Engineering Design and Provisions,” Uniform Building Code, 1997. [8] IS 1893, “Criteria for Earthqu Structures—Part 1: Gene national Code Council, 2003. [10] D. Park and Y. M. A. Hashash, “Evaluation of Seismic Site Factors in the Mississippi Embayment. I. Estimation of Dynamic Properties,” Soil Dynamics and Earthquake Engineering, Vol. 25, No. 2, 2005, pp. 133-144. doi:10.1016/j.soildyn.2004.10.002 [11] P. Kamatchi, “Neural Network Models for Site-Specific Seismic Analysis of Buildings,” Ph.D. Thesis, Depart- ment of Civil Engineering, Indian Institute of Technology, Delhi, 2008. [12] T. Balendra, N. T. K. Lam, J. L. Wilson and K. H. Kong, “Analysis of Long-Distance Earthquake Tremors and Base Shear Demand for Buildings in Singapore,” Engi- neering Structures, Vol. 24, No. 1, 2002, pp. 99-108. doi:10.1016/S0141-0296(01)00065-7 [13] F. Heuze, R. Archuleta, F. Bonilla, S. Day, M. Doroudian, oehler, T. Lai, D. Lavallee, ic Strong Earthquake Motions,” Soil Dy- namics and Earthquake Engineering, Vol. 24, No. 3, 2004, pp. 199-223. doi:10.1016/j.soildyn.2003.11.002 A. Elgamal, S. Gonzales, M. H B. Lawrence, P. C. Liu, A. Martin, L. Matesic, B. Minster, R. Mellors, D. Oglesby, S. Park, M. Riemer, J. Steidl, F. Vernon, M. Vucetic, J. Wagoner and Z. Yang, “Estimat- ing Site-Specif [14] T. Mammo, “Site-Specific Ground Motion Simulation and Seismic Response Analysis at the Proposed Bridge Sites within the City of Addis Ababa, Ethiopia,” Engi- neering Geology, Vol. 79, No. 3-4, 2005, pp. 127-150. doi:10.1016/j.enggeo.2005.01.005 [15] S. L. Kramer, “Geotechnical Earthquake Engineering,” Prentice Hall International Series, Upper Saddle River, 2003. [16] B. M. Das, “Fundamentals of Soil Dynamics,” Elsevier Science Publishing Co. Inc., Amsterdam, 1983. [17] B. M. Das and G. V. Ramana, “Principles of Soil Dy- namics,” Cengage Learning Publishers, Stamford, 2011 r, “Theory of Elasticity,” [19] M. Vucetic and R. Dobry, “Effect of Soil Plasticity on . ake Resistant Design of ral Provisions and Buildings,” [18] Timoshenko and Goodie McGraw Hill, New York, 1970. Bureau of Indian Standards, New Delhi, 2002. [9] IBC, “International Building Code,” Inter  P. KAMATCHI ET AL. 621 pendent Characteristics of Stiffness and Damping,” Soil Cyclic Response,” Journal of Geotechnical Engineering, Vol. 117, No. 1, 1991, pp. 89-107. doi:10.1061/(ASCE)0733-9410(1991)117:1(89) [20] I. A. Beresnev and G. M. Fault Radiation from the Atkinson, “Modeling Finite— n Spectrum,” Bulletin of the [21] I. A. Beresnev and G. M. Atkinson, “FINSIM—A FOR- TRAN Prograastic Acceleration Time HistorieSeismological Re- Seismological Society of America, Vol. 87, No. 1, 1997, pp. 67-84. m for Simulating Stoch s from Finite Faults,” search Letters, Vol. 69, No. 1, 1998, pp. 27-32. doi:10.1785/gssrl.69.1.27 [22] S. K. Singh, W. K. Mohanty, B. K. Bansal and G. S. Roonwal, “Ground Motion in Delhi from Future Large/Great Earthquakes in the Central Seismic Gap of the Himalayan Arc,” Bulletin of the Seismological Society of America, Vol. 92, No. 2, 2002, pp. 555-569. doi:10.1785/0120010139 [23] N. Yoshida, S. Kobayashi, I. Suetomi and K. Miura, “Equivalent Linear Method Considering Frequency De- Dynamics and Earthquake Engineering, Vol. 22, No. 3, 2002, pp. 205-222. doi:10.1016/S0267-7261(02)00011-8 [24] P. B. Schnabel, J. Lysmer and H. B. Seed, “SHAKE, a Computer Program for Earthquake Response Analysis of Horizontally Layered Sites,” Report No. EERC 72-12, io Earthquakes,” Proceedings of the 14th World f Earthquake Engineering Research Center, University of California, Berkeley, 1972. [25] G. A. Ordonez, “SHAKE 2000: A Computer Program for the I-D Analysis of Geotechnical Earthquake Engineering Problems,” 2000. [26] P. Kamatchi, G. V. Ramana, A. K Nagpal and N. Lakshmanan, “Site-Specific Analysis of Delhi Region for Scenar Conference on Earthquake Engineering, Beijing, 12-17 October 2008. [27] H. Ch. Rao and G. V. Ramana, “Correlation between Shear Wave Velocity and N Value for Yamuna Sand o Delhi,” Proceedings of International Conference on Geo- technical Engineering, UAE, 2004, pp. 262-268. Copyright © 2013 SciRes. ENG
|